Abstract
Automatic exposure control (AEC) modulates tube current and consequently X-ray exposure in CT. We investigated the behavior of AEC systems in whole-body PET/CT. CT images of a whole-body phantom were acquired using AEC on two scanners from different manufactures. The effects of scout imaging direction and arm positioning on dose modulation were evaluated. Image noise was assessed in the chest and upper abdomen. On one scanner, AEC using two scout images in the posteroanterior (PA) and lateral (Lat) directions provided relatively constant image noise along the z-axis with the arms at the sides. Raising the arms increased tube current in the head and neck and decreased it in the body trunk. Image noise increased in the upper abdomen, suggesting excessive reduction in radiation exposure. AEC using the PA scout alone strikingly increased tube current and reduced image noise in the shoulder. Raising the arms did not substantially influence dose modulation and decreased noise in the abdomen. On the other scanner, AEC using the PA scout alone or Lat scout alone resulted in similar dose modulation. Raising the arms increased tube current in the head and neck and decreased it in the trunk. Image noise was higher in the upper abdomen than in the middle and lower chest, and was not influenced by arm positioning. CT dose modulation using AEC may vary greatly depending on scout direction. Raising the arms tended to decrease radiation exposure; however, the effect depends on scout direction and the AEC system.
Keywords: PET/CT, radiation dose, automatic exposure control, scout imaging, arm positioning
Introduction
In positron emission tomography (PET)/computed tomography (CT) for oncology practice, CT covering the whole body is usually acquired together with PET mainly for attenuation correction of PET images and localization of lesions detected by PET. CT offers valuable supplementary information but increases radiation exposure to various degrees [1-6]. When acquiring whole-body PET/CT, effective dose derived from CT may exceed that derived from injection of the radiotracer. In CT, reduction in radiation exposure decreases detected photons and consequently increases image noise, possibly leading to impaired diagnostic performance. Imaging conditions should be optimized considering a balance between potential risks related to radiation exposure and clinical benefits.
Automatic exposure control (AEC) is commonly used in modern CT and automatically modulates radiation exposure [7,8]. In a large patient, AEC increases tube current and consequently X-ray exposure to compensate for attenuation by the thick tissues and preserve the number of detected photons. Radiation exposure is also modulated in a given patient along the z-axis. Due to differences in photon attenuation, higher tube current is applied in imaging the body trunk than in imaging the head and neck, and in imaging the shoulder region (having a long horizontal diameter and a large amount of bony structures) than in imaging the lower thorax (containing a large fraction of air in the lung). AEC adjusts radiation exposure for each patient and for each location, and is expected to allow reducing radiation dose while keeping image quality constant.
Because AEC plays a critical role in determining radiation dose and image quality in CT, understanding of its behavior is important in oncology PET/CT practice. AEC determines tube current mainly based on scout images obtained to define the scan range. Scout images may be acquired in the posteroanterior (PA), anteroposterior (AP) and lateral (Lat) directions. In CT using AEC, radiation dose may vary according to the direction of the scout image used to determine dose modulation [9-13]. Additionally, although dedicated, diagnostic CT of the body trunk is usually acquired with the patient’s arms raised, PET/CT is often performed with the arms down at the sides of the trunk considering its long examination time. Attenuation of X-ray photons by the arms is expected to increase tube current required for data acquisition [6,14] and streak artifacts in reconstructed images [15]. AEC systems differ between manufacturers in terms of parameters to be set and resulting radiation dose modulation [11,16,17]. The effect of the direction of scout imaging and arm positioning may also differ between AEC systems. In the present study, we acquired CT images of a whole-body CT phantom on scanners from two manufacturers, under various settings in terms of the direction of scout images, arm positioning and parameters for AEC. The aim of this study was to investigate the characteristics of AEC-based dose modulation in the CT component of whole-body PET/CT.
Methods and materials
Instruments
A PET/CT scanner Biograph mCT Flow (Siemens, Erlangen, Germany), consisting of a PET scanner and a 32-detector-row CT scanner, and a dedicated 64-detector-row CT scanner Optima CT 660 Discovery Edition (GE Healthcare, Milwaukee, WI) were used. The Optima CT scanner is incorporated into GE PET/CT scanners.
An anthropomorphic whole-body phantom PBU-10 (Kyoto Kagaku, Co., Kyoto, Japan) was imaged with these CT scanners. The left hand of the phantom had been lost. The phantom was set on the imaging table in a head-first, supine position at the center of the gantry. After acquisition of scout images, CT images were obtained from the top of the head to the proximal portion of the thigh under various settings. The arms were positioned at the sides of the trunk (arms down) or beside the head (arms up) (Figure 1). Acquisition of the scout and CT images under each setting was performed in triplicate.
Figure 1.
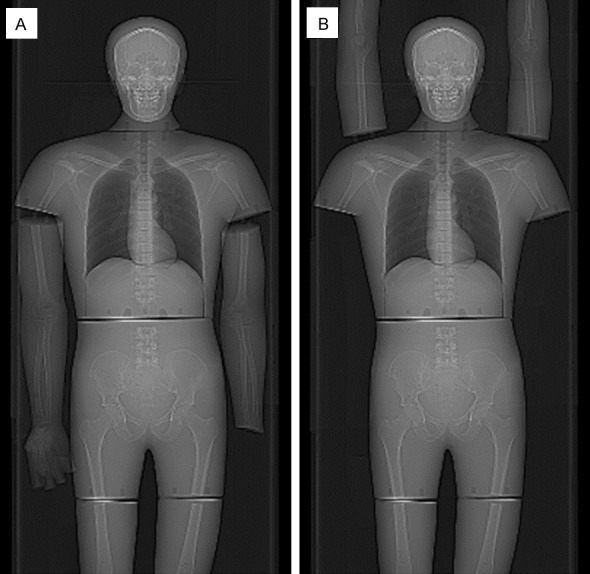
Scout images of the phantom with the arms down (A) and up (B).
Imaging procedures with the Siemens scanner
Experimental settings for the Siemens scanner are listed in Table 1. CARE Dose 4D was used for AEC. CT images were also obtained without AEC, with the tube current-time product fixed at 50 mAs. CARE Dose 4D initially determines tube current modulation using scout images, and modifies it during the CT acquisition based on attenuation estimated in the preceding rotation (real-time modulation). Scout images in two different directions are used when available. In this study, dose modulation was mainly performed using the PA scout image alone (PA scout) or a combination of the PA and Lat scout images (PA + Lat scout). For comparison, imaging was also performed with the arms down using the AP scout image alone (AP scout), the Lat scout image alone (Lat scout) or a combination of the AP and Lat scout images (AP + Lat scout). The strength of dose modulation was average decrease (slim) and average increase (obese) modulation in many settings. It was manipulated in imaging with the arms down, and CT images were also acquired with strong decrease/strong increase modulation and weak decrease/weak increase modulation. When the size of the imaging object is changed, strong and weak modulations cause larger and smaller changes in tube current, respectively. Quality reference mAs is a parameter to define image quality to be obtained, and higher quality reference mAs results in higher tube current and consequently higher image quality. In this study, the quality reference mAs was 50 mAs in many settings and changed to 25 mAs or 100 mAs in some settings.
Table 1.
Imaging settings and effective doses for the Siemens scanner
| No. | Arms | mAs | Scout | Strength | ED (mSv) |
|---|---|---|---|---|---|
| 1 | Down | 50 | PA + Lat | Average | 3.2 |
| 2 | Down | 50 | PA | Average | 4.2 |
| 3 | Down | 50 | 4.9 | ||
| 4 | Down | 25 | PA + Lat | Average | 1.6 |
| 5 | Down | 25 | PA | Average | 2.1 |
| 6 | Down | 100 | PA + Lat | Average | 6.6 |
| 7 | Down | 100 | PA | Average | 8.6 |
| 8 | Down | 50 | AP + Lat | Average | 3.2 |
| 9 | Down | 50 | AP | Average | 3.3 |
| 10 | Down | 50 | Lat | Average | 3.4 |
| 11 | Down | 50 | PA + Lat | Weak | 3.4 |
| 12 | Down | 50 | PA | Weak | 4.0 |
| 13 | Down | 50 | PA + Lat | Strong | 3.4 |
| 14 | Down | 50 | PA | Strong | 5.2 |
| 15 | Up | 50 | PA + Lat | Average | 2.0 |
| 16 | Up | 50 | PA | Average | 4.1 |
| 17 | Up | 50 | 4.9 | ||
| 18 | Up | 25 | PA + Lat | Average | 1.0 |
| 19 | Up | 25 | PA | Average | 1.9 |
| 20 | Up | 100 | PA + Lat | Average | 4.2 |
| 21 | Up | 100 | PA | Average | 8.4 |
mAs = quality reference mAs when AEC was applied; Scout = direction of the scout image(s) used for dose modulation; Strength = strength of dose modulation; ED = effective dose. Only mean values are presented for ED because all SDs are 0.0.
Other scan parameters for CT were as follows: helical mode; tube voltage, 120 kV; beam pitch, 1.5; rotation time, 0.5 s; beam collimation, 1.2 × 16 mm; slice thickness, 3 mm; slice interval, 3 mm. CT images were reconstructed with the reconstruction kernel of i40f medium, sinogram-affirmed iterative reconstruction (SAFIRE, level 3), and a field of view of 500 mm. Parameters for scout imaging were tube voltage, 120 kV; tube current, 35 mA; table speed, 100 mm/s; beam collimation, 0.6 × 6 mm. These parameters were determined based on our PET/CT clinical practice.
Imaging procedures with the GE scanner
Experimental settings for the GE scanner are listed in Table 2. The AEC system used was 3D mA modulation, and the parameters used were a noise index of 28.5, maximum current of 100 or 560 mA, and minimum current of 15 mA. The maximum and minimum current values define the upper and lower limits of tube current, respectively. The 3D mA modulation determines tube current modulation using a single scout image, without real-time modulation during CT acquisition. When scout images are obtained in two different directions, the image obtained second is used. In this study, dose modulation was performed using the PA scout image alone (PA scout) or the Lat scout image alone (Lat scout).
Table 2.
Imaging settings and effective doses for the GE scanner
| No. | Arms | Max | Scout | ED (mSv) |
|---|---|---|---|---|
| 1 | Down | 100 | PA | 3.1 |
| 2 | Down | 100 | Lat | 3.1 |
| 3 | Down | 560 | PA | 3.3 |
| 4 | Down | 560 | Lat | 3.1 |
| 5 | Up | 100 | PA | 2.2 |
| 6 | Up | 100 | Lat | 2.1 |
| 7 | Up | 560 | PA | 2.4 |
| 8 | Up | 560 | Lat | 2.1 |
Max = maximum current; Scout = direction of the scout image used for dose modulation; ED = effective dose. Only mean values are presented for ED because all SDs are small (0.0 or 0.1).
Other scan parameters for CT were as follows: helical mode; tube voltage, 120 kV; beam pitch, 1.375; rotation time, 0.6 s; beam collimation, 0.625 × 64 mm; slice thickness, 3.75 mm; slice interval, 3 mm. CT images were reconstructed with the Plus mode, adaptive statistical iterative reconstruction (ASiR, 50% IR blending), and a field of view of 500 mm. Parameters for scout imaging were tube voltage, 120 kV; tube current, 10 mA; table speed, 100 mm/s; beam collimation, 0.625 × 8 mm. These parameters were determined based on the vendor’s recommendation for PET/CT.
Estimation of radiation dose
The tube current value for each slice was extracted from the DICOM tag and plotted against slice location to produce a tube current modulation curve. The scan range was divided into six anatomical regions, i.e., head and neck, shoulder, chest, abdomen, pelvis and proximal thigh, and mean current for each region was calculated (Figure 2). Effective dose for each anatomical region was estimated using CT-Expo software (version 2.2; Medizinische Hochschule, Hanover, Germany) dedicated to CT dose estimation, and the sum of the six regional effective doses were calculated as effective dose for the examination [5]. Tissue weighting factors presented in International Commission on Radiological Protection (ICRP) publication 103 [18] for the male model were used.
Figure 2.
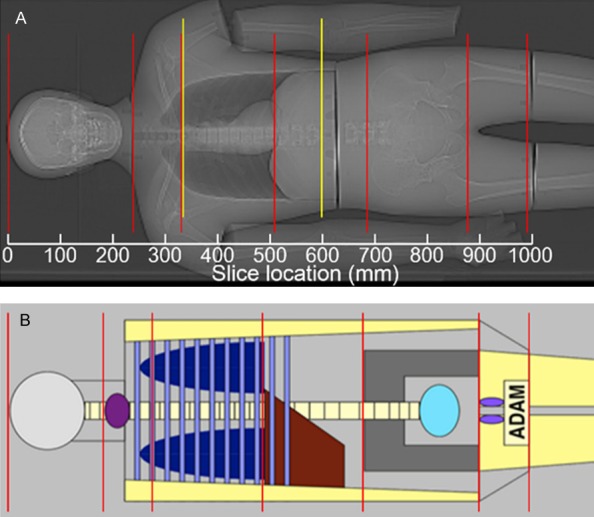
A scout image of the phantom displayed with slice location (A) and the male image of CT-Expo software (B). Red lines indicate division of the scan range into 6 anatomical regions (head and neck, shoulder, chest, abdomen, pelvis and proximal thigh). Yellow lines indicate the range where image noise was assessed.
Estimation of image noise
Circular regions of interest (ROIs) of 2-cm diameter were placed in the mediastinum and liver on a picture archiving and communication system (PACS) viewer (EV Insite; PSP Corp., Tokyo, Japan), and the standard deviations (SDs) of the CT values in the ROIs were assessed as indices of image noise. The evaluated image sets were those obtained on the Siemens scanner with fixed tube current, those obtained on the Siemens scanner using the PA + Lat scout or PA scout with the arms down or up (quality reference mAs of 50 mAs, average modulation), and those obtained on the GE scanner at maximum mA of 100 mA using the PA scout with the arms down or up.
Consecutive slices displaying the mediastinum or the upper portion of the liver were analyzed (Figure 2A). ROIs were not placed at the level of the lung apex due to the small size of the mediastinum at the level. On each of the consecutive slices, one ROI was placed in the mediastinum or liver near the center in the right-to-left direction, avoiding prominent streak artifacts. The SDs obtained from the three image sets for each setting were averaged and plotted against slice location.
Results
Tube current modulation curve
Tube current modulation curves were similar between triplicate imagings for each setting. Curves obtained from the first imaging of triplicate imagings are presented in Figures 3, 4, 5 and 6.
Figure 3.
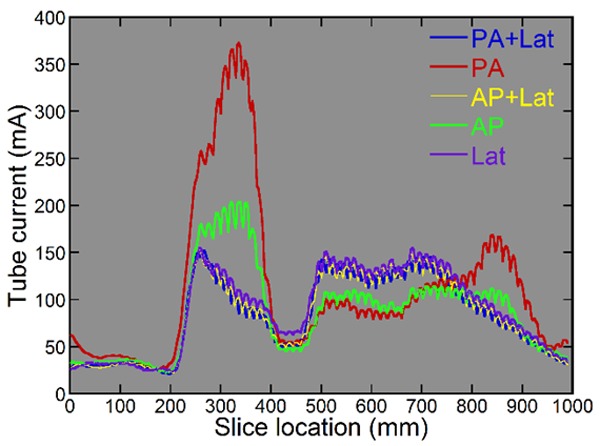
Tube current modulation curves obtained using various scout images on the Siemens scanner. Imaging was performed with the arms down.
Figure 4.
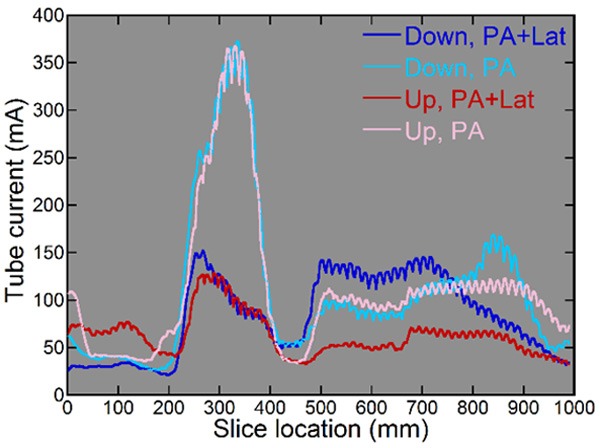
Tube current modulation curves and arm positioning on the Siemens scanner. Imaging was performed with the arms down or up using the PA + Lat scout or PA scout.
Figure 5.
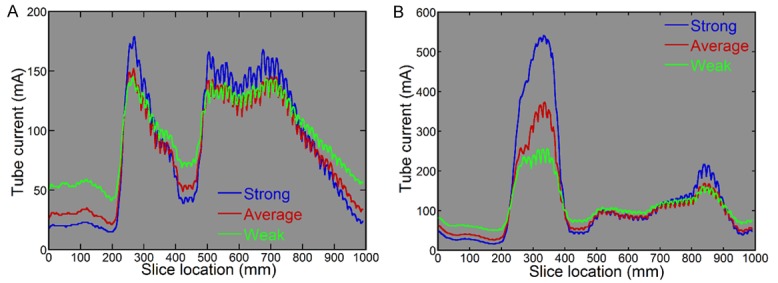
Tube current modulation curves obtained under different modulation strength settings on the Siemens scanner. Imaging was performed using the PA + Lat scout (A) or PA scout (B) with the arms down.
Figure 6.
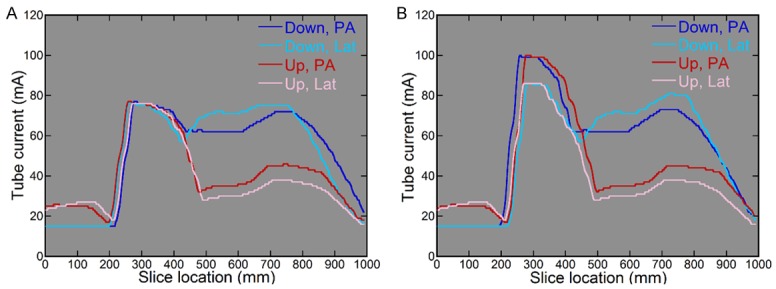
Tube current modulation curves obtained on the GE scanner with the maximum currents of 100 mA (A) or 560 mA (B). Imaging was performed with the arms down or up using the PA or Lat scout.
The effect of scout direction on tube current modulation was examined on the Siemens scanner with the arms down, quality reference mAs of 50 mAs and average modulation (Figure 3). Using the PA + Lat scout, tube current was low in the head and neck, increased in the shoulder, decreased in the chest, increased again in the abdomen to a level similar to the shoulder, and decreased gradually in the pelvis and proximal thigh. The modulation curve obtained for the AP + Lat scout was almost the same as that for the PA + Lat scout. Tube current was slightly higher when using the Lat scout but the modulation pattern was consistent with that using the PA + Lat scout. Notably, increase in the shoulder was much more prominent using the PA scout. Increase in the abdomen was reduced compared to that shown using the PA + Lat scout, and a minor peak was observed in the lower pelvis. Using the AP scout, tube current in the shoulder was higher than using the Lat-type scouts (i.e., the PA + Lat scout, AP + Lat scout and Lat scout) and much lower than using the PA scout. Tube current in the abdomen was comparable to that using the PA scout, but the peak in the lower pelvis disappeared.
The effect of arm positioning was examined on the Siemens scanner with quality reference mAs of 50 mAs and average modulation (Figure 4). Using the PA + Lat scout, raising the arms increased tube current in the head and neck and decreased it in the trunk, especially in the abdomen. Using the PA scout, the effect of arm positioning was limited, except that raising the arms removed the peak in the lower pelvis shown with the arms down. With the arms up, tube current in the abdomen was lower using the PA + Lat scout and higher using the PA scout, as compared to tube current in the head and neck.
Regarding the strength setting of dose modulation, stronger modulation setting mildly enhanced changes in tube current when using the PA + Lat scout, decreasing tube current in the head and neck, chest and proximal thigh while increasing it in the shoulder and abdomen (Figure 5A). When using the PA scout, tube current increase in the shoulder was more prominent for stronger modulation setting (Figure 5B). When quality reference mAs was manipulated, tube current increased almost in proportion to the quality reference mAs value, and the shape of the modulation curve was not changed substantially (data not shown).
On the GE scanner, the effect of scout direction on tube current modulation was smaller than on the Siemens scanner. When maximum mA was set at 100 mA (Figure 6A), tube current was low and corresponded to the minimum mA value in the head and neck with the arms down. Tube current increased in the shoulder, remained almost constant in the chest and abdomen, and decreased gradually in the pelvis and proximal thigh, irrespective of scout direction. Raising the arms increased tube current in the head and neck and decreased it in the abdomen and pelvis. When maximum mA was set at 560 mA, increase in tube current in the shoulder became mildly more evident (Figure 6B).
Effective dose
Effective dose was almost proportional to quality reference mAs on the Siemens scanner (Table 1). With the arms down and quality reference mAs of 50 mAs, effective dose was larger using the PA scout (4.2 mSv) than using the other four scout techniques (3.2-3.4 mSv). Raising the arms reduced effective dose by 36%-48% when using the PA + Lat scout, but did not change it substantially when using the PA scout, thus increasing the difference between the PA + Lat scout and PA scout. On the GE scanner, differences in effective dose were limited between different scout directions and different maximum mA values (Table 2). Effective dose was 26%-32% lower with the arms up than with the arms down.
Image noise
The presence of the arms within the CT slice produced streak artifacts extending from the arms. Image quality was impaired in the body trunk with the arms down (Figure 7) and in the head and neck with the arms up.
Figure 7.
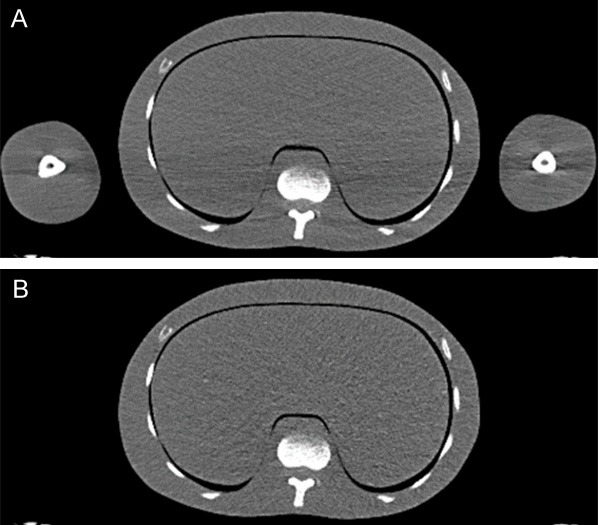
CT images of the abdomen obtained on the Siemens scanner with the arms down (A) or up (B). Imaging was performed using the PA + Lat scout with quality reference mAs of 50 mAs and average modulation.
On the Siemens scanner, image noise was higher in the abdomen than in the chest with fixed tube current (Figure 8A). Raising the arms decreased image noise in the lower chest and abdomen. When AEC using the PA + Lat scout was applied (Figure 8B), image noise became more constant along the z-axis with the arms down, except for a dip around the top of the liver. Raising the arms increased image noise in the abdomen. Using the PA scout (Figure 8C), image noise was definitely lower in the upper chest and increased caudally in the chest. Noise increased further in the abdomen with the arms down. Raising the arms decreased noise in the abdomen to a level similar to that in the lower chest. The dip around the liver top was observed irrespective of imaging setting when using Siemens AEC. On the GE scanner (Figure 8D), image noise was high in the upper chest and abdomen and low in the middle and lower chest. Arm positioning did not affect noise levels substantially.
Figure 8.
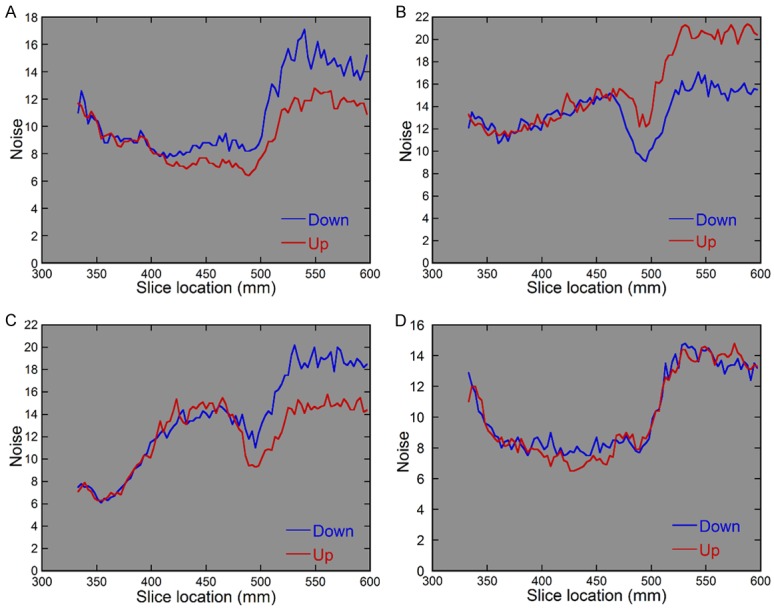
Image noise plotted against slice location for images obtained on the Siemens scanner with fixed tube current (A), those obtained on the Siemens scanner using the PA + Lat scout (B), those obtained on the Siemens scanner using the PA scout (C), and those obtained on the GE scanner (D).
Discussion
AEC modulates tube current mainly based on scout images. While preset protocols on the Siemens dedicated CT scanners use the PA + Lat scout in body imaging, we used PA scout alone in our PET/CT practice before the present study, according to the vendor’s recommendation. This discrepancy appears to occur because defining the scan range is easy for whole-body PET/CT and a Lat scout image is not required for this purpose. However, lack of the Lat view may increase radiation dose when Siemens CARE Dose 4D is used [9-13]. The present study simulating the CT component of whole-body PET/CT demonstrated that the tube current modulation curves and effective dose varied substantially depending on scout direction using CARE Dose 4D. While dose modulation did not differ substantially among the Lat-type scouts, radiation dose was much higher in the shoulder and lower in the abdomen using the PA scout, resulting in larger effective dose. Stronger modulation setting made dose increase in the shoulder using the PA scout more prominent. Although the PA scout is preferable to the AP scout for reducing radiation exposure to the breast and thyroid in scout imaging itself [19], higher CT doses have been reported using the PA scout than using the AP scout in chest phantom studies [11,12]. The present study demonstrated definite differences in dose modulation between the PA scout and AP scout: prominent dose increase in the shoulder observed using the PA scout was reduced when using the AP scout. It should be noted that the direction of scout imaging may substantially affect CT dose modulation and effective dose in whole-body CT using AEC. The method of scout imaging should be determined considering not only determination of the scan range but also dose modulation.
Although dedicated, diagnostic CT of the body is performed with the arms up, PET/CT is often performed with the arms down. Attenuation of X-rays by the arms produces streak artifacts [15], significantly impairing image quality, and may increase radiation exposure [6,14]. With the arms down, the arms are present in the slices displaying the body trunk and absent in the slices displaying the head and neck. As a result, streak artifacts appear in the trunk. AEC is expected to decrease radiation exposure in the head and neck and to increase it in the body trunk. Overall CT dose in whole-body PET/CT has been demonstrated to decrease with the arms up [6,14]. In the present study, the effects of arm positioning on dose modulation were observed as expected when images were acquired using the PA + Lat scout on the Siemens scanner. Raising the arms resulted in reduction in effective dose. However, when using the PA scout, the effects of arm positioning on dose modulation and effective dose were limited, and raising the arms did not cause reasonable changes in radiation exposure. It should be noted that the effect of arm positioning varies depending on scout direction.
The effect of scout direction on dose modulation was small when GE 3D mA modulation was used. Raising the arms increased radiation dose in the head and neck and decreased it in the body trunk, decreasing effective dose. The effect of arm positioning on dose modulation did not differ substantially between the PA scout and Lat scout. It has been shown that dose modulation in imaging a given object differs substantially depending on the AEC system [11,16,17]. The present study demonstrated that the effects of scout direction and arm positioning are also different between AEC systems.
To evaluate the appropriateness of dose modulation, we assessed z-axis profiles of image noise. When imaging was performed on the Siemens scanner at fixed tube current without AEC, image noise was higher in the abdomen than in the chest, and raising the arms decreased noise in the lower chest and abdomen. These results are consistent with the principle that increase in X-ray attenuation increases image noise at fixed tube current.
Although constant image noise would be ideal, noise varied greatly along the z-axis even using AEC. On the Siemens scanner, a localized decrease in image noise was shown around the top of the liver. When the imaging area is moved from the chest to the abdomen, AEC increases radiation dose to compensate for increased tissue attenuation. The observed localized noise reduction indicates that radiation dose increases too early. When using the PA + Lat scout, image noise was relatively constant with the arms down except around the liver top; however, the noise increased in the abdomen after raising the arms. Raising the arms decreased radiation dose in the abdomen greatly when using the PA + Lat scout, and the high image noise indicates that this decrease is excessive and beyond the level corresponding to decrease in attenuation. Using the PA scout, image noise was definitely low in the upper chest. Radiation dose was very high in the shoulder. Although image noise was not fully assessed in this high-dose region because of the difficulty in setting appropriate ROIs, the increased dose in the shoulder appears to be excessive to keep image quality constant. Although image noise was similar between the lower chest and abdomen with the arms up, it was higher in the abdomen with the arms down. Radiation dose in the abdomen did not change depending on arm position when using the PA scout. High image noise with the arms down indicates that the lack of change in dose is inappropriate and causes deficiency of radiation exposure. On the GE scanner, image noise did not vary depending on arm positioning, indicating that attenuation by the arms was successfully compensated for by the AEC. However, image noise was high in the upper chest and abdomen, and higher radiation dose would be required in these regions. Although AEC-based dose modulation would be helpful to compensate for patient-by-patient variation in body size, further optimization is desired for the z-axis modulation in a given patient.
In our facility, whole-body PET/CT was previously performed with the arms down. However, considering streak artifacts and radiation dose, we now perform PET/CT with the arms up when the body trunk is the main target. As for the scout direction, we changed from the PA scout to the PA + Lat scout based on the results of the present study mainly to avoid excessive radiation exposure in the shoulder, which may deliver excessive radiation to the thyroid. To depress dose from acquisition of two scout images, tube current for scout imaging was reduced from 35 mA (default setting) to 20 mA. Phantom experiments demonstrated that this reduction does not change CT dose modulation substantially (data not shown). The effective dose of the Lat scout imaging at 20 mA was calculated by ImpactDose (v2.2; CT Imaging GmbH, Erlargen, Germany) to be 0.03 and 0.04 mSv for the male and female models, respectively. The addition of the Lat scout imaging would be justifiable.
Conclusion
When acquiring the CT component of whole-body PET/CT using AEC, dose modulation along the z-axis may vary greatly depending on the direction of scout imaging. Imaging with the patient’s arms raised tended to decrease radiation exposure; however, the effect of arm positioning varies depending on the scout direction and type of the AEC system. The behavior of AEC in relation to scout imaging and arm positioning is variable, which should be recognized for PET/CT practice.
Disclosure of conflict of interest
None.
References
- 1.Wu TH, Huang YH, Lee JJ, Wang SY, Wang SC, Su CT, Chen LK, Chu TC. Radiation exposure during transmission measurements: comparison between CT- and germanium-based techniques with a current PET scanner. Eur J Nucl Med Mol Imaging. 2004;31:38–43. doi: 10.1007/s00259-003-1327-6. [DOI] [PubMed] [Google Scholar]
- 2.Brix G, Lechel U, Glatting G, Ziegler SI, Münzing W, Müller SP, Beyer T. Radiation exposure of patients undergoing whole-body dual-modality 18F-FDG PET/CT examinations. J Nucl Med. 2005;46:608–613. [PubMed] [Google Scholar]
- 3.Khamwan K, Krisanachinda A, Pasawang P. The determination of patient dose from 18F-FDG PET/CT examination. Radiat Prot Dosimetry. 2010;141:50–55. doi: 10.1093/rpd/ncq140. [DOI] [PubMed] [Google Scholar]
- 4.Etard C, Celier D, Roch P, Aubert B. National survey of patient doses from whole-body FDG PET-CT examinations in France in 2011. Radiat Prot Dosimetry. 2012;152:334–338. doi: 10.1093/rpd/ncs066. [DOI] [PubMed] [Google Scholar]
- 5.Inoue Y, Nagahara K, Tanaka Y, Miyatake H, Hata H, Hara T. Methods of CT dose estimation in whole-body 18F-FDG PET/CT. J Nucl Med. 2015;56:695–700. doi: 10.2967/jnumed.114.153718. [DOI] [PubMed] [Google Scholar]
- 6.Martí-Climent JM, Prieto E, Morán V, Sancho L, Rodríguez-Fraile M, Arbizu J, García-Velloso MJ, Richter JA. Effective dose estimation for oncological and neurological PET/CT procedures. EJNMMI Res. 2017;7:37. doi: 10.1186/s13550-017-0272-5. [DOI] [PMC free article] [PubMed] [Google Scholar]
- 7.Kalra MK, Maher MM, Toth TL, Schmidt B, Westerman BL, Morgan HT, Saini S. Techniques and applications of automatic tube current modulation for CT. Radiology. 2004;233:649–657. doi: 10.1148/radiol.2333031150. [DOI] [PubMed] [Google Scholar]
- 8.Lee CH, Goo JM, Ye HJ, Ye SJ, Park CM, Chun EJ, Im JG. Radiation dose modulation techniques in the multidetector CT era: from basics to practice. Radiographics. 2008;28:1451–1459. doi: 10.1148/rg.285075075. [DOI] [PubMed] [Google Scholar]
- 9.Papadakis AE, Perisinakis K, Damilakis J. Automatic exposure control in pediatric and adult multidetector CT examinations: a phantom study on dose reduction and image quality. Med Phys. 2008;35:4567–4576. doi: 10.1118/1.2977535. [DOI] [PubMed] [Google Scholar]
- 10.Singh S, Petrovic D, Jamnik E, Aran S, Pourjabbar S, Kave ML, Bradley SE, Choy G, Kalra MK. Effect of localizer radiograph on radiation dose associated with automatic exposure control: human cadaver and patient study. J Comput Assist Tomogr. 2014;38:293–298. doi: 10.1097/RCT.0000000000000035. [DOI] [PubMed] [Google Scholar]
- 11.Franck C, Bacher K. Influence of localizer and scan direction on the dose-reducing effect of automatic tube current modulation in computed tomography. Radiat Prot Dosimetry. 2016;169:136–142. doi: 10.1093/rpd/ncw077. [DOI] [PubMed] [Google Scholar]
- 12.Söderberg M. Overview, practical tips and potential pitfalls of using automatic exposure control in ct: siemens CARE dose 4D. Radiat Prot Dosimetry. 2016;169:84–91. doi: 10.1093/rpd/ncv459. [DOI] [PubMed] [Google Scholar]
- 13.Peng W, Li Z, Xia C, Guo Y, Zhang J, Zhang K, Li L, Zhao F. A CONSORT-compliant prospective randomized controlled trial: radiation dose reducing in computed tomography using an additional lateral scout view combined with automatic tube current modulation: phantom and patient study. Medicine (Baltimore) 2017;96:e7324. doi: 10.1097/MD.0000000000007324. [DOI] [PMC free article] [PubMed] [Google Scholar]
- 14.Seong JH, Park SK, Kim JS, Jung WY, Kim HS, Dong KR, Chung WK, Cho JH, Young-Kuk Cho YK. A comparative study on the CT effective dose for various positions of the patient’s arm. J Korean Phys Soc. 2012;61:1137–1142. [Google Scholar]
- 15.Römer W, Chung M, Chan A, Townsend DW, Torok F, McCook B, Federle MP, Avril N. Single-detector helical CT in PET-CT: assessment of image quality. AJR Am J Roentgenol. 2004;182:1571–1577. doi: 10.2214/ajr.182.6.1821571. [DOI] [PubMed] [Google Scholar]
- 16.Söderberg M, Gunnarsson M. Automatic exposure control in computed tomography--an evaluation of systems from different manufacturers. Acta Radio. 2010;51:625–634. doi: 10.3109/02841851003698206. [DOI] [PubMed] [Google Scholar]
- 17.Iball GR, Tout D. Computed tomography automatic exposure control techniques in 18F-FDG oncology PET-CT scanning. Nucl Med Commun. 2014;35:372–381. doi: 10.1097/MNM.0000000000000064. [DOI] [PubMed] [Google Scholar]
- 18.The 2007 recommendations of the international commission on radiological protection. ICRP Publication 103. Ann ICRP. 2007;37:1–332. doi: 10.1016/j.icrp.2007.10.003. [DOI] [PubMed] [Google Scholar]
- 19.Schmidt BT, Hupfer M, Saltybaeva N, Kolditz D, Kalender WA. Dose optimization for computed tomography localizer radiographs for low-dose lung computed tomography examinations. Invest Radiol. 2017;52:81–86. doi: 10.1097/RLI.0000000000000311. [DOI] [PubMed] [Google Scholar]


