

Abstract
Purpose
We prospectively compared computed tomography (CT)- and magnetic resonance imaging (MRI)-based high-risk clinical target volume (HR-CTV) contours at the time of brachytherapy for cervical cancer in an effort to identify patients who may benefit most from MRI-based planning.
Methods and Materials
Thirty-seven patients who had a pretreatment diagnostic MRI were included in the analysis. We delineated the HR-CTV on the brachytherapy CT and brachytherapy MRI scans independently for each patient. We then calculated the absolute volumes for each HR-CTV, as well as the Dice coefficient of similarity (DC, a measure of spatial agreement) for the HR-CTV contours. We identified clinical and tumor factors associated with (1) discrepancy in volume between the CT HR-CTV and MRI HR-CTV contours and (2) DC. Means were compared using one-way analysis of variance or paired or unpaired t-tests, as appropriate. Simple and multivariable linear regression were used to model the effects of covariates on outcomes.
Results
Patients with FIGO stage IB to IVA cervical cancer were treated with intracavitary brachytherapy using tandem and ovoid (TO, n=33) or tandem and cylinder (TC, n=4) applicators. The mean CT HR-CTV volume (44.1 cm3) was larger than the mean MRI HR-CTV volume (35.1 cm3; paired t-test P<0.0001). In multivariable analysis, higher body mass index (BMI) and tumor size ≥5 cm with parametrial invasion on the MRI at diagnosis were associated with increased discrepancy in volume between the HR-CTV contours (P<0.02 for both). In addition, the spatial agreement (as measured by DC) between the HR-CTV contours decreased with increasing BMI (P=0.013).
Conclusions
We recommend MRI-based brachytherapy planning for patients with tumors >5 cm with parametrial invasion on MRI at diagnosis or those with a high BMI.
Introduction
The acquisition of 3-dimensional (3D) imaging, either in the form of magnetic resonance imaging (MRI) or computed tomography (CT), at the time of intracavitary brachytherapy for cervical cancer has become standard practice for many radiation oncologists around the world (1–5). Compared with traditional film-based planning, this approach allows for significantly improved visualization of both the target volumes and organs-at-risk, and MRI provides better resolution than CT for defining the extent of disease (6, 7). Over the past decade, the Group Européen de Curiethérapie-European Society for Therapeutic Radiology and Oncology (GEC-ESTRO) GYN working group has led a movement toward MRI-based treatment planning, providing detailed guidelines for defining target volumes and prescribing dose (8–10). Early clinical results suggest that these methods translate into lower rates of toxic effects and improved rates of disease control (11, 12).
Although MRI may now be considered the gold standard for 3D image-based treatment planning, obtaining an MRI at the time of brachytherapy can be logistically difficult, if not impossible, at many centers. Even at practices in which MRI is available, its use can be both costly and time-consuming. In contrast, CT is often readily available and less costly; as of 2014 an estimated 95% of American Brachytherapy Society members were consistently using CT for dose specification compared to 34% consistently using MRI (2).
The Radiation Therapy Oncology Group (RTOG) Gynecologic Cancer Working Group recently published a comparison of consensus CT- and MRI-based high-risk clinical target volume (HR-CTV) contours in three sample cases, and they found that mean tumor volume was larger on the CT-based HR-CTVs than on the MRI-based HR-CTVs (13). A prior study of 10 patients from Viswanathan et al. demonstrated that CT-based contours tended to overestimate tumor width, leading to significant differences in target coverage (14).
We hypothesized that some patients, defined on the basis of clinical and tumor factors, have similar HR-CTV contours regardless of whether they were defined on CT or MRI. These patients would be expected to have similar treatment plans and outcomes with CT-based treatment planning as with MRI-based treatment planning. Conversely, other patients may have dramatically different HR-CTV contours with CT than with MRI, and identifying these patients may help direct the allocation of limited MRI resources. The purpose of this study was therefore to compare CT- and MRI-based brachytherapy target volumes for patients enrolled in a prospective brachytherapy protocol, with the goal of identifying a subgroup of patients who may benefit most from MRI-based planning.
Methods and Materials
Patients
A total of 57 patients were enrolled in a prospective Institutional Review Board-approved brachytherapy protocol between December 2012 and December 2014. The target sample size of 57 patients was determined based on the primary endpoint of dosimetric comparisons between film-, CT-, and MRI-based treatment planning. These outcomes will be reported at a future date. In the current analysis, we report on pre-defined secondary contouring endpoints.
Patients with pathologically confirmed cervical carcinoma requiring definitive treatment with radiation or chemoradiation were eligible for the study. Among the 57 consented patients, 14 patients were ultimately not evaluable (Table E1). Among the remaining 43 evaluable patients, 37 had a diagnostic MRI either before or within 7 days of starting external beam radiation therapy (EBRT) and were included in the current analysis.
Demographic, clinical, and treatment characteristics were recorded prospectively. In addition to International Federation of Gynecology and Obstetrics (FIGO) stage and histologic findings, tumor-related characteristics (tumor size, parametrial invasion, and vaginal involvement) were recorded on physical examination at diagnosis and pretreatment pelvic MRI.
Pretreatment MRI
Although one of the criteria for inclusion in the current contouring analysis was a pretreatment diagnostic MRI, this MRI did not have to be obtained at our institution. Even so, most patients (34 of 37) had an MRI performed at our institution according to a standard imaging protocol, which includes sagittal, axial, and coronal T2-weighted fast relaxation fast spin echo (FRFSE) sequences, among others. All 37 MRIs were interpreted by radiologists at our institution.
Radiation treatment
Treatment consisted of definitive radiation or chemoradiation using a combination of EBRT and brachytherapy. Patients were first treated with pelvic EBRT to 40–45 Gy in 20–25 fractions using a four-field technique and 18-MV photons. Following treatment to the whole pelvis, each patient underwent two pulsed-dose rate intracavitary brachytherapy treatments separated by approximately 14 days. For patients with nodal disease at diagnosis, an EBRT boost was delivered in the interval between intracavitary treatments. Concurrent weekly cisplatin was administered when indicated and feasible.
Applicator specifications and placement
As dictated by the protocol, one of the two implants for each patient was performed using either an MRI-compatible tandem and ovoids (TO) or tandem and cylinders (TC) applicator. Indications for a TC applicator included disease extension into the vagina that would not be adequately covered by a TO applicator or patient inability to accommodate a TO applicator. Ovoids were available in multiple sizes, including mini, small, and medium. XXXX developed a novel applicator with MRI-compatible shields that can be moved during CT acquisition to reduce imaging artifacts (15, 16). This adaptive applicator was used in all patients for whom small or medium ovoids were deemed clinically appropriate. Patients underwent standard operating room placement of the applicator under general anesthesia. The applicator was stabilized using vaginal packing and labial sutures. Orthogonal films were obtained in the operating room to confirm placement.
Post-implant imaging and treatment
Following stabilization in the post-anesthesia care unit, each patient underwent non-contrast pelvic CT (“Brachytherapy (BT)-CT”) and MRI (“BT-MRI”) scans. CT images were acquired using the Philips AcQSim3 Discovery-64 CT scanner (Royal Philips Electronics, Amsterdam, Netherlands). Default scan parameters were 120 keV and 200 mA (adjusted on the basis of patient girth, while balancing radiation dose with image noise) with a slice thickness of 2.5 mm. Patients with shielded applicators had the shields shifted during imaging acquisition, a technique that has been described in detail elsewhere (15).
BT-MRI scans were acquired on a 1.5 T scanner with GE HDxt software (GE Healthcare, Little Chalfont, United Kingdom) using an 8-channel cardiac array coil. Our institutional MRI protocol for intracavitary brachytherapy includes sagittal, axial, and coronal T2-weighted FRFSE sequences and an axial 3D T2-weighted fast spin echo sequence with isotropic 1-mm voxels. The axial 3D T2-weighted sequence allows for retrospective generation of multi-planar images that can be reviewed in any desired plane.
Images from both the BT-CT and BT-MRI scans were imported into the brachytherapy planning system (Oncentra version 4.0; Nucletron, Veenendaal, Netherlands). The treating physician then used all available physical examination and imaging information to develop the plan with which the patient was treated. The formal contouring study, reported herein, was performed separately and had no bearing on the delivered treatment.
Target volume delineation
At our institution, we define the HR-CTV according to GEC-ESTRO principles (8, 9), with the exception of the cranial and caudal extent of the volume, which we modify to include the intrauterine and vaginal extent of disease at the time of diagnosis. For each patient, the HR-CTV contour was first drawn on the BT-CT (“CT HR-CTV”) using information from the physical examination at diagnosis and at the time of brachytherapy, as well as the MRI at diagnosis. The contouring investigator was blinded to the BT-MRI while contouring the CT HR-CTV. A separate HR-CTV contour was then drawn on the BT-MRI (“MRI HR-CTV”) using the same clinical and imaging information. As much as possible, we adhered to the techniques described in the consensus guidelines from the RTOG Gynecologic Cancer Working Group (13) when generating the HR-CTV contours, with exceptions for vaginal and intrauterine disease as described above.
HR-CTV contour comparison
The images and completed contours were exported as DICOM files from Oncentra to Velocity AI (version 3.0; Varian Medical Systems, Palo Alto, California). The BT-CT and BT~ MRI images were then co-registered strictly on the basis of the position of the applicator, in accordance with the assumption that the HR-CTV is fixed in relation to the applicator. Absolute volumes (in cubic centimeters) were obtained for each HR-CTV contour and the absolute discrepancy between the volumes was calculated by subtracting the MRI HR-CTV volume from the CT HR-CTV volume. The CT HR-CTV and MRI HR-CTV were then superimposed on one another, and the Dice coefficient of similarity (DC) was calculated using the formula , where A represents the CT HR-CTV contour, B represents the MRI HR-CTV contour, and ∩ represents the overlap of the two contours. DC has been used in previous contouring studies to quantify the extent of overlap of two volumes (13, 17, 18); DC=1 represents perfect overlap, while DC=0 represents no overlap.
CT image noise
Because CT image quality can influence HR-CTV contours, we wanted to quantify the CT image noise for each patient. We accomplished this by measuring the standard deviation of pixel values in a small region of interest in a homogeneous area of soft tissue for each case (19). In addition, because obesity is a known contributor to decreased image quality due to increased absorption of x-rays by the subcutaneous and visceral fat (20, 21), we used simple linear regression to explore the correlation between CT image noise and BMI.
Statistical analyses
Analyses were conducted using JMP Pro statistical software (version 11.4.0; SAS Institute, Inc., Cary, North Carolina). Means were compared using one-way analysis of variance and unpaired or paired t-tests, as appropriate. Simple linear regression was used to determine predictors of continuous outcomes by continuous independent variables. Multivariable linear regression was used to model the effects of covariates on continuous outcomes. We centered continuous variables (e.g. BMI) at their means. Variables found to have a P value <0.20 in univariate analyses were included in a saturated model. We then used backward elimination to remove variables from the model until all remaining variables were statistically significant. The significance threshold for inclusion in the final model was calculated using a Bonferroni correction of 0.05/k, where k was the number of candidate variables included in the saturated model (22). All P values were two-sided.
Results
Patient characteristics
A total of 37 patients were included in the analysis. The median age was 40 years (range, 25–94 years). Nearly half of the patients (n=16) had FIGO clinical stage IB2 disease (Table 1).
Table 1.
Patient demographic, clinical, and treatment characteristics (n = 37)
| Characteristic | No. of patients |
|---|---|
| Median age (range) | 40 years (25–94 years) |
| Race/ethnicity | |
| Asian | 1 |
| Hispanic | 10 |
| Non-Hispanic black | 2 |
| Non-Hispanic white | 24 |
| Median BMI (range) | 28.4 kg/m2 (17.5–56.9 kg/m2) |
| Histology | |
| Squamous cell carcinoma | 23 |
| Adenocarcinoma | 12 |
| Adenosquamous carcinoma | 2 |
| FIGO stage | |
| IB1 | 2 |
| IB2 | 16 |
| IIA | 4 |
| IIB | 5 |
| IIIA | 2 |
| IIIB | 7 |
| IVA | 1 |
| Median tumor size (in greatest dimension) on MRI at diagnosis (range) | 5.2 cm (1.0–11.0 cm) |
| Median EBRT dose (range) | 45 Gy (40–45 Gy) |
| Median number of cycles of weekly cisplatin (range) | 5 cycles (0–6 cycles) |
| Applicator type | |
| Tandem and cylinders | 4 |
| Tandem and ovoids | 33 |
Abbreviations: FIGO = International Federation of Gynecology and Obstetrics, BMI = body mass index, EBRT = external beam radiation therapy.
HR-CTV contour comparison
For the entire group, the mean CT HR-CTV volume (44.1 cm3) was significantly larger than the mean MRI HR-CTV volume (35.1 cm3; paired t-test P<0.0001). In univariate analyses, factors that were candidates for inclusion in the multivariable model for discrepancy in volume included BMI as a continuous variable (Table 2), tumor size ≥5 cm in greatest dimension on the MRI at diagnosis, and parametrial invasion on the MRI at diagnosis (Table 3). To avoid multicollinearity in the final model, tumor size ≥5 cm and parametrial invasion were combined into a 3-level variable: 1) both tumor size ≥5 cm and parametrial invasion, 2) either tumor size ≥5 cm or parametrial invasion, and 3) neither tumor size ≥5 cm nor parametrial invasion. The Bonferroni corrected P value for retention in the final model for discrepancy in volume was therefore 0.05/2=0.025, since we considered 2 candidate variables in the saturated model. In the final model, BMI and tumor size ≥5 cm with parametrial invasion on the MRI at diagnosis were significant predictors of increased discrepancy in volume between CT and MRI HR-CTV contours (P=0.015 and P=0.005, respectively, Table 4).
Table 2.
Simple linear regression of body mass index (kg/m2) versus (A) discrepancy in volume (cm3) and (B) Dice coefficient of similarity between computed tomography- and magnetic resonance imaging (MRI)-based high-risk clinical target volume contours in our cohort (n = 37)
| A. BMI versus Discrepancy in Volume | B. BMI versus Dice Coefficient of Similarity | |||||||
|---|---|---|---|---|---|---|---|---|
|
| ||||||||
| Characteristic | Estimated coefficient | Standard error | 95% confidence interval | P | Estimated coefficient | Standard error | 95% confidence interval | P |
| Intercept | 8.88 | 1.90 | 5.03 to 12.73 | <0.0001 | 0.75 | 0.01 | 0.73 to 0.78 | <0.0001 |
| BMI* | 0.39 | 0.25 | −0.11 to 0.90 | 0.13 | −0.004 | 0.002 | −0.007 to −0.0009 | 0.01 |
Abbreviations: BMI = body mass index.
BMI centered at 29.
Table 3.
Comparisons of computed tomography (CT)- and magnetic resonance imaging (MRI)-based high-risk clinical target volumes (HR-CTV) by clinical characteristics (n = 37)
| Characteristic | No. of patients | Mean discrepancy in volume between CT and MRI HR-CTV contours (SD), cm3 | P | Mean DC for CT and MRI HR-CTV (SD) | P |
|---|---|---|---|---|---|
| BMI (split at median) | |||||
| <28.4 kg/m2 | 18 | 4.9 (8.4) | 0.04 | 0.78 (0.06) | 0.04 |
| ≥28.4 kg/m2 | 19 | 12.9 (13.3) | 0.73 (0.08) | ||
| Histology | |||||
| 25 | 9.8 (11.3) | 0.60 | 0.76 (0.07) | 0.43 | |
| Squamous/adenosquamous | |||||
| Adenocarcinoma | 12 | 7.4 (13.1) | 0.74 (0.09) | ||
| Tumor size on MRI at diagnosis (in greatest dimension) | |||||
| <5 cm | 14 | 4.5 (4.8) | 0.03 | 0.73 (0.07) | 0.23 |
| ≥5 cm | 23 | 11.7 (13.9) | 0.76 (0.08) | ||
| Parametrial invasion on physical exam at diagnosis | |||||
| Yes | 15 | 11.6 (14.0) | 0.30 | 0.77 (0.09) | 0.17 |
| No | 22 | 7.2 (9.9) | 0.74 (0.07) | ||
| Vaginal involvement on physical exam at diagnosis | |||||
| Yes | 13 | 10.0 (14.0) | 0.73 | 0.77 (0.09) | 0.18 |
| No | 24 | 8.5 (10.6) | 0.74 (0.08) | ||
| Parametrial invasion on MRI at diagnosis | |||||
| Yes | 20 | 12.8 (13.9) | 0.03 | 0.76 (0.08) | 0.42 |
| No | 17 | 4.5 (6.6) | 0.74 (0.08) | ||
| Vaginal involvement on MRI at diagnosis | |||||
| Yes | 20 | 9.4 (11.8) | 0.82 | 0.77 (0.07) | 0.14 |
| No | 17 | 8.5 (12.0) | 0.73 (0.09) | ||
| Implant number | |||||
| First | 23 | 9.9 (12.9) | 0.53 | 0.75 (0.07) | 0.91 |
| Second | 14 | 7.5 (9.8) | 0.75 (0.09) | ||
| Three-level tumor characteristics variable* | |||||
| Neither tumor ≥5cm nor PM invasion | 8 | 4.0 (5.9) | 0.01 | 0.73 (0.07) | 0.43 |
| Either tumor ≥5cm or PM invasion | 15 | 5.1 (6.0) | 0.74 (0.08) | ||
| Both tumor ≥5cm and PM invasion | 14 | 16.0 (15.5) | 0.77 (0.08) |
Abbreviations: DC = Dice coefficient of similarity, SD = standard deviation, BMI = body mass index, PM = parametrial.
Means compared using one-way analysis of variance; all others compared using a two-sample t-test.
Table 4.
Multivariable linear regression model for the discrepancy in volume (cm3) between computed tomography- and magnetic resonance imaging (MRI)-based high-risk clinical target volume contours for patients in our cohort (n = 37)
| Characteristic | Estimated coefficient | Standard error | 95% confidence interval | P |
|---|---|---|---|---|
| Intercept | 10.44 | 1.83 | 6.70–14.17 | <0.0001* |
| BMI (per 1-unit increase)† | 0.56 | 0.22 | 0.12–1.00 | 0.015* |
| Tumor characteristics: | ||||
| Neither tumor ≥5cm nor PM invasion | Referent | . | . | . |
| Either tumor ≥5cm or PM invasion | 0.04 | 2.17 | −4.36−4.45 | 0.98 |
| Both tumor ≥5cm and PM invasion | 6.58 | 2.20 | 2.11–11.05 | 0.005* |
Abbreviations: BMI = body mass index, PM = parametrial.
BMI centered at 29 kg/m2.
Statistically significant at adjusted P < 0.025.
For patients who had both a tumor ≥5 cm in greatest dimension and parametrial invasion on the MRI at diagnosis (n=14), the mean CT HR-CTV was 73.2 cm3 and the mean MRI HR-CTV was 57.2 cm3 (mean difference of 16.0 cm3, paired t-test P=0.002). For patients who had only one of these two features (n=15), the mean CT HR-CTV was 29.4 cm3 and the mean MRI HR-CTV was 24.3 cm3 (mean difference of 5.1 cm3, paired t-test P=0.005). For patients who had neither of these features (n=8), the mean CT HR-CTV was 20.8 cm3 and the mean MRI HR-CTV was 16.8 cm3 (mean difference of 4.0 cm3, paired t-test P=0.09; Figure 1). Two patient examples are shown in Figures E1 and E2.
Figure 1.
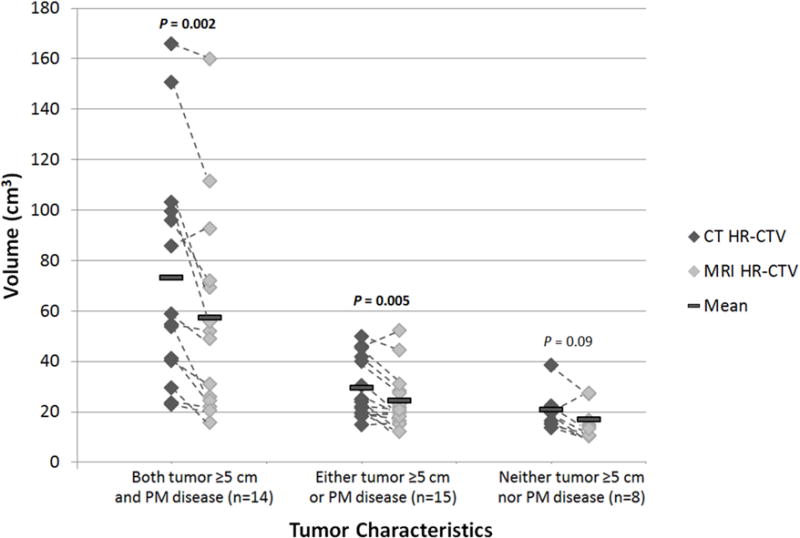
Graph demonstrating the increased discrepancy in volume between the computed tomography (CT)- and magnetic resonance imaging (MRI)-based high-risk clinical target volume (HR-CTV) contours in patients with tumors ≥5 cm in greatest dimension or parametrial (PM) disease. Dashed lines connect data points for the same patient. Means were compared using a two-sided paired t-test.
The median DC for all patients was 0.75 (range, 0.59–0.90). In univariate analyses, factors that were candidates for inclusion in the multivariable model for DC included BMI as a continuous variable (Table 2), parametrial invasion on exam at diagnosis, vaginal involvement on exam at diagnosis, and vaginal involvement on the MRI at diagnosis (Table 3). To avoid multicollinearity, only one vaginal disease variable (“vaginal involvement on MRI at diagnosis”) was entered into the multivariable model. The variable “vaginal involvement on exam at diagnosis” was tested in a separate model and did not change the results. The Bonferroni corrected P value for retention in the final model for DC was therefore 0.05/3=0.017, since we considered 3 candidate variables in the saturated model. Only BMI remained a significant predictor of DC in the final model (P=0.013, Table 5).
Table 5.
Linear regression model for the Dice coefficient of similarity for patients in our cohort (n = 37)
| Characteristic | Estimated coefficient | Standard error | 95% confidence interval | P |
|---|---|---|---|---|
| Intercept | 0.75 | 0.01 | 0.73 to 0.78 | <0.0001* |
| BMI (per 1-unit increase)† | −0.004 | 0.001 | −0.007 to −0.001 | 0.013* |
Abbreviations: BMI = body mass index.
BMI centered at 29 kg/m2.
Statistically significant at adjusted P < 0.017.
CT image noise
Simple linear regression revealed that both BMI and CT image noise were inversely correlated with DC, although the correlation was stronger between BMI and DC (R2=0.16) than between CT image noise and DC (R2=0.14; P<0.05 for both). BMI and CT image noise were highly correlated (R2=0.66, P<0.001, Figure 2), and therefore only BMI was included in the multivariable models to avoid multicollinearity.
Figure 2.
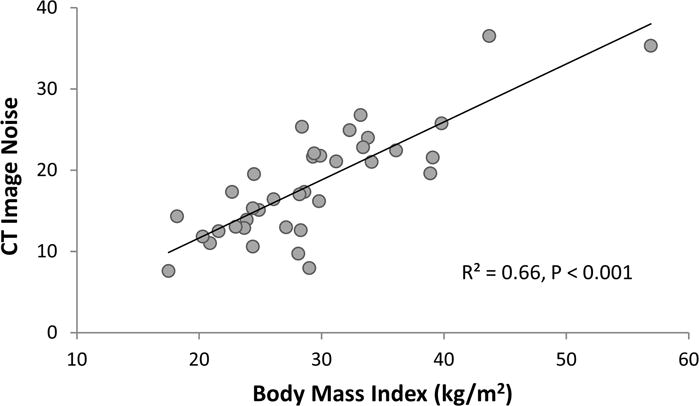
Relationship between body mass index (BMI) and computed tomography (CT) image noise in 37 patients.
Discussion
In this prospective study of 37 patients, we found that the discrepancy in volume between CT- and MRI-based HR-CTV contours increased with increasing BMI and was most pronounced in patients with large tumors (≥5 cm in greatest dimension) and parametrial invasion compared to patients with one or neither of these features. In addition, we found that spatial agreement between the CT HR-CTV and the MRI HR-CTV (as measured by DC) decreased with increasing BMI. Indeed, the effect of BMI on both of these endpoints can be at least partially explained by the decreased CT image quality in patients with a high BMI.
Our results corroborate existing evidence for the increased benefit of MRI in patients with more advanced tumors. In 2014, the RTOG Gynecologic Cancer Working Group published consensus contours for three distinct clinical cases: 1) a patient with stage IIB disease with near-complete response treated with a TO applicator, 2) a patient with stage IIB disease with partial response treated with a TO applicator with needles, and 3) a patient with stage IB2 disease with complete response treated with a tandem and ring applicator (13). DCs were calculated to compare CT- and MRI-based HR-CTV contours for each case, and DCs were found to be lower in the cases involving parametrial extension than in the case without parametrial extension. On the basis of these findings, the authors surmised that MRI may be most helpful in patients with large tumors or parametrial extension, a hypothesis that we were able to validate in the present study.
One potential explanation for why CT-defined contours may overestimate the target volume in patients with parametrial involvement at diagnosis is that persistent parametrial tumor, non-tumor parametrial inflammation, and parametrial scarring can all cause soft tissue stranding on a CT image (23). Indeed, the authors of the RTOG consensus contour study concluded that the poor agreement between the CT- and MRI-based HR-CTV contours for their case of rapidly-responding stage IIB disease reflected over-interpretation of paracervical findings on the CT (13).
We should note, however, that even though MRI has been shown to be superior to CT for identifying parametrial involvement at diagnosis (24, 25), it is not currently known whether the normalization of the parametria on the MRI at the time of brachytherapy represents clearance of microscopic disease, especially in the setting of a persistently abnormal appearance on CT. Even so, published data do not suggest increased rates of parametrial recurrence in patients treated with MRI-based brachytherapy. For example, the recently published Pittsburgh experience demonstrated excellent 2-year local control (91.6%) in 128 patients with cervical cancer treated with MRI-based high-dose rate brachytherapy (with all target volumes contoured according to GEC-ESTRO guidelines), and most of these patients had stage IIB disease (26). That work validated the results of a preceding study from Pötter et al. that showed 92% 3-year local control for MRI-based brachytherapy in patients with tumors >5 cm and 96% 3-year local control in patients with stage IIB disease (11).
To the best of our knowledge, our study is one of the first to evaluate CT and MRI-based target volume delineation in enough patients to identify subgroups that may benefit differentially from MRI-based planning. One strength of our study is that all contours were generated systematically by one investigator and then reviewed by at least one additional investigator with expertise in intracavitary brachytherapy. Additionally, the CT-based contours were generated with the investigators blinded to the BT-MRI in an effort to accurately replicate a clinical scenario in which only CT is available. The study was further strengthened by the availability of pretreatment diagnostic MRI scans for all patients, which allowed us to identify disease characteristics at diagnosis that predicted differences in HR-CTV volumes, and this in turn allows for early identification of patients who may require MRI at the time of brachytherapy.
Our study had several limitations. First, the results presented here compare only the HR-CTVs between the two imaging modalities, and not the final treatment plans based on these targets. This is in contrast to most of the literature comparing MRI- and CT-based treatment planning. We believe that this approach provides a valuable comparison because there are often multiple ways to optimize a given plan to meet all dosimetric goals, and therefore comparisons of dosimetric endpoints may be less revealing. Furthermore, because the shape and size of the HR-CTV drives dose optimization, comparing these volumes is informative in and of itself.
Second, the fact that not all patients received their pretreatment diagnostic MRI at our institution may have limited the reliability of our pretreatment imaging variables. However, the number of patients with scans from other facilities was small (n=3), and all scans were interpreted at our center. Finally, these data are from a single institution, and may not apply to other institutions that use different approach to target volume delineation.
Conclusions
In clinical settings where MRI-based brachytherapy planning is not feasible for all patients, the results of this study may be used to inform the allocation of imaging resources. On the basis of our findings, we recommend the use of MRI-based brachytherapy planning for patients with large tumors with parametrial invasion on the MRI at diagnosis or high BMI leading to poor CT image quality. Future technological advances will hopefully improve access to MRI-based brachytherapy for all patients.
Supplementary Material
Summary.
We compared CT- and MRI-based HR-CTV contours in 37 patients treated with brachytherapy for cervical cancer. We found that higher body mass index (BMI) and tumor size ≥5 cm with parametrial invasion were associated with increased discrepancy in absolute volume between the CT- and MRI HR-CTV contours. Our results suggest that patients with these clinical features may benefit most from MRI-based planning.
Footnotes
Publisher's Disclaimer: This is a PDF file of an unedited manuscript that has been accepted for publication. As a service to our customers we are providing this early version of the manuscript. The manuscript will undergo copyediting, typesetting, and review of the resulting proof before it is published in its final citable form. Please note that during the production process errors may be discovered which could affect the content, and all legal disclaimers that apply to the journal pertain.
Conflict of Interest Statement: A.J. and P.J.E are co-inventors of one of the MRI-compatible applicators used in this study and receive royalty from Nucletron.
References
- 1.Viswanathan AN, Erickson BA. Three-dimensional imaging in gynecologic brachytherapy: a survey of the American Brachytherapy Society. Int J Radiat Oncol Biol Phys. 2010;76(1):104–9. doi: 10.1016/j.ijrobp.2009.01.043. [DOI] [PubMed] [Google Scholar]
- 2.Grover S, Harkenrider MM, Cho LP, Erickson B, Small C, Small W, Jr, et al. Image Guided Cervical Brachytherapy: 2014 Survey of the American Brachytherapy Society. Int J Radiat Oncol Biol Phys. 2016;94(3):598–604. doi: 10.1016/j.ijrobp.2015.11.024. [DOI] [PubMed] [Google Scholar]
- 3.Guedea F, Venselaar J, Hoskin P, Hellebust TP, Peiffert D, Londres B, et al. Patterns of care for brachytherapy in Europe: updated results. Radiother Oncol. 2010;97(3):514–20. doi: 10.1016/j.radonc.2010.09.009. [DOI] [PubMed] [Google Scholar]
- 4.Tan LT. Implementation of image-guided brachytherapy for cervix cancer in the UK: progress update. Clin Oncol (R Coll Radiol) 2011;23(10):681–4. doi: 10.1016/j.clon.2011.07.011. [DOI] [PubMed] [Google Scholar]
- 5.Pavamani S, D’Souza DP, Portelance L, Craighead PS, Pearce AG, Traptow LL, et al. Image-guided brachytherapy for cervical cancer: a Canadian Brachytherapy Group survey. Brachytherapy. 2011;10(5):345–51. doi: 10.1016/j.brachy.2010.12.004. [DOI] [PubMed] [Google Scholar]
- 6.Brodman M, Friedman F, Jr, Dottino P, Janus C, Plaxe S, Cohen C. A comparative study of computerized tomography, magnetic resonance imaging, and clinical staging for the detection of early cervix cancer. Gynecol Oncol. 1990;36(3):409–12. doi: 10.1016/0090-8258(90)90153-c. [DOI] [PubMed] [Google Scholar]
- 7.Mayr NA, Tali ET, Yuh WT, Brown BP, Wen BC, Buller RE, et al. Cervical cancer: application of MR imaging in radiation therapy. Radiology. 1993;189(2):601–8. doi: 10.1148/radiology.189.2.8210395. [DOI] [PubMed] [Google Scholar]
- 8.Haie-Meder C, Potter R, Van Limbergen E, Briot E, De Brabandere M, Dimopoulos J, et al. Recommendations from Gynaecological (GYN) GEC-ESTRO Working Group (I): concepts and terms in 3D image based 3D treatment planning in cervix cancer brachytherapy with emphasis on MRI assessment of GTV and CTV. Radiother Oncol. 2005;74(3):235–45. doi: 10.1016/j.radonc.2004.12.015. [DOI] [PubMed] [Google Scholar]
- 9.Potter R, Haie-Meder C, Van Limbergen E, Barillot I, De Brabandere M, Dimopoulos J, et al. Recommendations from gynaecological (GYN) GEC ESTRO working group (II): concepts and terms in 3D image-based treatment planning in cervix cancer brachytherapy-3D dose volume parameters and aspects of 3D image-based anatomy, radiation physics, radiobiology. Radiother Oncol. 2006;78(1):67–77. doi: 10.1016/j.radonc.2005.11.014. [DOI] [PubMed] [Google Scholar]
- 10.Kirisits C, Potter R, Lang S, Dimopoulos J, Wachter-Gerstner N, Georg D. Dose and volume parameters for MRI-based treatment planning in intracavitary brachytherapy for cervical cancer. Int J Radiat Oncol Biol Phys. 2005;62(3):901–11. doi: 10.1016/j.ijrobp.2005.02.040. [DOI] [PubMed] [Google Scholar]
- 11.Pötter R, Georg P, Dimopoulos JCA, Grimm M, Berger D, Nesvacil N, et al. Clinical outcome of protocol based image (MRI) guided adaptive brachytherapy combined with 3D conformal radiotherapy with or without chemotherapy in patients with locally advanced cervical cancer. Radiotherapy and Oncology. 2011;100(1):116–23. doi: 10.1016/j.radonc.2011.07.012. [DOI] [PMC free article] [PubMed] [Google Scholar]
- 12.Lindegaard JC, Fokdal LU, Nielsen SK, Juul-Christensen J, Tanderup K. MRI-guided adaptive radiotherapy in locally advanced cervical cancer from a Nordic perspective. Acta Oncol. 2013;52(7):1510–9. doi: 10.3109/0284186X.2013.818253. [DOI] [PubMed] [Google Scholar]
- 13.Viswanathan AN, Erickson B, Gaffney DK, Beriwal S, Bhatia SK, Lee Burnett O, 3rd, et al. Comparison and consensus guidelines for delineation of clinical target volume for CT- and MR-based brachytherapy in locally advanced cervical cancer. Int J Radiat Oncol Biol Phys. 2014;90(2):320–8. doi: 10.1016/j.ijrobp.2014.06.005. [DOI] [PMC free article] [PubMed] [Google Scholar]
- 14.Viswanathan AN, Dimopoulos J, Kirisits C, Berger D, Potter R. Computed tomography versus magnetic resonance imaging-based contouring in cervical cancer brachytherapy: results of a prospective trial and preliminary guidelines for standardized contours. Int J Radiat Oncol Biol Phys. 2007;68(2):491–8. doi: 10.1016/j.ijrobp.2006.12.021. [DOI] [PubMed] [Google Scholar]
- 15.XXXX
- 16.XXXX
- 17.Gunther JR, Liauw SL, Choi S, Mohamed AS, Thaker NG, Fuller CD, et al. A Prostate Fossa Contouring Instructional Module: Implementation and Evaluation. J Am Coll Radiol. 2016 doi: 10.1016/j.jacr.2016.02.030. [DOI] [PMC free article] [PubMed] [Google Scholar]
- 18.Huang W, Currey A, Chen X, Li B, Bergom C, Kelly T, et al. A Comparison of Lumpectomy Cavity Delineations Between Use of Magnetic Resonance Imaging and Computed Tomography Acquired With Patient in Prone Position for Radiation Therapy Planning of Breast Cancer. Int J Radiat Oncol Biol Phys. 2016;94(4):832–40. doi: 10.1016/j.ijrobp.2015.12.014. [DOI] [PubMed] [Google Scholar]
- 19.Sprawls P, AAPM tutorial CT image detail and noise. Radiographics. 1992;12(5):1041–6. doi: 10.1148/radiographics.12.5.1529128. [DOI] [PubMed] [Google Scholar]
- 20.Schindera ST, Nelson RC, Lee ER, Delong DM, Ngyen G, Toncheva G, et al. Abdominal multislice CT for obese patients: effect on image quality and radiation dose in a phantom study. Acad Radiol. 2007;14(4):486–94. doi: 10.1016/j.acra.2007.01.030. [DOI] [PubMed] [Google Scholar]
- 21.Uppot RN, Sahani DV, Hahn PF, Kalra MK, Saini SS, Mueller PR. Effect of obesity on image quality: fifteen-year longitudinal study for evaluation of dictated radiology reports. Radiology. 2006;240(2):435–9. doi: 10.1148/radiol.2402051110. [DOI] [PubMed] [Google Scholar]
- 22.Mundfrom DJ, Perrett JJ, Schaffer J, Piccone A, Roozeboom M. Bonferroni adjustments in tests for regression coefficients. Multiple Linear Regression Viewpoints. 2006;32:1–6. [Google Scholar]
- 23.Vick CW, Walsh JW, Wheelock JB, Brewer WH. CT of the normal and abnormal parametria in cervical cancer. AJR Am J Roentgenol. 1984;143(3):597–603. doi: 10.2214/ajr.143.3.597. [DOI] [PubMed] [Google Scholar]
- 24.Subak LL, Hricak H, Powell CB, Azizi L, Stern JL. Cervical carcinoma: computed tomography and magnetic resonance imaging for preoperative staging. Obstet Gynecol. 1995;86(1):43–50. doi: 10.1016/0029-7844(95)00109-5. [DOI] [PubMed] [Google Scholar]
- 25.Kim SH, Choi BI, Han JK, Kim HD, Lee HP, Kang SB, et al. Preoperative staging of uterine cervical carcinoma: comparison of CT and MRI in 99 patients. J Comput Assist Tomogr. 1993;17(4):633–40. doi: 10.1097/00004728-199307000-00022. [DOI] [PubMed] [Google Scholar]
- 26.Gill BS, Kim H, Houser CJ, Kelley JL, Sukumvanich P, Edwards RP, et al. MRI-guided high-dose-rate intracavitary brachytherapy for treatment of cervical cancer: the University of Pittsburgh experience. Int J Radiat Oncol Biol Phys. 2015;91(3):540–7. doi: 10.1016/j.ijrobp.2014.10.053. [DOI] [PubMed] [Google Scholar]
Associated Data
This section collects any data citations, data availability statements, or supplementary materials included in this article.