

Summary
Poly(ADP-ribose) polymerase inhibitors (PARPi) are selectively active in cells with homologous recombination (HR) deficiency (HRD) caused by mutations in BRCA1, BRCA2, and other pathway members. We sought small molecules that induce HRD in HR competent cells in order to induce synthetic lethality with PARPi and extend the utility of PARPi. We demonstrated that inhibition of bromodomain containing 4 (BRD4) induced HRD and sensitized cells across multiple tumor lineages to PARPi regardless of BRCA1/2, TP53, RAS, or BRAF mutation status through depletion of the DNA double stand break resection protein CtIP [C-terminal binding protein (CtBP) interacting protein]. Importantly, BRD4 inhibitor (BRD4i) treatment reversed multiple mechanisms of resistance to PARPi. Furthermore, PARPi and BRD4i are synergistic in multiple in vivo models.
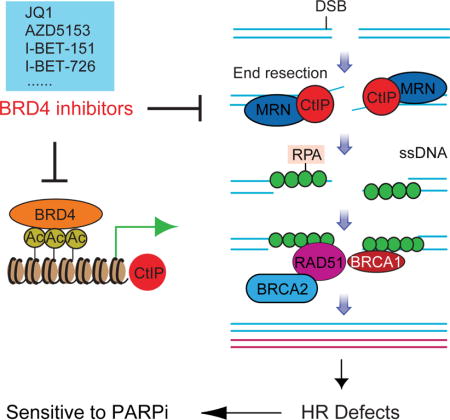
Graphical abstract
Sun et al. show that inhibition of BRD4 induces homologous recombination deficiency, through depletion of CtBP, in cells across multiple tumor types and sensitizes them to PARP inhibition. Thus, inhibition of BRD4 reverses resistance to PARP inhibitors and expands the potential use of PARP inhibitors.
Introduction
DNA double-strand breaks (DSBs) can lead to mutation, chromosomal aberration, or cell death. DSBs are repaired by two main mechanisms: non-homologous end joining (NHEJ) and homologous recombination (HR) (Hoeijmakers, 2001; Jackson and Bartek, 2009). Mutation prone NHEJ ligates broken DNA ends without requiring sequence complementarity. In contrast, HR mediates high fidelity DNA repair using sister chromatids as the repair template. The different DSB repair pathways are tightly controlled (Huertas, 2010). HR is instigated by DSB end resection, which generates a long 3′ single-stranded DNA (ssDNA) that is protected by replication protein A (RPA) (Broderick et al., 2016; Kaidi et al., 2010). C-terminal binding protein (CtBP) interacting protein (CtIP) physically interacts with the MRE11-RAD50-NBS1 (MRN) complex at DSBs, promoting DNA end resection, ssDNA generation, and nuclease activity of the MRN complex (Davies et al., 2015; Yun and Hiom, 2009). CtIP downregulation abolishes ssDNA formation, and impairs HR function (Sartori et al., 2007; Yun and Hiom, 2009).
BRD4, a member of the bromodomain and extraterminal (BET) protein family, maintains and facilitates oncogenic transcription directly by recruiting transcriptional machinery or indirectly by binding to enhancers, contributing to cancer cell proliferation and survival (Loven et al., 2013; Yang et al., 2005). BRD4 can be selectively targeted with small-molecule inhibitors, such as JQ1 (Filippakopoulos et al., 2010), GSK1210151A (I-BET151 (Dawson et al., 2011)), GSK525762A (I-BET-762 (Nicodeme et al., 2010)), GSK1324726A (I-BET-726 (Gosmini et al., 2014)), and AZD5153 (Rhyasen et al., 2016). BRD4i are active in preclinical models of hematological malignancies and solid tumors (Asangani et al., 2014; Delmore et al., 2011; Filippakopoulos et al., 2010; Yokoyama et al., 2016). Multiple BRD4i have entered clinical trials (NCT01587703, NCT03059147, NCT02419417, NCT01949883, NCT03068351 and NCT02259114).
BRD4 is frequently amplified and correlates with poor prognosis in patients with high-grade serous ovarian carcinoma (HGSOC) (Zhang et al., 2016). In addition, at least half of HGSOC exhibit aberrations in the HR pathway (Cancer Genome Atlas Research, 2011). Tumor cells that lack functional BRCA1, BRCA2 or other key components of the HR pathway are highly sensitivity to PARPi (Bryant et al., 2005; Ledermann et al., 2016), leading to regulatory approval of three different PARPi for ovarian cancer treatment (Kaufman et al., 2015; Mirza et al., 2016; Swisher et al., 2017). Although high response rates are achieved, most tumors rapidly become resistant, including BRCA1/2 mutation cancers. Therefore, the development of strategies to prevent or reverse PARPi resistance to increase the duration of response and expand the utility of PARPi to HR competent tumors is critical.
Results
BRD4 inhibition induces a HRD signature
We applied our HR defect (HRD) gene signature (Peng et al., 2014) to publicly available transcriptional profiling data with or without BRD4 inhibition to determine whether BRD4 inhibition impaired HR. BRD4i (JQ1) and BRD4 shRNA significantly elevated HRD scores in human THP-1 cells and in murine MLL-AF9/NrasG12D acute myeloid leukaemia (AML) cells (Zuber et al., 2011) (Figure 1A). Moreover, different BRD4i (JQ1, AZD5153) or BRD4 shRNA increased HRD score in human or murine tumors (Figures 1A, 1B, and S1A–S1F). Strikingly, using a U2OS DR-GFP HR reporter assay, BRD4 inhibition with JQ1, AZD5153 or siRNA attenuated HR repair (Figure 1C). Therefore, BRD4 inhibition markedly decreases HR competence.
Figure 1. Effect of BRD4 inhibition on HR.
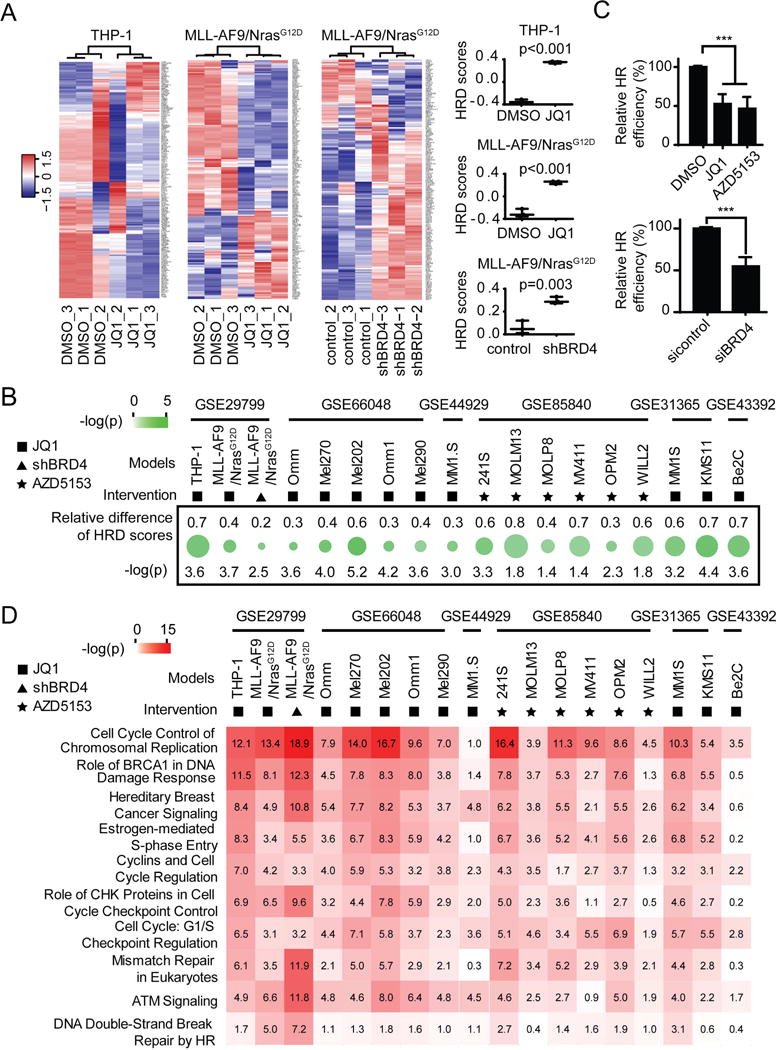
(A) Heat map (left) and HRD scores (right) from unsupervised clustering of HRD gene signatures using GSE29799 dataset. Higher scores represent defective HR. Statistical significances were determined using Student’s t test.
(B) Relative HRD score represents change (treated minus control) in HRD scores in indicated GEO datasets after BRD4 inhibition. The top symbol indicates method of BRD4 inhibition used. Green circle size indicates change in HRD scores, while color indicates −log (p) by Student’s t test.
(C) U2OS DR-GFP cells were treated with 100 nM JQ1 or 100 nM AZD5153 for 24 hr (upper), or transfected with control or BRD4 siRNA for 24 hr (lower) and then transfected with I-Sce1 endonuclease for 48 hours. HR efficiency of treated cells was compared to DMSO or control siRNA respectively based on percentage of GFP+ cells detected by flow cytometry. Data represent mean±SEM of three independent experiments. Student’s t test: *** p<0.001.
(D) Results of Ingenuity Pathway Analysis (IPA) of pathways significantly altered by BRD4 inhibition in the indicated GEO datasets. Symbol of intervention is as in B. Numbers in the box correspond to −log(p) calculated by Benjamini-Hochberg (B-H) method.
See also Figure S1.
Ingenuity Pathway Analysis (IPA) revealed that BRD4 inhibition altered expression of genes involved in DNA replication, BRCA1 in DNA damage response, hereditary breast cancer signaling, DNA damage checkpoint, cell cycle, and DNA repair pathway (Figure 1D). These data further support BRD4 as a regulator of HR.
BRD4 inhibition decreases CtIP expression
To identify mechanisms underlying the effect of BRD4 inhibition on HR, we used reverse phase protein arrays (RPPA) to assess signaling pathway perturbations in response to a clinical candidate (GSK525762A) and three experimental (GSK1210151A, GSK1324726A, and JQ1) BRD4i in five cancer cell lines. Replicates for each treatment condition [two-dimensional (2D), spheroid 3D, and two time points (24 and 48 hr)] were averaged for each line (Figure 2A). BRD4i markedly and consistently decreased CtIP, part of the MRN complex that commits cells to DSB repair. BRD4i extensively rewired protein networks, including multiple components of the DNA damage response pathway (WEE1, WEE1-pS642, RAD51, RAD50, CHK1, CHK1-pS345, CHK2, and MRE11) and induced DNA damage (γH2AX-pS139). In addition, BRD4i dysregulated the apoptosis pathway (BIM, FOXO3a, and MCL1). However, in contrast to CtIP, which was consistently downregulated under all conditions, the effects of BRD4i on RAD50, RAD51 and MRE11 were modest and variable (Figure S2A). We thus focused on CtIP as a likely mediator of BRD4i effects.
Figure 2. Effect of BRD4 inhibition on CtIP expression.
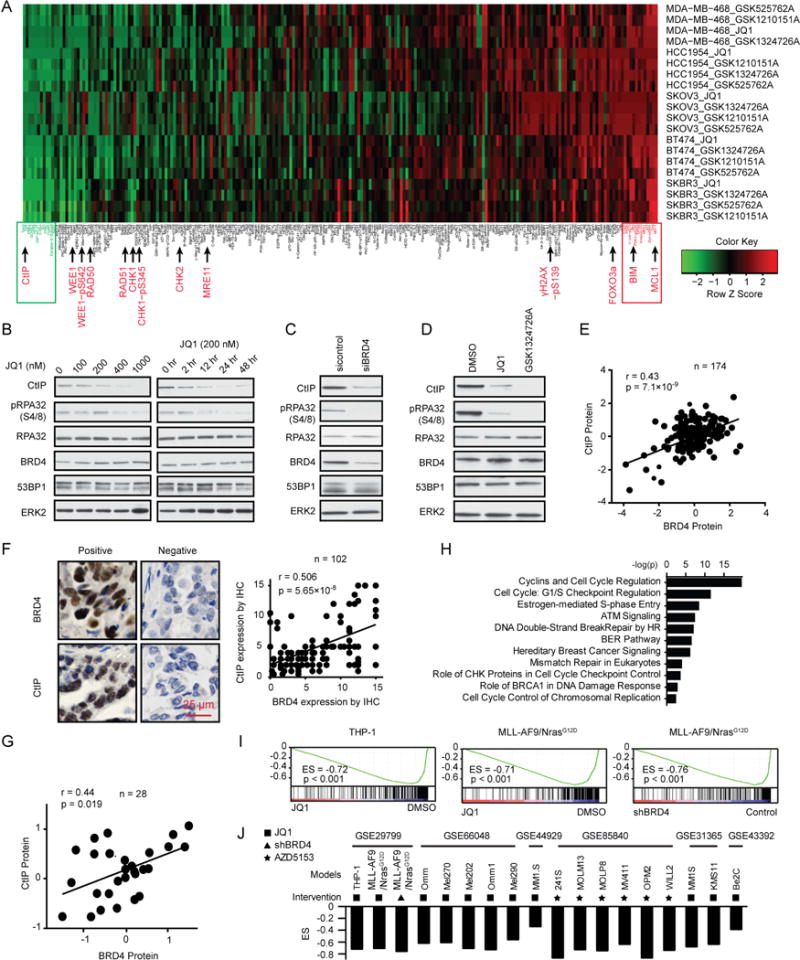
(A) Heat map of RPPA data representing “rank-ordered” changes induced by BRD4i treatment (see STAR methods). Proteins with consistent decreases (green) are on the left and increases (red) are on the right of the heat map. Statistically significant changes (z scores) indicated in boxes.
(B) Western blot of indicated proteins in HOC1 cells treated with indicated dose of JQ1 for 48 hr (left) or treated with 200 nM JQ1 for the indicated length (right).
(C) Western blot of indicated proteins in HOC1 cells after BRD4 silencing for 48 hr.
(D) Western blot of indicated proteins in HOC1 cells treated with 200 nM JQ1 or 200 nM GSK1324726A for 48 hr.
(E) Correlation between BRD4 and CtIP protein expression in MCLP database.
(F) Representative image of IHC with BRD4 or CtIP antibody (left) and correlation between BRD4 and CtIP expression by IHC (right) in ovarian cancer tissues. Scale bar, 25 μm.
(G) Correlation between BRD4 and CtIP protein expression in NCI60 dataset.
(H) IPA with genes in CtIP coexpression signature.
(I) GSEA plot of the CtIP coexpression signature in GSE29799 after BRD4 inhibition (see STAR methods).
(J) GSEA plot of Enrichment Score (ES) of CtIP coexpression signature in indicated GEO datasets after BRD4 inhibition. Symbol of intervention is as in Figure 1B.
See also Figure S2.
CtIP is required for MRE11 to mediate DNA end resection, with loss of CtIP markedly decreasing DNA DSB repair through HR (Sartori et al., 2007; Yun and Hiom, 2009). Notably, JQ1 decreased CtIP and phosphorylated RPA32 (pRPA32 (S4/8)) protein in a dose and time dependent manner (Figures 2B, S2B, and S2C). In contrast, JQ1 did not markedly alter expression of other MRN complex proteins (Figure S2B). BRD4 inhibition has recently been reported to downregulate RAD51 and BRCA1 (Yang et al., 2017). Thus, we assessed the effect of BRD4i on CtIP, RAD51 and BRCA1 protein levels. JQ1 modestly decreased RAD51 levels in HeyA8 and HOC7, and BRCA1 in MCAS, while it consistently decreased CtIP protein in all lines assessed (Figure S2D). This is in general agreement with the RPPA data (Figures 2A and S2A) with the RPPA data appearing more sensitive than Western blotting to subtle changes. To exclude potential off-target effects of JQ1, we used siRNA to knockdown BRD4. As expected, BRD4 siRNA also decreased CtIP and pRPA32 (S4/8) (Figures 2C and S2E). Similar results were also obtained with GSK1324726A (Figure 2D) and AZD5153 (Figure S2F). Moreover, BRD4i-induced CtIP decreases are not due to cell cycle arrest (Figure S2G). Correlation analysis of 174 cancer cell lines (MCLP), showed that BRD4 is positively correlated with CtIP expression (Figure 2E). The positive correlation was verified in 102 ovarian cancer patient samples with IHC (Figure 2F). Consistent with these results, there was a significant, positive correlation between BRD4 protein and RBBP8 mRNA (encode CtIP protein) in NCI60 (Figure 2G) and TCGA pan-cancer data (r=0.274, p=2.87×10−119). Using the Cancer Cell Line Encyclopedia (CCLE), we derived a CtIP coexpression signature (see STAR methods) that demonstrated high concordance with the BRD4 signature in terms of involved pathways (Figure 2H) and was regulated by BRD4 inhibition (Figures 2I, 2J). Therefore, BRD4 appears to be a key regulator of CtIP protein level and function.
BRD4 binds CtIP promoter and enhancers, regulating CtIP transcription
Transcription profiling demonstrated that RBBP8 is decreased by BRD4 inhibition (Figures 1A and S1). In support of this observation, RBBP8 along with cMYC, a key target of BRD4, were decreased by BRD4 inhibition (Figure 3A). Thus, BRD4 inhibition likely alter CtIP levels through transcriptional effects. BRD4 regulates gene transcription by binding to enhancers and promoters of target genes (Loven et al., 2013; Yang et al., 2005). The ENCODE database and ChIP-seq in GSE63581 (Shu et al., 2016) revealed BRD4 enrichment at the CtIP promoter and enhancer, with BRD4 enrichment decreased by BRD4i (Figure 3B). Consistent with genome-wide studies, ChIP-qPCR of BRD4, H3K27Ac, H3K4Me1 and Pol-II antibodies with primers located at CtIP promoter (P1 and P2) and enhancer (E1-E8) in HOC1 demonstrated BRD4 association with the CtIP promoter and enhancer, which was decreased with JQ1 treatment (Figure 3C). Notably, JQ1 treatment also reduced H3K27Ac, H3K4Me1 at the CtIP promoter and enhancer. Further JQ1-mediated suppression of CtIP correlated with decreased association of RNA Pol-II with the CtIP promoter and enhancer, with Pol-II recently being reported to regulate gene transcription by binding to both promoters and enhancers (De Santa et al., 2010; Kim et al., 2010). Together, these data support the contention that CtIP is a direct target of BRD4, which is subject to JQ1-mediated repression at the transcriptional level.
Figure 3. BRD4 binding to CtIP promoter and enhancer and effect on CtIP transcription.
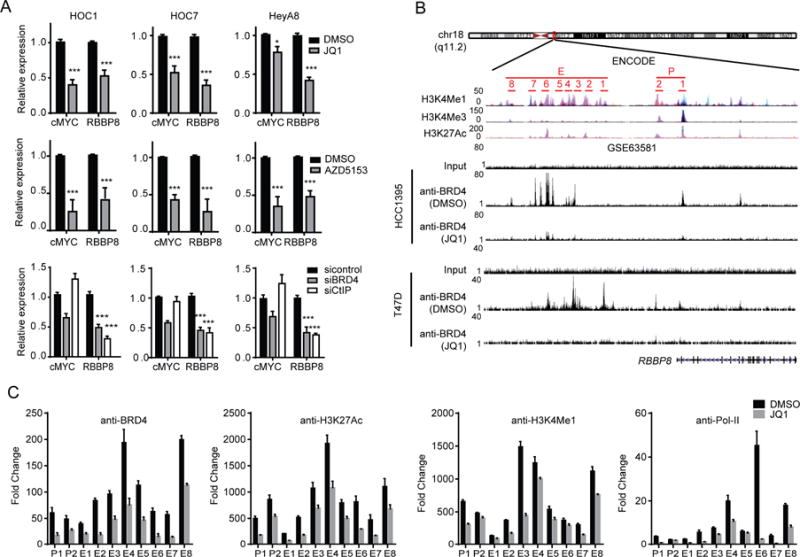
(A) qRT-PCR analysis of cMYC and RBBP8 in cells treated with 200 nM JQ1 (upper), or 200 nM AZD5153 (middle) for 24 hr, or after silencing of BRD4 or CtIP by siRNA for 48 hr (lower).
(B) Schematic diagram of BRD4 binding regions in CtIP promoter and enhancer in ENCODE. Primers for ChIP-qPCR validation are indicated (upper). ChIP-seq of anti-BRD4 at the RBBP8 locus in HCC1395 or T47D cells treated with JQ1 in GSE63581 dataset (lower).
(C) HOC1 treated with vehicle or 200 nM JQ1 for 24 hr and subjected to ChIP with normal rabbit IgG, BRD4, H3K27Ac, H3K4Me1 or Pol-II antibody as indicated. ChIP samples were analyzed by qPCR using primers indicated in B.
Data across panels represent mean±SEM of three independent experiments. Student’s t test: * p<0.05, *** p<0.001.
Down regulation of CtIP is sufficient to impair DNA end resection, generation of ssDNA, and HR function
CtIP is essential for efficient DNA end processing during DSB repair, with cells depleted for CtIP showing a defect in generation of ssDNA and subsequent formation of RPA foci (Polato et al., 2014; Yun and Hiom, 2009). We thus hypothesized that BRD4 inhibition would block DNA end resection and HR through downregulation of CtIP. Indeed, BRD4 protein and RBBP8 are negatively correlated with HRD score in both NCI60 and CCLE (Figures S3A, S3B). To determine if BRD4 inhibition blocks ssDNA generation, we labeled cells with 5-bromodeoxyuridine (BrdU) and then employed immunofluorescence microscopy using an BrdU antibody under non-denaturing conditions to detect stretches of ssDNA. JQ1 significantly reduced formation of ssDNA 4 hr after 10 Gy IR. (Figures 4A and S3C), consistent with impaired resection. JQ1 also severely impaired RPA focus formation in response to PARPi (Figure 4B) or IR (Figure S3D). Consistent with CtIP being sufficient to explain the effects of BRD4 inhibition, both BRD4 and CtIP knockdown markedly impaired PARPi induced RPA focus formation (Figure 4B). pRPA32 (S4/8) represents a surrogate marker for ssDNA that is generated by DNA end resection (Yun and Hiom, 2009). BRD4 inhibition decreased CtIP expression and strongly impaired PARPi-induced pRPA32 (S4/8) (Figures 4C, 4D, S3E, and S3F). Subcellular fractionation showed that BRD4i blocked recruitment of key DNA damage proteins to damaged chromosomes, including RAD51, RPA32, RPA70 and MRE11 (Figures 4E and S3G). Taken together, these results indicate that BRD4 inhibition attenuates efficient DSB resection, thereby impairing the subsequent formation of ssDNA.
Figure 4. Effect of down regulation of CtIP on DNA end resection, generation of ssDNA, and HR function.
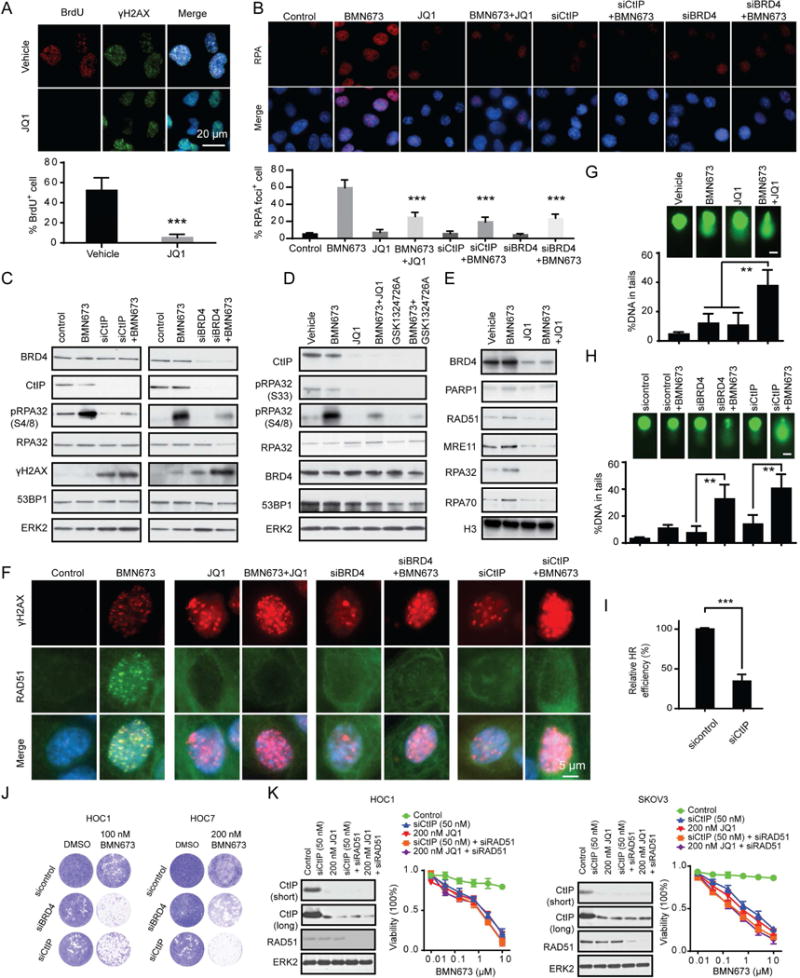
(A) Representative images of BrdU and γH2AX staining under non-denaturing conditions at 4 hr after 10 Gy IR in HOC1 cells cultured with or without 200 nM JQ1 (see STAR methods). BrdU positive cells were quantified below. Scale bar, 20 m.
(B) Representative images of RPA foci in HOC1 cells after 24 hr BRD4 inhibition (200 nM JQ1 or siRNA) or CtIP downregulation (siRNA) and then treated with BMN673 (200 nM) for 48 hr. RPA foci positive cells were quantified below. Scale bar, 20 μm.
(C) Western blotting of indicated proteins in HOC1 cells 24 hr after transfection with control, CtIP or BRD4 siRNA and then treated with 200 nM BMN673 for 48 hr.
(D) Western blotting of indicated proteins in HOC1 cells treated with BMN673 (200 nM), JQ1 (200 nM), GSK1324726A (200 nM) or the indicated combination for 48 hr.
(E) Western blot of indicated proteins in chromatin-bound fractions from HOC1 cell treated with BMN673 (200 nM), JQ1 (200 nM), or combination for 48 hr. Histone H3 was used as marker for chromatin-bound fraction.
(F) Representative images of RAD51 and γH2AX foci in HOC1 cells after 24 hr BRD4 inhibition (200 nM JQ1 or siRNA) or CtIP downregulation (siRNA) and then treated with BMN673 (200 nM) for 48 hr. Scale bar, 5 μm.
(G) Comet assay in HOC1 cells treated with BMN673 (200 nM), JQ1 (200 nM), or combination for 48 hr. DNA damage quantified via % DNA in tails. Each data point represents at least 50 cells counted. Scale bar, 10 μm.
(H) Comet assay in HOC1 cells 24 hr after transfection with control, CtIP, or BRD4 siRNA and then treated with 200 nM BMN673 for 48 hr. Each data point represents at least 50 cells counted. Scale bar, 10 μm.
(I) 24 hours after transfection with control or CtIP siRNA, U2OS DR-GFP cells were transfected with the I-Sce1 endonuclease for 48 hours. HR efficiency of CtIP siRNA treated cells was compared to control siRNA based on percentage of GFP+ cells detected by flow cytometry.
(J) 24 hr after transfection with control, BRD4, or CtIP siRNA, clonogenic assay was performed with indicated dose of BMN673 for 7 days. Representative pictures are shown.
(K) Cells were transfected with CtIP siRNA (50 nM) or treated with 200 nM JQ1 with or without 50 nM RAD51 siRNA for 24 hr. Western blots of indicated proteins are in left panel. Cells were then treated for 96 hr with indicated doses of BMN673 and viability assessed (right). Short: short time exposure, long: long time exposure.
Data across panels represents mean±SEM of three independent experiments, Student’s t test: **p<0.01, ***p<0.001. See also Figure S3.
RAD51 loading onto DNA requires ssDNA created by the CtIP/MRN complex. Compared to vehicle, JQ1 and AZD5153 retained RAD51 in the cytosol and decreased RAD51 nuclear foci after PARPi (Figures 4F, S3H, and S3I) or IR (Figure S3J). Consistent with CtIP contributing to the effects of BRD4 inhibition, both siCtIP and siBRD4 inhibited PARPi-induced RAD51 foci formation (Figures 4F and S3H).
We used a comet assay to directly examine whether BRD4i would increase PARPi-induced DNA damage. Whereas JQ1 or BMN673 monotherapy modestly induced DNA damage, the combination increased accumulation of damaged DNA (Figure 4G). Once again, knockdown of BRD4 or CtIP was sufficient to recapitulate the effects of BRD4i (Figure 4H).
DNA resection is the key commitment step for DSB repair by HR (Ira et al., 2004). These results suggested that BRD4 inhibition leading to loss of CtIP would decrease HR competency. Indeed, similar to BRD4i (Figure 1C), both CtIP (Figure 4I) and BRD4 (Figure 1C) downregulation significantly decreased HR efficiency.
PARPi were developed to capitalize on synthetic lethality with HRD (Bryant et al., 2005; Farmer et al., 2005). Since BRD4 inhibition induced HRD, at least in part, through loss of CtIP, we reasoned that knockdown of BRD4 or CtIP would sensitize cells to PARPi. Indeed, knockdown of BRD4 or CtIP markedly sensitized cells to PARPi (Figure 4J). Importantly, at optimal doses, downregulation of CtIP with siRNA or BRD4i are indistinguishable in their effects on sensitization to PARPi. Further, RAD51 levels are not substantively altered by either CtIP downregulation or BRD4i and concurrent knockdown of RAD51 does not alter the response curve to PARPi (Figure 4K). When lower doses of CtIP siRNA and JQ1 are used that suboptimally decrease CtIP levels, concurrent RAD51 knockdown induces a similar dose response shift for both CtIP siRNA and JQ1 (Figure S3K). Thus, while CtIP downregulation is sufficient to mimic effects of BRD4i, when CtIP is partially downregulated, RAD51 knockdown does alter PARPi sensitivity.
CtIP, but not RAD51 or BRCA1, partially rescues BRD4 inhibition induced defects in DNA end resection and HR
To evaluate whether suppression of CtIP is necessary for BRD4 inhibition induced defects in DNA end resection and HR function, we generated Dox-inducible stable cell lines expressing WT CtIP or inactive CtIP (T847A). CDK-mediated phosphorylation of CtIP on T847 is required for optimal CtIP function, thus conversion of threonine 847 to alanine (T847A) creates an inactive CtIP that is compromised for CtIP catalytic, ssDNA- and RPA-binding activities (Huertas and Jackson, 2009; Polato et al., 2014). Ectopic expression of WT, but not inactive, CtIP increased ssDNA formation 4 hr after 10 Gy IR in the presence of JQ1 (Figure 5A). Furthermore, expression of WT, but not inactive, CtIP partially restored PARPi-induced RPA and RAD51 foci formation (Figure 5B) and pRPA32 (S4/8) (Figure 5C) in the presence of JQ1.
Figure 5. Effect of CtIP expression on BRD4 inhibition induced DNA end resection and HR defects.
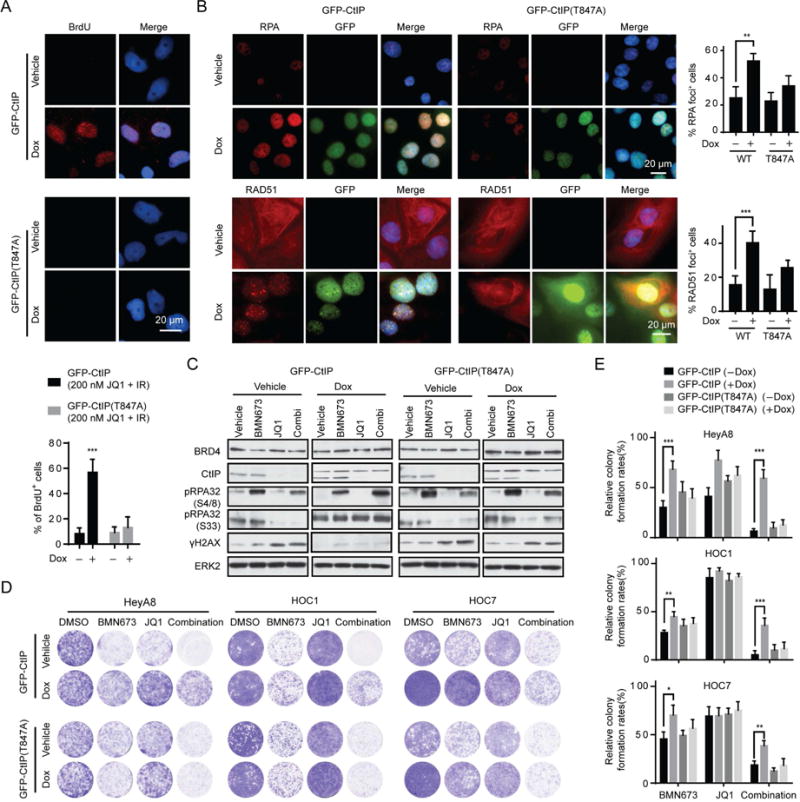
(A) Representative images (upper) and quantification (lower) of native BrdU foci staining in Dox inducible GFP-CtIP or GFP-CtIP (T847A) HOC1 cells at 4 hr after 10 Gy IR plus 200 nM JQ1 treatment with or without Dox induction. Scale bar, 20 μm.
(B) Representative images (left) and quantification of positive cells (right) of RPA (upper) and RAD51 foci (lower) in Dox inducible GFP-CtIP or GFP-CtIP (T847A) HOC1 cells treated with combination of 200 nM BMN673 and 200 nM JQ1 for 48 hr with or without Dox induction. Scale bar, 20 μm.
(C) Western blotting of indicated proteins in Dox inducible GFP-CtIP and GFP-CtIP (T847A) HOC1 cells treated with BMN673 (200 nM), JQ1 (200 nM), or combination for 48 hr with or without Dox induction.
(D) Representative pictures of clonogenic assay in Dox inducible GFP-CtIP and GFP-CtIP (T847A) cells treated with BMN673 (200 nM), JQ1 (200 nM), or combination for 10 days with or without Dox induction.
(E) Relative colony formation rates of cell in D are presented as percent relative to DMSO. Data across studies represent mean±SEM of three independent experiments, Student’s t-test: *p<0.05, **p<0.01, ***p<0.001. See also Figure S4.
Ectopic expression of WT CtIP reduced DNA damage (γH2AX) caused by BRD4i and combination of BRD4i and PARPi (Figures 5C and S4A). Consistent with CtIP decrease being required for the effects of BRD4 inhibition, ectopic expression of WT, but not inactive, CtIP reversed, at least in part, the synergistic effects of PARPi and BRD4i (Figures 5D, 5E). Collectively, our data indicate that the catalytic, ssDNA- and RPA-binding activities of CtIP partially rescue impaired DNA end resection, RPA and RAD51 loading and sensitization to PARPi induced by BRD4 inhibition.
Ectopic expression of BRCA1 or RAD51 did not rescue cells from the effects of combination treatment (Figure S4B). Furthermore, knockdown of CtIP sensitized cells to PARPi even when BRCA1 and RAD51 were overexpressed (Figure S4C). In addition, induced CtIP expression rescued effects of combination treatment, while ectopic expression of BRCA1 and RAD51 alone had no effect (Figure S4D). Thus decreases in CtIP, but not RAD51 and BRCA1, appear to be necessary and sufficient for synergistic effects of BRD4i and PARPi in the model systems assessed.
PARPi and BRD4i demonstrate synergy in multiple cancer lineages
Based on the ability of BRD4 inhibition to compromise HR, we assessed the effects of combination treatment with PARPi and BRD4i. Of 55 cancer cell lines tested, 40 lines demonstrated synergy as assessed by the CalcuSyn model (Chou, 1991) (CI<0.5, Figure 6A). The majority of the lines (9/15) that failed to demonstrate synergy were highly sensitive to BMN673 (OAW42, A2780CP, A2780, UWB1.289, and OC316, ARK1, HCC1187, BT20, MDA-MB-436) (Figure 6A). Further, combinations at low concentrations induced significant decreases in clonogenicity (Figure S5A) compared to treatment with either inhibitor alone.
Figure 6. Effect of PARPi and BRD4i on survival of different cell lineages.
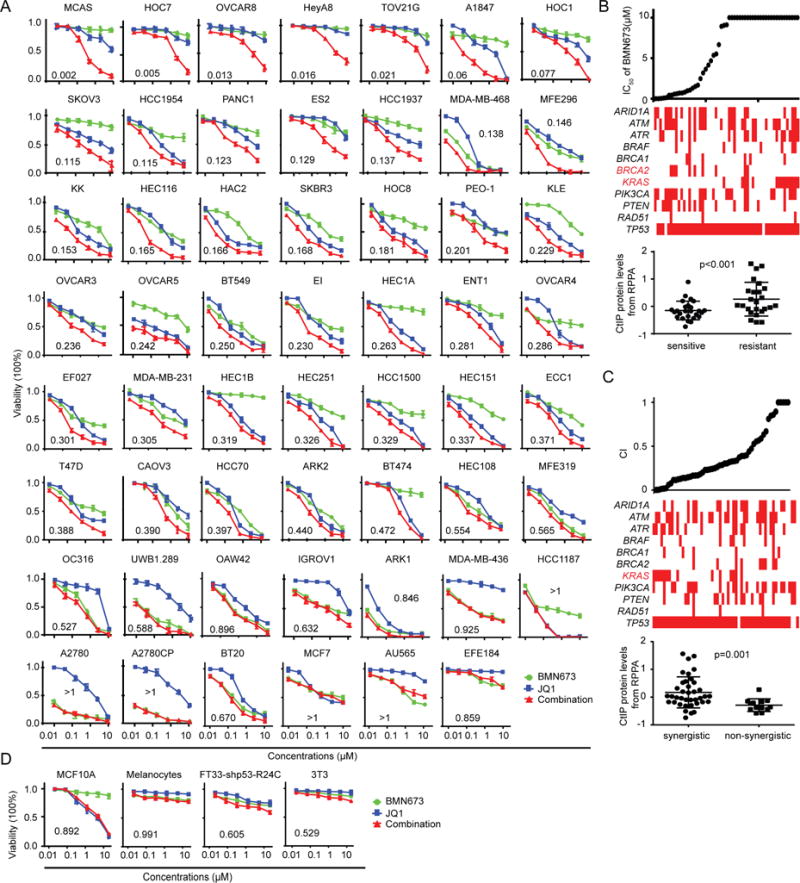
(A) Dose response curves of BMN673 or JQ1 alone or combined in 55 cancer cell lines treated with varying concentrations of the JQ1 and BMN673 for 96 hr. Combination index (CI) was calculated using CalcuSyn software with the Chou-Talalay equation.
(B) BMN673 IC50 of (top) and selected mutations (middle) in cell lines. Red indicates a mutation in the respective gene, white indicates no mutation; red text indicates significant differences in frequency of mutations between PARPi sensitive and resistant cells (Pearson’s chi square test: p<0.05). The plot (bottom) shows the CtIP protein level in PARPi sensitive and resistant cells (Student’s t-test. p<0.001).
(C) CI values of (top) and selected mutations (middle) in cell lines. Red indicates a mutation within the respective gene, white indicates no mutation; red text indicates significant differences in frequency of mutation between cells with or without synergism between BRD4i and PARPi (Pearson’s chi square test: p<0.05). The plot (bottom) shows the CtIP protein level in cells with or without synergism between BRD4i and PARPi (Student’s t-test. p=0.001).
(D) Dose response curves for BMN673 or JQ1 alone or combined for 96 hr in four normal human or murine proliferating cell lines.
Data across panels represent mean±SEM of three independent experiments. See also Figures S5, and S6.
As we have previously demonstrated (Sun et al., 2017), KRAS mutation is a potent inducer of PARPi resistance (Figure 6B). Strikingly, synergism of PARPi and BRD4i was most clearly manifest in KRAS mutant cells (Figure 6C). This may, in part, be due to resistance of KRAS mutant cell lines to PARPi alone making synergistic activity more readily manifest. The synergistic activity of the combination was independent of ARID1A, ATM, ATR, BRCA1/2 PIK3CA, PTEN, and TP53 status, consistent with generalizability and independence from intrinsic HRD status. The striking synergistic effects of PARPi and BRD4i in KRAS mutant cells led us to test additional RAS/BRAF mutant cells across multiple lineages. Strikingly, the combination was synergistic in 12 NRAS or BRAF mutant melanoma cells, as well as 11 of 12 KRAS mutant pancreatic, lung or colon cancer cells (except Pa09c cells) (Figure S5B). The combination was also synergistic in the parental WU-BC3 patient-derived xenografts (PDX) and in a P53 knockdown (P53 KD) clone (Ma et al., 2012), which was resistant to PARPi (Figure S5C). In contrast, the combination was not synergistic in non-tumorigenic MCF10A (breast epithelial cells), melanocytes, FT33-shp53-R24C (Immortalized Human Fallopian Tube Secretory Epithelial Cells), and 3T3 (mouse embryonic fibroblasts) (Figures 6D and S5D).
In addition to JQ1, three other BRD4i demonstrated similar patterns of synergy with PARPi (Figure S5E). Combined with synergy observed between BRD4 or CtIP knockdown with PARPi (Figure 4J), these results suggested the synergistic effects of BRD4i and PARPi were indeed due to specific BRD4 inhibition. To verify this hypothesis, we knocked down BRD2, BRD3, and BRD4 individually with siRNA. Only BRD4 depletion decreased CtIP protein and transcript levels (Figures S5F, S5G). Furthermore, only BRD4 depletion sensitized cells to PARPi (Figure S5H).
In 55 cell lines tested for response, CtIP expression was much lower in PARPi sensitive cells, indicating that CtIP may serve as a marker of PARPi sensitivity (Figure 6B). Moreover, higher CtIP protein and mRNA, but not RAD51 or BRCA1 mRNA, was a marker of synergism of PARPi and BRD4i (Figures 6C and S6A), consistent with the concept that CtIP depletion contributes to PARPi and BRD4i synergy.
Six of the lines tested were resistant to PARPi alone as well as to combination. Strikingly, BRD4i failed to alter CtIP levels in the three resistant cell lines tested. In contrast, RAD51 was decreased in IGROV1, and BRCA1 decreased in EFE184 (Figures S6B, S6C). Moreover, combination did not increase DNA damage (γH2AX), consistent with the lack of synergism in EFE184 (Figure S6D). ChIP-qPCR data showed that although BRD4, H3K27Ac, H3K4Me1, and Pol-II bind to the promoter and enhancer of CtIP in EFE184 cells, BRD4i did not decrease binding activity (Figure S6E). Together, this data further supports the concept that downregulation of CtIP contributes to synergistic activity of PARPi and BRD4i.
We further sought mechanisms by which KRAS mutant cell lines would be selectively sensitive to PARPi and BRD4i combinations. Induction of activated KRASG12D in HPDE cells induced both BRD4 and CtIP (Figure S6F), which was reversed by a selective MEKi in vivo (Figure S6G). Consistent with this result, MEKi decreased both BRD4 and CtIP in multiple cancer cell lines with RAS/MAPK pathway activation or mutant KRAS (Figure S6H). Together, increases in BRD4 and CtIP protein in response to RAS/MAPK pathway activation likely contribute to sensitivity of KRAS mutant cells to PARPi and BRD4i combinations.
BRD4i resensitizes acquired PARPi resistance
Although many patients benefit from PARPi, acquired PARPi resistance is an almost universal occurrence. To explore whether BRD4i could resensitize PARPi-resistant cells to PARPi, we used several PARPi resistant models representing different mechanisms of PARPi resistance. First, we developed PARPi-resistant cells by culturing sensitive cells (A2780CP, OAW42 and OC316) in continued presence of BMN673. We have previously demonstrated that A2780CP_R has acquired mutations in KRAS, as well as in MAP2K1 (Sun et al., 2017). JQ1 resensitized A2780CP_R, OAW42_R and OC316_R to PARPi (Figures 7A, 7B). Second, UWB1.289 is a BRCA1-mutant line (BRCA12594delC). UWB1.289-BRCA1, which stably expresses WT BRCA1, is resistant to PARPi and mimics BRCA1/2, RAD51C or RAD51D reversion mutations. BRD4i and PARPi combinations were synergistic in UWB1.289-BRCA1, albeit with lower efficacy than PARPi in parental cells (Figure 7C). Third, loss of 53BP1 normalizes HR defects, rescues the lethality of BRCA1 deficiency and leads to PARPi resistance in BRCA1-null cells and animal models (Bunting et al., 2010). CtIP-dependent DNA end resection rescues genomic stability and HR function of BRCA1/53BP1-deficient cells (Bunting et al., 2010; Polato et al., 2014; Xu et al., 2015). Since BRD4i decreased CtIP expression, we proposed that BRD4i would resensitize BRCA1/53BP1 double deficient cells to PARPi. 53BP1 knockdown rendered BRCA1 knockdown MCF10A cells as well as BRCA1 mutant UWB1.289 and COV362 cells resistant to PARPi. In all cases, JQ1 reversed resistance mediated by 53BP1 knockdown (Figures 7D–7H). Fourth, decreased PARP1 levels have been identified as a mechanism of PARPi resistance particularly to the effects of “PARP trapping” inhibitors in model systems (Byers et al., 2012; Murai et al., 2012). Synergistic effects of PARPi and BRD4i were also observed in cells with knockdown of PARP1 (Figures 7I, 7J, S7A, and S7B).
Figure 7. Effect of BRD4i on acquired PARPi resistance.
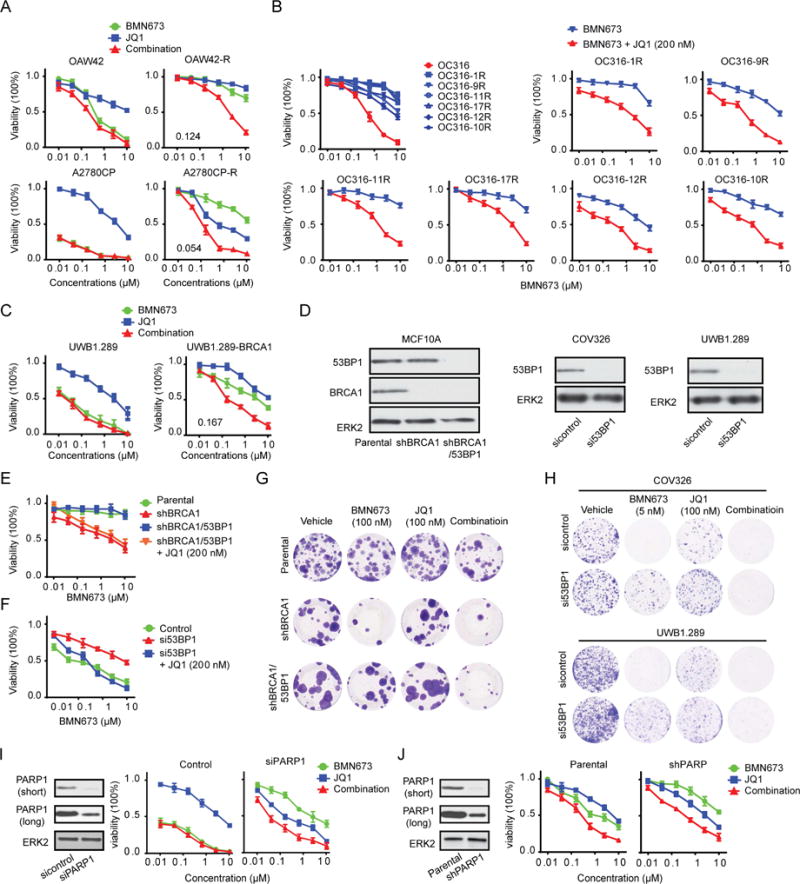
(A) Dose response curves of parental or PARPi-resistant OAW42 and A2780CP cells treated with BMN673 or JQ1 alone and combined for 96 hr.
(B) Dose response curves of parental or six individual monoclonal populations of PARPi-resistant OC316 treated with BMN673 (upper left) for 96 hr. Remaining graphs show dose response curves of six individual monoclonal populations of PARPi-resistant OC316 treated with various concentrations of BMN673 alone (blue) or combined with 200 nM JQ1 (red) for 96 hr.
(C) Dose response curves of UWB1.289 and UWB1.289-BRCA1 treated with BMN673 or JQ1 alone or combined for 96 hr.
(D) Western blot of BRCA1/53BP1 knockdown efficiency in MCF10A stable lines or of 53BP1 knockdown efficiency in UWB1.289 and COV326 cell lines by siRNA for 48 hr.
(E) Dose response curves of BMN673 in parental, shBRCA1, or shBRCA1/53BP1 stable MCF10A cells with or without 200 nM JQ1 for 96 hr.
(F) Dose response curves of BMN673 in COV326 cells transfected with control or 53BP1 siRNA with or without 200 nM JQ1 for 96 hr.
(G) Representative images of clonogenic assay in parental, shBRCA1, or shBRCA1/53BP1 stable MCF10A cells in presence of the indicated inhibitor for 10 days.
(H) 24 hr after transfection with control or 53BP1 siRNA in UWB1.289 or COV326 cells, clonogenic assays were performed with indicated dose of BMN673 for 10 days. Representative pictures are shown.
(I) Western blot of PARP1 in A2780CP cells after PARP1 silencing by siRNA for 48 hr (left). Dose response curves in control or PARP1 knockdown cells treated with BMN673 or JQ1 alone or combined for 96 hr (right).
(J) Western blot of PARP1 in parental or shPARP1 stable MDA-MB-231 cells (left). Dose response curves in parental or shPARP1 stable MDA-MB-231 cells treated with BMN673 or JQ1 alone or combined for 96 hr (right). Short: short time exposure, long: long time exposure. Data represent mean±SEM of three independent experiments. See also Figure S7.
Taken together, BRD4i resensitizes multiple mechanisms of acquired PARPi resistance that have been observed in patients and model systems to PARPi. Thus, BRD4i and PARPi combinations may prevent emergence of PARPi resistance, or may be effective in the emerging population of patients where PARPi are initially active and then fail.
Inhibition of PARP enzyme activity appears sufficient for synergy with BRD4i
The different PARPi currently available in the clinic effectively inhibit the enzyme activity of PARP, but vary in their ability to trap PARP on DNA. BMN673 is most active, Olaparib, Niraparib and Rucaparib intermediate in activity, whereas ABT888/Veliparib has the weakest PARPi trapping activity (Murai et al., 2012). High levels of PARP1 are required for trapping activity of PARPi to be manifest and thus a role for trapping activity can be elucidated by testing activity of different PARPi, as well as by determining the effects of partial knockdown of PARP1 (Murai et al., 2012). Indeed, as noted above, the synergistic effects of PARPi and BRD4i are not altered by partial knockdown of PARP1 (Note residual PARP1 remains) (Figures 7I, 7J, S7A, and S7B). Furthermore, synergistic effects are maintained in combinations with PARPi of lower PARP trapping potential (Olaparib) and with minimal PARP trapping activity (ABT888) with similar combination indices indicative of synergy (Figure S7C). In addition, 5 μM ABT888 (lower concentration than required for PARP trapping (50 μM) (Murai et al., 2012)) synergized with JQ1, similar to Olaparib and BMN673 (Figure S7D). Finally, subcellular fractionation did not demonstrate increased PARP1 trapping on DNA with combination treatment (Figure 4E and S3G). Together, inhibition of PARP enzyme activity appears sufficient for the synergistic effects of BRD4i and PARPi consistent with marked HRD induced by BRD4 inhibition. PARP1−/− DT40 cells completely lack PARP enzyme activity because avian cells lack PARP2. PARP1−/− DT40 are resistant to BMN673 consistent with the lack of PARP1/2. Cytotoxic effects of combinational treatment with BMN673 and JQ1 are indistinguishable from the effects of JQ1 alone in PARP1−/− DT40 cells. Importantly, the dose response curve of BMN673 and JQ1 combinations in WT DT40 is equivalent to that of JQ1 in PARP1−/− DT40 (Figure S7E). This is consistent with activity of combination being dependent on the presence of PARP and further argues that the effects of PARPi in combination with BRD4i are on-target.
BRD4i and PARPi are synergistic in vivo
On the basis of synergy of BRD4i and PARPi in vitro, we explored BRD4i and PARPi combinations in five different in vivo models. OVCAR8 is a KRASP121H mutant (the mutant is a variant of unknown significance, but the line has an activated RAS/MAPK pathway (Sun et al., 2017)) ovarian cancer line, OVCAR3 is a TP53 mutant, RAS WT ovarian cancer line, WU-BC3 is a breast cancer PDX (HER2-E subtype with WT TP53) (Ma et al., 2012), PATX53 is a KRASG12D and TP53 mutant pancreatic PDX and LPA1-T127 is a MMTV-LPA receptor transgene–induced transplantable tumor that acquired a spontaneous KRASQ61H mutation (Federico et al., 2017). Similar to human PDX, the LPA1-T127 tumor has never been cultured on plastic and may thus be more representative of the heterogeneity of human breast cancers. Furthermore, LPA receptor transgene–induced tumors are late onset, heterogeneous, and are associated with an inflammatory response similar to human cancers (Liu et al., 2009). Strikingly, in OVCAR8, WU-BC3 and LPA1-127, the JQ1 and PARPi combination induced prolonged tumor control (Figures 8A, 8B and S8A) with tumor regression in the OVCAR8 xenograft. The combination of JQ1 and BMN673 was well tolerated, with modest weight loss late in treatment that was not different from JQ1 alone (Figures S8A–S8C). To demonstrate generalizability and since JQ1 is not a clinical candidate, we assessed the clinically approved PARPi (Olaparib) and a selective, orally available, and bivalent BRD4i (AZD5153) (Rhyasen et al., 2016), which is entering clinical evaluation. In OVCAR3 ovarian cancer cells as well as in KRAS mutant PATX53, and LPA1-T127, all of which are HR competent and resistant to PARPi alone, the combination markedly inhibited tumor growth to a much greater degree than either compound alone (Figures 8C–8E). Indeed, in the OVCAR3 model, AZD5153 resulted in 83% tumor growth inhibitions (TGI), Olaparib showed minimal effect at 35% TGI and the combination treatment resulted in near stasis with 98% TGI. Moreover, only the combination treatment induced tumor regression (8/10 mice) (Figure 8C). The Olaparib and AZD5153 combination was tolerated for the study duration (Figures S8D, S8E). To further evaluate safety of the combination, we performed toxicity analysis of Olaparib with AZD5153 in the T127 model. The numbers of white blood cells in the AZD5153 and combination therapy group showed a slight decrease but remained in the normal range, when compared to the vehicle group. No changes in red blood cells, platelets or hemoglobin were detected. Serum chemistry panels did not reveal changes in albumin, ALT, AST, and BUN levels (Figure S8F).
Figure 8. Efficacy of BRD4i and PARPi in vivo.
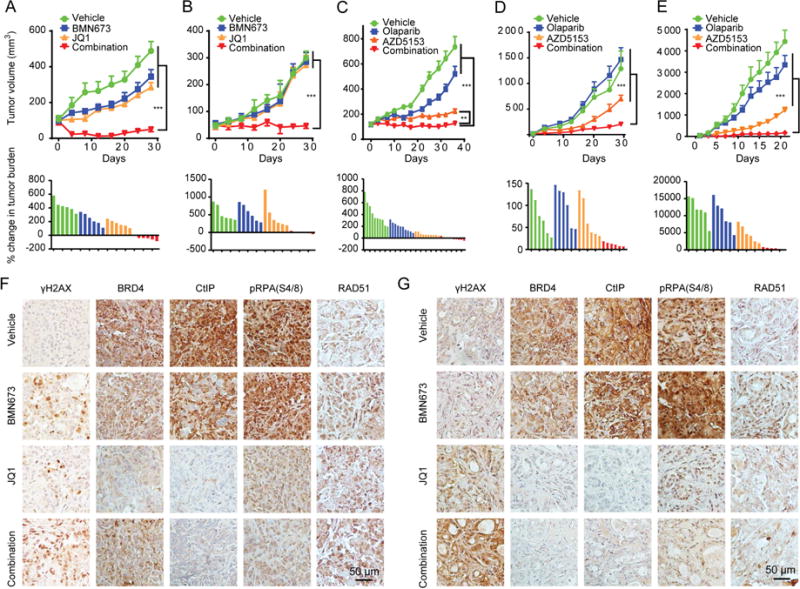
(A, B) Tumor volume curves (upper) or waterfall plot of tumor burden changes (lower) of OVCAR8 xenografts (A) and WU-BC3 PDX (B) mice treated with vehicle (0.5% hydroxypropylmethylcellulose and 0.2% Tween 80), BMN673 (0.333 mg/kg, oral gavage, per day), JQ1 (40 mg/kg, I.P., per day), or combination of BMN673 and JQ1.
(C–E) Tumor volume curves (upper) or waterfall plot of tumor burden changes (lower) of OVCAR3 (C) or PATX53 (D) xenografts or LPA1-T127 allograft (E) mice treated with vehicle (0.5% hydroxypropylmethylcellulose and 0.2% Tween 80), Olaparib (100 mg/kg, oral gavage, per day), AZD5153 (2.5 mg/kg, oral gavage, per day), or combination of Olaparib and AZD5153.
(F, G) Representative images of IHC with indicated antibodies in tumor tissues from OVCAR8 xenografts (F) or WU-BC3 PDX (G). Scale bar, 50 μm.
Data represent mean±SEM. Analysis of variance (ANOVA) was used to compare differences among multiple groups. **p<0.01. ***p<0.001. See also Figure S8.
IHC of OVCAR8 and WU-BC3 PDX tumors at study termination recapitulated the in vitro studies. JQ1 increased γH2AX, which was further increased by combination with BMN673. As expected, CtIP and its direct downstream effector pRPA32 (S4/8) were decreased in JQ1-treated tumors, which was not reversed by addition of BMN673 (Figures 8F, 8G).
Discussion
We demonstrated that decreased CtIP transcription appears to be a major contributor to the effects of BRD4 inhibition on HR function and to be necessary and sufficient for much of the synergy between PARPi and BRD4i. CtIP inhibition has previously been associated with PARPi sensitivity (Lin et al., 2014; Wang et al., 2016). Importantly, enforced expression of CtIP was sufficient to, at least in part, reverse the effects of BRD4i on DNA end resection, HR function and PARPi sensitivity. DNA replication fork reversal and fork stability are emerging mechanisms of PARPi resistance independent of HR repair (Ray Chaudhuri et al., 2016). CtIP has also been demonstrated to induce replication fork recovery in a FANCD2-dependent manner (Yeo et al., 2014). The effects of CtIP on DNA repair as well as replication stress induced by tumorigenesis may contribute to DNA damage observed in cells treated with BRD4i herein. Thus, BRD4 inhibition induced CtIP loss may contribute to PARPi sensitivity through multiple CtIP dependent mechanisms. However, as BRD4 regulates the expression of many molecules, there may be additional effects of BRD4i that contribute to sensitization to PARPi either independent of CtIP loss or in cooperation with CtIP loss.
Indeed, recent studies have demonstrated that concomitant BRD4 and PARP inhibition are synergistic in model systems (Yang et al., 2017). The synergism was attributed to decreases in RAD51 and BRCA1 that were assessed at the RNA level. Importantly, in our hands enforced expression of CtIP but not RAD51 or BRCA1 rescued cells from synergistic activity of the BRD4i and PARPi combination. Indeed, high CtIP levels are a biomarker of decreased response to PARPi monotherapy as well as a biomarker of increased response to the combination providing a potential approach to selection of patients for therapy with BRD4i and PARPi combinations. For reasons that will require future exploration, cell lines that are resistant to effects of combinations fail to demonstrate decreases in CtIP, but, at least in some cases, maintain loss of RAD51 or BRCA1. Taken together CtIP appears to be a key component of the process by which BRDi induce synergy with PARPi.
Marked synergistic activity of PARPi and BRD4i combinations were observed in multiple cancer lineages consistent with generalizability and independence from intrinsic HRD status. The independence from intrinsic HRD status is consistent with the marked compromise in HR induced by BRD4 inhibition. Thus, the combination of BRD4i and PARPi could expand the spectrum of patients likely to benefit from PARPi beyond those having tumors with intrinsic HR defects. The effects of the combination were most marked in RAS or BRAF mutant cells. This may be due, in part, to the resistance of these cells to PARPi as a result of increased HR competence (Sun et al., 2017). This is particularly important as patients with RAS mutant tumors have limited therapeutic options.
Synergistic activity was observed with three structurally distinct PARPi of differential PARP trapping potential but with similar enzyme inhibition activity (Murai et al., 2012). Indeed, concentrations of ABT888 below levels required to mediate trapping (Murai et al., 2012) demonstrated synergy with BRD4i. Synergy was also observed where PARP1 was knocked down. Together, this suggests that inhibition of PARP enzyme activity is sufficient for synergism with BRD4i. It does not, however, rule out a role for PARP trapping in the activity of the combination. In contrast, BMN673 was without activity in PARP1−/− DT40 consistent with the effects of BMN673 in combination with BRD4i being “on-target”. Similarly, four different BRDi demonstrated synergy with PARPi, again consistent with on-target effects of BRD4i. Consistent with BRD4i specifically targeting BRD4, synergy with PARPi was noted with either BRD4 or CtIP knockdown but not with knockdown of BRD2 or BRD3.
PARPi elicit significant responses in BRCA1 or BRCA2 mutation carriers with breast, ovarian, prostate and pancreatic tumors (Kaufman et al., 2015). However, many patients who initially respond to PARPi eventually develop drug resistance (Ledermann et al., 2016). There is now a growing population of patients with a range of cancers currently receiving PARPi who are likely to become resistant to PARPi in the future and require therapeutic alternatives. Multiple potential resistance mechanisms to PARPi have been revealed in patients as well as in model systems: 1) the most well-validated mechanisms of PARPi resistance in patients are secondary BRCA1, RAD51C or RAD51D mutations that restore HR competence (Kondrashova et al., 2017; Norquist et al., 2011); 2) loss of 53BP1 expression causes resistance to the effects of PARPi in BRCA1-mutant cells (Bunting et al., 2010; Jaspers et al., 2013; Xu et al., 2015); 3) decreases in PARP1 render cancer cells resistant to maximal effects of PARPi in model systems (Byers et al., 2012; Murai et al., 2012); 4) preexisting or acquired KRAS mutations or elevated RAS/MAPK activity mediates PARPi resistance in model systems (Sun et al., 2017). Although effects of decreased PARP1 levels and KRAS mutations or elevated RAS/MAPK activity have not yet been observed in the clinic, they have been observed in multiple model systems (Byers et al., 2012; Federico et al., 2017; Murai et al., 2012; Sun et al., 2017). Notably, BRD4i reversed PARPi resistance in models designed to recapitulate each of these resistance mechanisms. Whether BRD4i will reverse mechanisms of PARPi resistance that do not reconstitute HR competency remains to be assessed. Nevertheless, the PARPi and BRD4i combination may reverse established PARPi resistance and more importantly prevent acquisition of drug resistance.
Together, these data argue that the rational combination of BRD4i and PARPi has the potential to increase the magnitude, duration, and spectrum of PARPi activity in patients with a range of different cancers. Clinical trials will be needed to determine whether the combination will benefit these patients. The marked activity in RAS mutant tumors including pancreatic tumor PDX where there are limited therapeutic options is particularly noteworthy. Our in vivo studies support the tolerability of this combination, but careful dosing and sequencing of both BRD4i and PARPi in early phase clinical trials will be important given the potential for overlapping drug-related toxicities, including myelosuppression. However, our animal studies particularly with Olaparib and AZD5153 did not show significant toxicity based on weight loss, hematologic or chemistry criteria. The potential for tolerability in patients is further supported by the lack of synergism of the combination in a series of normal cell lines potentially due to different levels of replication stress and ongoing DNA damage between normal and malignant cells. Three PARPi are now approved for ovarian cancer therapy and have demonstrated antitumor activity in breast and prostate cancers, while multiple BRD4i are currently in clinical trials. Assessing the combination of PARPi and BRD4i in the clinic should therefore be prioritized in order to optimize the use of these compounds and to maximize patient benefit.
STAR METHODS
CONTACT FOR REAGENT AND RESOURCE SHARING
Further information and requests for resources and reagents should be directed to and will be fulfilled by the Lead Contact: Chaoyang Sun (csun5@mdanderson.org).
EXPERIMENTAL MODEL AND SUBJECT DETAILS
Clinical Specimens
Use of ovarian cancer samples was approved by the Ethics or Institutional Review Board of Tongji Hospital, Tongji Medical College, Huazhong University of Science and Technology, China, in accordance with the Declaration of Helsinki. Informed consent was obtained from all subjects. 102 serous ovarian cancer stage IIIC or IV (International Federation of Gynecology and Obstetrics staging) samples were collected between January 2009 and October 2013. Samples were routinely fixed immediately after surgery in 10% formalin for approximately 24 hr at room temperature. After fixation, samples were dehydrated, incubated in xylene, infiltrated with paraffin, and finally embedded in paraffin.
WU-BC3 PDX, which was established in Washington University (Li et al., 2013), was obtained from Dr. Helen Piwnica-Worms in Department of Experimental Radiation Oncology in MDACC (MD Anderson Cancer Center) (Ma et al., 2012). PATX53 was obtained from Dr. Michael P. Kim in Department of Surgical Oncology in MDACC. WU-BC3 and PATX53 PDX were under IRB approved protocol by the ethics committee of the Washington University, or the MDACC respectively, with written informed consent for formation and use of PDX.
Animal Studies
6 week old female NCRNU-F sp/sp mice were purchased from Taconic and were used for OVCAR8 xenografts, WU-BC3 PDX and PATX53 PDX experiments. 6 week old female FVB mice were purchased from Taconic and were used for LPA-T127 syngeneic breast cancer model experiments. Tumors were injected or transplanted into female mice of approximately 8–10 weeks of age. All mice were housed under pathogen-free conditions at MDACC AAALAC (Association for the Assessment and Accreditation of Laboratory Animal Care) accredited facility. All animal experiments with these models were conducted in compliance with the National Institute of Health guidelines for animal research and approved by the Institutional Animal Care and Use Committee of the MDACC.
6 weeks old female C.B-17 scid mice were purchased from Charles River Laboratories and used for OVCAR3 xenografts. Tumor cells were injected into female mice of approximately 8–10 weeks of age. All mice were housed under pathogen-free conditions at AstraZeneca AAALAC accredited facility. All animal experiments were conducted in compliance with the National Institute of Health guidelines for animal research and approved by the Institutional Animal Care and Use Committee of AstraZeneca.
Cell Lines
All human cell lines were authenticated by fingerprinting using short tandem repeat testing and were verified to be free of mycoplasma contamination. All cell lines were maintained in a 5% CO2 incubator at 37°C. Detail information about cells are provided in Table S1. pCW-GFP-CtIP was a gift from Daniel Durocher (Addgene plasmid # 71109) (Orthwein et al., 2015). pCW-GFP-CtIP (T847A) was generated by site-directed mutagenesis. Cells infected with viruses expressing these cDNAs were maintained in 2 μg/mL puromycin to generate stable cell lines. GFP-CtIP and GFP-CtIP (T847A) expression were induced with 100 nM doxycycline (Dox). HOC1, SKOV3, HOC1-GFP-CtIP stably expressing RAD51 and BRCA1 were established through standard procedural.
METHOD DETAILS
Generation of PARPi resistant cells
To generate PARPi resistant cells, A2780CP and OAW42 were subjected to gradual increases in BMN673 concentrations until cells grew in the presence of 10 μM of BMN673 (3–4 months from initial exposure).
For PARPi resistant OC316 clones, cells were subjected to gradual increases in BMN673 concentrations until cells grew in the presence of 5 μM of the BMN673 (3–4 months from initial exposure). Monoclonal cell populations of the OC316 resistant cells are isolated by limiting dilution. Individual clones demonstrated different degrees of resistance to PARPi.
Cells were cultured in the absence of BMN673 for a minimum of 1 month before they were used for experiments.
RPPA
Five breast and ovarian cancer cell lines, [BT474 (PIK3CA_Mut, HER2_Amp), HCC1954 (PIK3CA_Mut and HER2_Amp), MDA-MB-468 (EGFR_Overexpression and PTEN_Mut), SKBR3 (HER2_Amp), SKOV3 (PIK3CA_Mut and HER2_Amp)], were cultured in Matrigel (3D) or monolayer (2D) and treated for 24 hr or 48 hr, respectively, with DMSO or BRD4i (GSK1210151A, GSK1324726A, GSK525762A, and JQ1). Median inhibitory concentration (IC50) was determined experimentally for JQ1 for each line for 2D and 3D conditions with other inhibitors being used at 2 concentrations (100 nM and 1000 nM). Protein lysates were analyzed by RPPA in MDACC CCSG (The Cancer Center Support Grant) supported RPPA Core. Antibodies and approaches are described at the RPPA website (https://www.mdanderson.org/research/research-resources/core-facilities/functional-proteomics-rppa-core.html). For visualization, 2D and 3D, concentrations and time were averaged for each cell line. Heat map represents “rank-ordered” changes induced by BRD4i treatment, calculated by summing median-centered protein amount normalized to DMSO.
Western blot
To prepare whole cell lysates, cells were lysed with RIPA buffer (Thermo Fisher Scientific) supplemented with Halt™ Protease and Phosphatase Inhibitor (EDTA-free) Cocktail (Thermo Fisher Scientific). After thorough mixing and incubation at 4°C for 10 min, lysate were centrifuged at 15,000 g at 4°C for 15 min, and supernatants were collected. To prepare subcellular fraction of nuclear soluble and chromatin-bound fraction, cells were treated with indicated drugs, and then cells were collected. For fractionation, we used a Subcellular Protein Fractionation kit (Thermo Fisher Scientific) following the manufacturer’s instructions. The protein content of the cell was determined, and the cellular lysates were separated by 10% SDS-PAGE, and electro-transferred onto polyvinylidene difluoride (PVDF) membranes. After being blocked with 5% non-fat milk in TBST, the membranes were incubated with primary antibodies at 4°C overnight, followed by 1:2000 horseradish peroxidase (HRP)-conjugated secondary antibody (Abcam) for 1 hr. Bands were visualized using an Pierce™ ECL Western Blotting Substrate (Thermo Fisher Scientific). Primary antibodies used are listed in Key Resources Table.
qRT-PCR
Total RNA was isolated using RNeasy Plus Mini Kit (Qiagen) according to the manufacturer’s protocol. RNA was treated with RNase-free DNase set (Qiagen) to remove contaminating genomic DNA. cDNA was synthesized using High Capacity cDNA Reverse Transcription Kit (Applied Biosystems). qRT-PCR was performed using SYBR Green Master Mix (Applied Biosystems). Data were analyzed by the ΔΔCT method using GAPDH as a housekeeping gene. The sequences of primers used are listed in Table S2.
Site-directed mutagenesis
pCW-GFP-CtIP was a gift from Daniel Durocher (Addgene plasmid # 71109) (Orthwein et al., 2015). Mutant pCW-GFP-CtIP (T847A) was generated by targeting WT pCW-GFP-CtIP using QuikChange II XL Site-Directed Mutagenesis kit (Agilent Technologies) with primers list in Table S2. Mutagenesis reactions were prepared in PCR tubes on ice: 5 μL of 10× reaction buffer, 2 μL pCW-GFP-CtIP plasmid DNA (10 ng), 1.25 μL of mutagenic primer (CtIP_T847A_F at 100 ng/ μL), 1.25 μL of mutagenic primer (CtIP_T847A_R at 100 ng/μL), 1 μL of dNTP mix, 3 μL of QuickSolution reagent, 36.5 μL PCR-quality water to a final volume of 50 μL were mixed then 1.0 μL PfuUltra HF DNA polymerase (2.5 U/μL) was fused. Tubes were placed in the cycler to begin the PCR reaction for 18 cycles. 1 μL of the Dpn I restriction enzyme (10 U/μl) was added directly to amplification reaction and mixed thoroughly and incubated at 37°C for 1 hour. Then 2 μl of the Dpn I-treated DNA was transformed to XL10-Gold Ultracompetent Cells. Mutation was confirmed by sequencing.
RNA interference
All siRNAs employed in this study were ON-TARGET plus siRNA SMARTpools purchased from GE Dharmacon (Table S2). RNA interference (RNAi) transfections were performed using Lipofectamine™ 3000 Transfection Reagent (Invitrogen) in a forward transfection mode using manufacturer’s guidelines. Except when stated otherwise, siRNAs were transfected with the amounts of siRNA oligos at 40 nM final concentration.
CCLE and NCI60 dataset
Gene expression profiles (Gene transcript level z score) for correlations analysis in NCI60 human tumor cell lines were obtained using the web-based tool provided by CellMiner (http://discover.nci.nih.gov/cellminer/). Gene expression data for Cancer Cell Line Encyclopedia (CCLE) (CCLE_expression_CN_muts_GENEE_2010-04-16.gctx) were downloaded from (https://portals.broadinstitute.org/ccle/data/browseData?conversationPropagation=begin). The correlations between gene expressions were determined by Pearson’s correlation test with R.
Microarray analysis and IPA analysis
Gene expression datasets of GSE29799 (Zuber et al., 2011), GSE66048 (Ambrosini et al., 2015), GSE44929 (Lovén et al., 2013), GSE85840 (Rhyasen et al., 2016), GSE31365 (Delmore et al., 2011), and GSE43392 (Puissant et al., 2013) were downloaded from Gene Expression Omnibus (GEO) (https://www.ncbi.nlm.nih.gov/geo). Raw data were subjected to intensity normalization using affy package in R (Bioconductor), followed by log transformation and quantile normalization. Normalized data were checked for quality and determined to be free of outliers by analysis using box plots, density plots and MA plots. Differential expression genes after BRD4 inhibition were calculated using a linear model provided by the limma package in R based on the cutoffs: 2 for absolute fold change, 0.05 for p value. Then, results were imported into Ingenuity Pathway Analysis (IPA) and a core analysis feature was used to reveal dysregulated canonical pathway after BRD4 inhibition.
HRD score acquisition from HRD signature
HRD signature consisting of 230 differentially expressed genes was obtained as previously described (Peng et al., 2014). Normalized gene expression data (GSE29799, GSE66048, GSE44929, GSE85840, GSE31365, and GSE43392) after BRD4 inhibition were subjected to unsupervised clustering with these 230 genes. HRD scores were determined by calculating the Pearson’s correlations between median centered gene expression levels for HRD signature and gene expression levels for a given sample (Peng et al., 2014).
ChIP-Seq Analysis
ChIP-seq data for T47D and HCC1935 cells from GSE63581 (Shu et al., 2016) were aligned versus hg19 human genome for mapping using bowtie. For peaking calling, MACS2 was used to get the bam files, which were converted to bigwig files later in deeptools and loaded in Intergrative Genomics Viewer (IGV) for final visualization and cross comparison. Specifically, ChIP-seq for T47D and HCC1935 cells treated with JQ1 and vehicle control were compared with input.
CtIP co-expression signature and GSEA analysis
CtIP co-expression signature was constructed base on genes whose expressions are correlated with RBBP8 levels in the CCLE dataset at cBioPortal (http://www.cbioportal.org/). 326 genes were selected using Pearson’s correlation coefficient ≥ 0.3 as cutoff. Then these 326 genes were imported into Ingenuity Pathway Analysis (IPA) for network and pathway analysis.
For GSEA analysis against CtIP co-expression signature, these 326 genes were incorporated into the GSEA Desktop v3.0 (http://www.broad.mit.edu/gsea/) as the CtIP co-expression signature. Then normalized gene expression data (GSE29799, GSE66048, GSE44929, GSE85840, GSE31365, and GSE43392) were used to calculate enrichment of CtIP co-expression signature after BRD4 inhibition by Benjamini-Hochberg (B-H) method.
Viability measurements
Five thousand cells were seeded into sterile 96-well plates and treated with indicated drug combinations for 96 hr. DMSO was used as a vehicle. PrestoBlue® Cell Viability Reagent (Thermo Fisher Scientific) was used to assess cell viability. Background values from empty wells were subtracted and data normalized to vehicle-treated control. Synergistic effects between both compounds were calculated using using the Chou-Talalay equation in CalcuSyn software, which takes into account both potency (IC50) and shape of the dose-effect curve. CI<0.5 indicates synergism, CI between 0.5 to 1 indicates additive effects, and CI>1 indicates antagonism.
Immunohistochemical staining (IHC)
Tissues were fixed in 10% formalin overnight and embedded in paraffin. 4 μm paraffin embedded sections were first deparaffinized in xylene. IHC were carried out with EnVision Detection Systems HRP. Rabbit/Mouse (DAB+) kit (Agilent) following manufacturer’s instructions. Endogenous peroxidase was blocked by incubation with 0.3% hydrogen peroxide for 15 min. Antigen retrieval was performed by boiling the slides in citrate buffer (10 mM, pH 6.0) in a water bath for 20 min. Slides were rinsed in PBS Tween 0.05% and blocked for 30 min with 5% bovine serum albumin (BSA). Slide were incubated overnight at 4°C with primary antibodies (anti-BRD4, #13440S, 1:200; anti-CtIP, #9201S, 1:200 from Cell Signaling Technology; anti-RAD51, PC130, 1:100; anti-γ-H2AX (Ser139), clone JBW301, 1:500 from Millipore Corp; and anti-pRPA32(S4/8), A300-245A, 1:1000 from Bethyl Laboratories), followed by 1 hr with Labelled Polymer-HRP at room temperature. Negative controls were treated identically, but without primary antibody. Subsequently, slides were incubated with DAB+ Chromogen. Slides were counterstained with hematoxylin. After mounting, slides were observed under microscope and photographed.
The IHC score for BRD4 and CtIP staining are the average of the score of tumor-cell staining multiplied by the score of staining intensity. Tumor cell staining was assigned a score using a semi-quantitative five-category grading system: 0, no tumor-cell staining; 1, 1–10% tumor-cell staining; 2, 11–25% tumor-cell staining; 3, 26–50% tumor-cell staining; 4, 51–75% tumor-cell staining; and 5, > 75% tumor-cell staining. Staining intensity was assigned a score using a semi-quantitative four-category grading system: 0, no staining; 1, weak staining; 2, moderate staining; and 3, strong staining. Every core was assessed individually and the mean of three readings was calculated for every case. Tumor cell staining score was determined separately by two independent experts simultaneously under the same conditions. In rare cases, discordant scores were reevaluated and scored on the basis of consensus opinion.
Alkaline single-cell agarose gel electrophoresis (comet) assays
Alkaline comet assays were performed with Comet Assay Kit (Trevigen) using manufacturer’s instructions. Briefly, cell suspensions were embedded in LM (low melting) Agarose and deposited on comet slides. Slides were incubated for 1 hr at 4°C in lysis solution, followed by immersing slides in freshly prepared alkaline unwinding solution (pH > 13) for 20 min at room temperature in the dark. Electrophoresis was carried out for 30 min at 21 V in electrophoresis solution (pH > 13). Slides were then stained with SYBR™ Gold (Thermo Fisher Scientific). Tail DNA content was analyzed with Comet score 1.5 software. DNA strand breakage was expressed as “comet tail moment”. The tail moment was measured for a minimum of 50 cells per sample, and average damage from 3 independent experiments was calculated.
Clonogenic assay
Five thousand cells were seeded in triplicate into six-well plates and allowed to adhere overnight. Cells were then cultured in absence or presence of drug for 7–10 days as indicated. Remaining cells were fixed with formaldehyde (4%), stained with Crystal violet solution (sigma), and photographed using a digital scanner.
Chromatin immunoprecipitation (ChIP-qPCR)
ChIP assays were performed with EZ-Magna ChIP™ A/G Chromatin Immunoprecipitation Kit (Millipore Corp) as described in manufacturer’s instructions. Briefly, cells were crosslinked with 1% formaldehyde. After cell lysis, isolated nuclei were subjected to sonication for chromatin fragmentation. Sheared chromatin was diluted in diluted buffer, and divided into aliquots for immunoprecipitation. Anti-BRD4 antibody (1:50, #13440S, Cell Signaling), anti-H3K27ac antibody (1:100, ab4729, Abcam), anti-H3K4M1 antibody (1:200, ab8895, Abcam), anti-Pol II antibody (1:100, sc-47701, Santa Cruz) or normal Rabbit IgG control (1:200, #2729, Cell Signaling) were added to chromatin samples, followed by overnight incubation at 4°C, with rotation. Antibody-chromatin complexes were captured using magnetic protein A/G beads. Purified DNAs were subjected to quantitative PCR (qPCR). All primers are list in Table S2.
Detection of ssDNA by immunofluorescence
Cells were grown in 50 μg/ml BrdU for two doubling times before irradiation. Where indicated, 200 nM JQ1 was added 4 hr before irradiation. Cells were placed on ice 10 min before irradiation and kept on ice during the irradiation with 10 Gy. Warm media with or without JQ1 was added for 4 hr at 37°C. BrdU was stained (anti-BrdU, ab8152, 1:100 from Abcam) in non-denaturing conditions which enables detection of BrdU incorporated in ssDNA. TE-2000 imaging acquisition system (Nikon) equipped with a 60× objective lens was used to capture images. Stained was quantified by ImageJ.
Immunofluorescence staining and microscopy
Briefly, cells were washed with PBS and fixed with 4% paraformaldehyde for 5 min, followed by permeabilization with 0.5% NP-40 and 1% Triton X-100 for 10 min. Cells were then blocked with 5% FBS for 30 min and incubated with primary antibody (anti-RAD51, PC130, 1:100; anti-γ-H2AX (Ser139), clone JBW301, 1:1000 from Millipore Corp; anti-RPA32, ab2175, 1:500 from Abcam) for 2 hr, followed by secondary antibody incubation for 1 hr at room temperature. Slides were sealed in mounting medium containing DAPI (Vector Laboratories, H1200) for further image acquisition. TE-2000 imaging acquisition system (Nikon) equipped with a 60× objective lens was used to capture images. Stained was quantified by ImageJ.
HR repair analysis
U2OS DR-GFP cells contain a single copy of the HR repair reporter substrate DR-GFP, which contains two nonfunctional GFP open reading frames, including one GFP-coding sequence that is interrupted by a recognition site for the I-SceI endonuclease. Expression of I-SceI leads to formation of a DSB in the I-SceI GFP allele, which can be repaired by HR using the nearby GFP sequence lacking the N- and C-termini, thereby producing functional GFP that can be detected by flow cytometry. To examine the role of JQ1 or individual genes in DSB repair, cells were treated with JQ1 (100 nM), AZD5153 (100 nM) or transfected with CtIP or BRD4 siRNA for 24 hr. Then, cells were transfected with a plasmid expressing I-SceI (pCBASce) for 48 hr. Cells transfected with an empty vector were used as a negative control. GFP-expressing plasmid (pEGFP-C1) was used for transfection efficiency control. Flow cytometry analysis was performed to detect GFP+ cells using FACScalibur with CellQuest software (Becton Dickinson). The repair efficiency was scored as the percentage of GFP+ cells.
In vivo drug studies
OVCAR8 xenografts
1 × 10⁶ OVCAR8 cells were injected s.c. into mouse flanks in a 1:1 mix of PBS and Matrigel. When tumors reached 50 to 200 mm3, drugs were administered daily by [vehicle (0.5% hydroxypropylmethylcellulose and 0.2% Tween 80, oral gavage), BMN673 (0.333 mg/kg, oral gavage), and JQ1 (40 mg/kg, I.P.), or combinations of BMN673 and JQ1, n=6 per group]. Mice were treated for 28 day and sacrificed for tissue analysis. Tumor volumes were calculated using volume=length*width/2.
WU-BC3 PDX
2 × 106 WU-BC3 cells (Ma et al., 2012) were injected subcutaneously into flanks mice in a 1:1 mix of PBS and Matrigel. After palpable tumors formed, drugs were administered daily by [vehicle (0.5% hydroxypropylmethylcellulose and 0.2% Tween 80, oral gavage), BMN673 (0.333 mg/kg, oral gavage), and JQ1 (40 mg/kg, I.P), or combinations of BMN673 and JQ1, n=6 per group]. Mice were treated until Day 28 and sacrificed for tissue harvest.
PATX53 PDX
Minced fresh tumor tissue (0.1–0.2 cm3 per mouse) was transplanted subcutaneously into flanks of mice. After palpable tumors formed, drugs were administered daily by [vehicle (0.5% hydroxypropylmethylcellulose and 0.2% Tween 80, oral gavage), Olaparib (100 mg/kg, oral gavage), AZD5153 (2.5 mg/kg, oral gavage), or combinations of Olaparib and AZD5153, n=6 per group]. Mice were treated until Day 28 and sacrificed for tissue harvest.
LPA1-T127 syngeneic breast cancer models
LPA-T127 is a primary invasive and metastatic mammary cancer from transgenic mice, with expression of LPA1 receptor in mammary epithelium and a spontaneous KRASQ61H mutation (Liu et al., 2009, Federico et al., 2017). Minced fresh tumor tissue (0.1–0.2 cm3 per mouse) was transplanted into mammary fat pads of FVB mice. After palpable tumors formed, drugs were administered daily by [vehicle (0.5% hydroxypropylmethylcellulose and 0.2% Tween 80, oral gavage), BMN673 (0.333 mg/kg, oral gavage), and JQ1 (40 mg/kg, I.P.), or combinations of BMN673 and JQ1, n=6 per group]. Mice were sacrificed when tumor diameter reach maximum limit of 2.5 cm at Day 22.
We also repeated LPA-T127 with daily [vehicle (0.5% hydroxypropylmethylcellulose and 0.2% Tween 80, oral gavage), Olaparib (100 mg/kg, oral gavage), AZD5153 (2.5 mg/kg, oral gavage), or combinations of Olaparib and AZD5153, n=6 per group]. Mice were sacrificed when tumor diameter reached maximum limits of 2.5 cm at Day 22 for tissue harvest and blood collection 3 hr after the final treatment.
OVCAR3 Xenograft
2 × 10⁷ OVCAR3 cells were injected subcutaneously in the right flank of mice. Mice were randomized based on tumor volumes using stratified sampling and enrolled into control and treatment groups. Dosing began when mean tumor size reached approximately 200 mm3 and continued for 35 days. Drugs were administered daily by [vehicle (0.5% hydroxypropylmethylcellulose and 0.2% Tween 80, oral gavage), oral gavage), Olaparib (100 mg/kg, oral gavage), AZD5153 (2.5 mg/kg, oral gavage), or combinations of Olaparib and AZD5153], n=10 per group].
QUANTIFICATION AND STATISTICAL ANALYSIS
Two-sided Student’s t test was used to compare differences between two groups of cells in vitro. Data are presented as means ± SEM, and p<0.05 is considered significant. The correlation between groups was determined by Pearson’s correlation test. Analysis of variance was used to compare differences among multiple groups. All statistical analyses were done using SPSS 17.0 (SPSS Inc.). Data were analyzed and plotted using GraphPad Prism 6 software and Microsoft Excel.
DATA AND SOFTWARE AVAILABILITY
Following GEO datasets of BRD4 inhibition were used for gene expression analysis: GSE29799, GSE66048, GSE44929, GSE85840, GSE31365, and GSE43392. CHIP-seq data after treatment with JQ1 with BRD4 antibody were obtained from GSE63581. Gene expression data of NCI60 can be accessed at website: http://discover.nci.nih.gov/cellminer/. Gene expression data of CCLE utilized in this paper can be accessed at website: https://portals.broadinstitute.org/ccle/data/browseData?conversation-Propagation=begin.
KEY RESOURCES TABLE
| REAGENT or RESOURCE | SOURCE | IDENTIFIER |
|---|---|---|
| Antibodies | ||
| BRCA1 (D-9) antibody | Santa Cruz | sc-6954, RRID:AB_626761 |
| ERK 2 (C-14) antibody | Santa Cruz | sc-154, RRID:AB_2141292 |
| RAD51 (H-92) antibody for Western blot | Santa Cruz | sc-8349, RRID:AB_2253533 |
| BRD3 (2088C3a) antibody | Santa Cruz | sc-81202, RRID:AB_1119692 |
| CtIP (D76F7) Rabbit mAb antibody | Cell Signaling Technology | #9201S, RRID:AB_10828593 |
| MRE11 (31H4) Rabbit mAb antibody | Cell Signaling Technology | #4847S, RRID:AB_10693469 |
| 53BP1 Antibody | Cell Signaling Technology | #4937S, RRID:AB_10694558 |
| BRD4 (E2A7X) Rabbit Antibody | Cell Signaling Technology | #13440S, RRID:AB_2687578 |
| BRD2 (D89B4) Rabbit mAb antibody | Cell Signaling Technology | #5848S, RRID:AB_10835146 |
| RAD51 (Ab-1) Rabbit pAb antibody for immunofluorescence and IHC | Millipore Corp | PC130, RRID:AB_2238184 |
| Histone H2A.X, phospho (Ser139) Monoclonal antibody, Unconjugated, Clone jbw301 | Millipore Corp | 05-636, RRID:AB_309864 |
| RPA32/RPA2 antibody [9H8] | Abcam | ab2175, RRID:AB_302873 |
| RAD50 antibody [EPR3466(2)] | Abcam | ab124682, RRID:AB_11000808 |
| NBS1 antibody [Y112] - ChIP Grade | Abcam | ab32074, RRID:AB_777007 |
| Phospho RPA32 (S4/S8) Antibody | Bethyl Laboratories | A300-245A, RRID:AB_210547 |
| Phospho RPA32 (S33) Antibody | Bethyl Laboratories | A300-246A, RRID:AB_2180847 |
| RPA70 antibody [EPR3472] | Abcam | ab79398, RRID:AB_1603759 |
| Histone H3 antibody - ChIP Grade | Abcam | ab1791, RRID:AB_302613 |
| H3K27ac-human antibody | Abcam | ab4729, RRID:AB_2118291 |
| PARP-1 (H-250) antibody | Santa Cruz | sc-7150, RRID:AB_2160738 |
| Pol II (CTD4H8) antibody | Santa Cruz | sc-47701, RRID:AB_677353 |
| Histone H3 (mono methyl K4) antibody - ChIP Grade | Abcam | ab8895, RRID:AB_306847 |
| normal Rabbit IgG | Cell Signaling Technology | #2729. RRID:AB_737197 |
| BrdU antibody [IIB5] | Abcam | ab8152, RRID:AB_308713 |
| Anti-Mouse IgG, HRP-linked | Fisher Scientific | 45-000-680; RRID:AB_2721110 |
| Anti-Rabbit IgG, HRP-linked | Fisher Scientific | Cat# 45-000-683; RRID:AB_2721111 |
| Bacterial and Virus Strains | ||
| DH5alpha | Thermo Fisher Scientific | Cat# 18258012 |
| XL10-Gold Ultracompetent Cells | Agilent | Cat# 200521 |
| Biological Samples | ||
| Ovarian cancer tissue | Laboratory of Dr. Ding Ma | N/A |
| PATX53 PDX | Laboratory of Dr. Michael P. Kim | N/A |
| WU-BC3 PDX | Laboratory of Dr. Helen Piwnica-Worms, Ma et al., 2012 | N/A |
| LPA1-T127 | Federico et al., 2017, Liu et al., 2009 | N/A |
| Chemicals, Peptides, and Recombinant Proteins | ||
| SYBR™ Gold Nucleic Acid Gel Stain (10,000X Concentrate in DMSO) | Thermo Fisher Scientific | S-11494 |
| Pierce™ ECL Western Blotting Substrate | Thermo Fisher Scientific | 32106 |
| RIPA Lysis and Extraction Buffer | Thermo Fisher Scientific | 89900 |
| Crystal violet solution | Sigma | HT90132-1L |
| SYBR Green Master Mix | Applied Biosystems | 4385612 |
| Lipofectamine™ 3000 Transfection Reagent | Thermo Fisher Scientific | L3000015 |
| Formaldehyde solution | Sigma | 252549-100ML |
| Doxycycline hyclate | Sigma | D9891 |
| Halt™ Protease and Phosphatase Inhibitor Cocktail, EDTA-free (100X) | Thermo Fisher Scientific | 78441 |
| Antifade Mounting Medium with DAPI | Vector Laboratories | H1200 |
| BMN673 for in vitro | Selleck Chemicals | S7048 |
| ABT888 for in vitro | Selleck Chemicals | S1004 |
| Olaparib for in vitro | Selleck Chemicals | S1060 |
| JQ1 for in vitro | Selleck Chemicals | S7110 |
| GSK1210151A for in vitro | Selleck Chemicals | S2780 |
| GSK1324726A for in vitro | Selleck Chemicals | S7620 |
| AZD5153 for in vitro | Selleck Chemicals | S8344 |
| GSK1210151A | GlaxoSmithKline | N/A |
| GSK525762A | GlaxoSmithKline | N/A |
| GSK1324726A | GlaxoSmithKline | N/A |
| BMN673 for in vivo | Stand Up to Cancer Dream Team Translational Research Grant (SU2C-AACR-DT0209) | N/A |
| JQ1 for in vivo | APExBIO | A1910 |
| AZD5153 for in vivo | AstraZeneca | N/A |
| Olaparib for in vivo | AstraZeneca | N/A |
| Critical Commercial Assays | ||
| QuikChange II XL Site-Directed Mutagenesis Kit | Agilent | Cat# 200521 |
| RNeasy Plus Mini Kit | Qiagen | Cat# 74134 |
| RNase-free DNase set | Qiagen | Cat# 79254 |
| High Capacity cDNA Reverse Transcription Kit | Applied Biosystems | Cat# 4368814 |
| EZ-Magna ChIP™ A/G Chromatin Immunoprecipitation Kit | Millipore Corp | Cat# 17-10086 |
| PrestoBlue® Cell Viability Reagent | Thermo Fisher Scientific | Cat# A-13262 |
| CometAssay® Kit (25 × 2 well slides) | Trevigen | Cat# 4250-050-K |
| Subcellular Protein Fractionation Kit for Cultured Cells | Thermo Fisher Scientific | Cat# 78840 |
| EnVision Detection Systems Peroxidase/DAB, Rabbit/Mouse, HRP. Rabbit/Mouse (DAB+), 150 tests | Agilent | Cat# K4065 |
| Deposited Data | ||
| Murine or human MLL-AF9/NrasG12D cell line under the condition that BRD4 was suppressed by using shRNAs or the small molecule inhibitor JQ1 | Zuber et al., 2011 | GEO: GSE29799 |
| Gene expression changes occuring in response to treament with JQ1 in Uveal melanoma cells | Ambrosini et al., 2015 | GEO: GSE66048 |
| Gene expression profiling in multiple myeloma cells after BET-Bromodomain inhibition with JQ1 | Lovén J et al., 2013 | GEO: GSE44929 |
| mRNA-seq in cell lines treated with either AZD5153 or DMSO for 24h | Rhyasen et al., 2016 | GEO: GSE85840 |
| Gene expression profiling in cells treated with either DMSO alone or with JQ1 (500 nM), for 24 hours | Delmore et al., 2011 | GEO: GSE31365 |
| Gene expression profiling in cells treated with 1 μM JQ1 or DMSO for 24 hours. | Puissant et al., 2013 | GEO: GSE43392 |
| Response and resistance to BET bromodomain inhibitors in triple negative breast cancer [ChIP-Seq] | Shu et al., 2016 | GEO: GSE63581 |
| Gene expression profiles in NCI60 | NCI60 | http://discover.nci.nih.gov/cellminer/ |
| Gene expression profiles in CCLE | CCLE | https://portals.broadinstitute.org/ccle/data/browseData?conversationPropagation=begin |
| Experimental Models: Cell Lines | ||
| See Table S1 | ||
| Experimental Models: Organisms/Strains | ||
| Mouse: NCRNU-F sp/sp, CrTac:NCr-Foxn1nu mice | Taconic | N/A |
| Mouse: FVB-F, FVB/NTac | Taconic | N/A |
| Mouse: C.B-17 scid | Charles River Laboratories | Strain Code: 251 |
| Oligonucleotides | ||
| See Table S2 | ||
| Recombinant DNA | ||
| pCW-GFP-CtIP | Dr. Daniel Durocher | Addgene Plasmid # 71109 |
| pCW-GFP-CtIP-T847A | This paper | N/A |
| pCDH-CMV- BRCA1 | This paper | N/A |
| pCDH-CMV- RAD51 | This paper | N/A |
| pCBASceI | Dr. Maria Jasin | Addgene Plasmid #26477 |
| Software and Algorithms | ||
| Bioconductor | N/A | http://bioconductor.org |
| GraphPad PRISM 6 | GraphPad Software | https://www.graphpad.com/scientific-software/prism/ |
| R | N/A | https://www.r-project.org/ |
| MACS2 | N/A | https://github.com/taoliu/MACS |
| Intergrative Genomics Viewer (IGV) | Broad Institute | http://software.broadinstitute.org/software/igv/ |
| ImageJ | NIH | https://imagej-nih-gov.laneproxy.stanford.edu/ij/ |
| GSEA | Broad Institute | http://software.broadinstitute.org/gsea/index.jsp |
| IPA | Qiagen | https://www.qiagenbioinformatics.com/products/ingenuity-pathway-analysis/ |
| CalcuSyn | Biosoft | http://www.biosoft.com/w/calcusyn.htm |
| MCLP | MD Anderson Cell Lines Project | http://tcpaportal.org/mclp/#/ |
| Other | ||
Supplementary Material
Highlights.
BRD4 inhibition decreases homologous recombination competency by decreasing CtIP.
PARP and BRD4 inhibitors demonstrate synergy in multiple cancer lineages.
CtIP rescues DNA end resection and HR defect caused by BRD4 inhibition.
BRD4 inhibition resensitizes cells with acquired PARPi resistance to PARPi.
Significance.
PARPi are emerging as exciting therapeutic options for patients whose tumors harbor defects in HR. Unfortunately, rapid emergence of resistance leads to short duration of response. Thus preventing the emergence or reversing established PARPi resistance and extending the spectrum of patients who benefit from PARPi by inducing HRD in otherwise HR competent tumors are urgent needs. We demonstrate that inhibition of BRD4 results in synergistic responses to PARPi reversing intrinsic resistance in RAS mutant tumors as well as additional mechanisms of PARPi resistance. Thus PARPi and BRD4i combinations warrant clinical assessment in both PARPi sensitive and resistant cancers and, in particular, RAS mutant tumors where there are few therapeutic options.
Acknowledgments
We thank Dr. Anirban Maitra for Pa01c, Pa03C, Pa04c, Pa09c, Pa16c, Pa18c, and Pa21c cells. We thank Drs. Helen Piwnica-Worms and Abena Redwood for WU-BC3 cell and a P53 knockdown variant. This study is supported by Susan G. Komen grant SAC110052; Stand Up to Cancer Dream Team Translational Research grant (SU2C-AACR-DT0209); Breast Cancer Research Foundation (BCRF‐17‐108), Ovarian Cancer Research Foundation (OCRF 545152), Cancer Prevention & Research Institute of Texas (CPRIT RP170640), NIH grants 5U01CA168394, 5P50CA098258, and 5P50CA083639; Cancer Center Support grant CA016672; and the Dr. Miriam and Sheldon G. Adelson Medical Research Foundation (all to G.B.M.).
Footnotes
Publisher's Disclaimer: This is a PDF file of an unedited manuscript that has been accepted for publication. As a service to our customers we are providing this early version of the manuscript. The manuscript will undergo copyediting, typesetting, and review of the resulting proof before it is published in its final citable form. Please note that during the production process errors may be discovered which could affect the content, and all legal disclaimers that apply to the journal pertain.
Declaration of interests: G.B.M. has licensed an HRD assay to Myriad Genetics; is a SAB (Scientific Advisory Board) member/consultant with AstraZeneca, Catena Pharmaceuticals, Critical Outcome Technologies, ImmunoMET, Ionis, MedImmune, Nuevolution, Pfizer, SignalChem Lifesciences, Symphogen, Takeda/Millennium Pharmaceuticals, and Tarveda; and has stock options with Catena Pharmaceuticals, ImmunoMet, Spindle Top Ventures, and Tarveda. G.B.M. receives research support from AbbVie, AstraZeneca, Critical Outcomes Technology, Illumina, Ionis, Karus Therapeutics, NanoString, Pfizer, Takeda/Millennium Pharmaceuticals, and Tesaro. M.H., M.O’.C., S.F. and H.C. are employees of AstraZeneca.
Author contributions: C.S. conceived and performed experiments and wrote the manuscript. J.Y., Y.F., and J.C. performed experiments. W.Z., Z.J. analyzed RPPA data. X.C., C.P.V., and Y.L. performed RPPA. D.Z. and K.J.J. conducted IHC. M.H., M.O’.C., H.C., S.F. performed OVCAR3 xenograft experiments. F.M.B., T.Y., S-Y.L., H.C. and G.P. provided expertise and feedback. G.B.M. conceived and coordinated the project and wrote the manuscript.
References
- Ambrosini G, Sawle AD, Musi E, Schwartz GK. BRD4-targeted therapy induces Myc-independent cytotoxicity in Gnaq/11-mutatant uveal melanoma cells. Oncotarget. 2015;6:33397–33409. doi: 10.18632/oncotarget.5179. [DOI] [PMC free article] [PubMed] [Google Scholar]
- Delmore JE, Issa GC, Lemieux ME, Rahl PB, Shi J, Jacobs HM, Kastritis E, Gilpatrick T, Paranal RM, Qi J, et al. BET bromodomain inhibition as a therapeutic strategy to target c- Myc. Cell. 2011;146:904–917. doi: 10.1016/j.cell.2011.08.017. [DOI] [PMC free article] [PubMed] [Google Scholar]
- Asangani IA, Dommeti VL, Wang X, Malik R, Cieslik M, Yang R, Escara-Wilke J, Wilder-Romans K, Dhanireddy S, Engelke C, et al. Therapeutic targeting of BET bromodomain proteins in castration-resistant prostate cancer. Nature. 2014;510:278–282. doi: 10.1038/nature13229. [DOI] [PMC free article] [PubMed] [Google Scholar]
- Broderick R, Nieminuszczy J, Baddock HT, Deshpande RA, Gileadi O, Paull TT, McHugh PJ, Niedzwiedz W. EXD2 promotes homologous recombination by facilitating DNA end resection. Nature cell biology. 2016;18:271–280. doi: 10.1038/ncb3303. [DOI] [PMC free article] [PubMed] [Google Scholar]
- Bryant HE, Schultz N, Thomas HD, Parker KM, Flower D, Lopez E, Kyle S, Meuth M, Curtin NJ, Helleday T. Specific killing of BRCA2-deficient tumours with inhibitors of poly(ADP-ribose) polymerase. Nature. 2005;434:913–917. doi: 10.1038/nature03443. [DOI] [PubMed] [Google Scholar]
- Bunting SF, Callen E, Wong N, Chen HT, Polato F, Gunn A, Bothmer A, Feldhahn N, Fernandez-Capetillo O, Cao L, et al. 53BP1 inhibits homologous recombination in Brca1- deficient cells by blocking resection of DNA breaks. Cell. 2010;141:243–254. doi: 10.1016/j.cell.2010.03.012. [DOI] [PMC free article] [PubMed] [Google Scholar]
- Byers LA, Wang J, Nilsson MB, Fujimoto J, Saintigny P, Yordy J, Giri U, Peyton M, Fan YH, Diao L, et al. Proteomic profiling identifies dysregulated pathways in small cell lung cancer and novel therapeutic targets including PARP1. Cancer discovery. 2012;2:798–811. doi: 10.1158/2159-8290.CD-12-0112. [DOI] [PMC free article] [PubMed] [Google Scholar]
- Cancer Genome Atlas Research, N. Integrated genomic analyses of ovarian carcinoma. Nature. 2011;474:609–615. doi: 10.1038/nature10166. [DOI] [PMC free article] [PubMed] [Google Scholar]
- Davies OR, Forment JV, Sun M, Belotserkovskaya R, Coates J, Galanty Y, Demir M, Morton CR, Rzechorzek NJ, Jackson SP, Pellegrini L. CtIP tetramer assembly is required for DNA- end resection and repair. Nature structural & molecular biology. 2015;22:150–157. doi: 10.1038/nsmb.2937. [DOI] [PMC free article] [PubMed] [Google Scholar]
- Dawson MA, Prinjha RK, Dittmann A, Giotopoulos G, Bantscheff M, Chan WI, Robson SC, Chung CW, Hopf C, Savitski MM, et al. Inhibition of BET recruitment to chromatin as an effective treatment for MLL-fusion leukaemia. Nature. 2011;478:529–533. doi: 10.1038/nature10509. [DOI] [PMC free article] [PubMed] [Google Scholar]
- De Santa F, Barozzi I, Mietton F, Ghisletti S, Polletti S, Tusi BK, Muller H, Ragoussis J, Wei CL, Natoli G. A large fraction of extragenic RNA pol II transcription sites overlap enhancers. PLoS Biol. 2010;8:e1000384. doi: 10.1371/journal.pbio.1000384. [DOI] [PMC free article] [PubMed] [Google Scholar]
- Delmore JE, Issa GC, Lemieux ME, Rahl PB, Shi J, Jacobs HM, Kastritis E, Gilpatrick T, Paranal RM, Qi J, et al. BET bromodomain inhibition as a therapeutic strategy to target c- Myc. Cell. 2011;146:904–917. doi: 10.1016/j.cell.2011.08.017. [DOI] [PMC free article] [PubMed] [Google Scholar]
- Farmer H, McCabe N, Lord CJ, Tutt AN, Johnson DA, Richardson TB, Santarosa M, Dillon KJ, Hickson I, Knights C, et al. Targeting the DNA repair defect in BRCA mutant cells as a therapeutic strategy. Nature. 2005;434:917–921. doi: 10.1038/nature03445. [DOI] [PubMed] [Google Scholar]
- Federico L, Chong Z, Zhang D, McGrail DJ, Zhao W, Jeong KJ, Vellano CP, Ju Z, Gagea M, Liu S, et al. A murine preclinical syngeneic transplantation model for breast cancer precision medicine. Sci Adv. 2017;3:e1600957. doi: 10.1126/sciadv.1600957. [DOI] [PMC free article] [PubMed] [Google Scholar]
- Filippakopoulos P, Qi J, Picaud S, Shen Y, Smith WB, Fedorov O, Morse EM, Keates T, Hickman TT, Felletar I, et al. Selective inhibition of BET bromodomains. Nature. 2010;468:1067–1073. doi: 10.1038/nature09504. [DOI] [PMC free article] [PubMed] [Google Scholar]
- Gosmini R, Nguyen VL, Toum J, Simon C, Brusq JM, Krysa G, Mirguet O, Riou-Eymard AM, Boursier EV, Trottet L, et al. The discovery of I-BET726 (GSK1324726A), a potent tetrahydroquinoline ApoA1 up-regulator and selective BET bromodomain inhibitor. J Med Chem. 2014;57:8111–8131. doi: 10.1021/jm5010539. [DOI] [PubMed] [Google Scholar]
- Hoeijmakers JH. Genome maintenance mechanisms for preventing cancer. Nature. 2001;411:366–374. doi: 10.1038/35077232. [DOI] [PubMed] [Google Scholar]
- Huertas P. DNA resection in eukaryotes: deciding how to fix the break. Nature structural & molecular biology. 2010;17:11–16. doi: 10.1038/nsmb.1710. [DOI] [PMC free article] [PubMed] [Google Scholar]
- Huertas P, Jackson SP. Human CtIP mediates cell cycle control of DNA end resection and double strand break repair. The Journal of biological chemistry. 2009;284:9558–9565. doi: 10.1074/jbc.M808906200. [DOI] [PMC free article] [PubMed] [Google Scholar]
- Ira G, Pellicioli A, Balijja A, Wang X, Fiorani S, Carotenuto W, Liberi G, Bressan D, Wan L, Hollingsworth NM, et al. DNA end resection, homologous recombination and DNA damage checkpoint activation require CDK1. Nature. 2004;431:1011–1017. doi: 10.1038/nature02964. [DOI] [PMC free article] [PubMed] [Google Scholar]
- Jackson SP, Bartek J. The DNA-damage response in human biology and disease. Nature. 2009;461:1071–1078. doi: 10.1038/nature08467. [DOI] [PMC free article] [PubMed] [Google Scholar]
- Jaspers JE, Kersbergen A, Boon U, Sol W, van Deemter L, Zander SA, Drost R, Wientjens E, Ji J, Aly A, et al. Loss of 53BP1 causes PARP inhibitor resistance in Brca1-mutated mouse mammary tumors. Cancer discovery. 2013;3:68–81. doi: 10.1158/2159-8290.CD-12-0049. [DOI] [PMC free article] [PubMed] [Google Scholar]
- Kaidi A, Weinert BT, Choudhary C, Jackson SP. Human SIRT6 promotes DNA end resection through CtIP deacetylation. Science. 2010;329:1348–1353. doi: 10.1126/science.1192049. [DOI] [PMC free article] [PubMed] [Google Scholar] [Retracted]
- Kaufman B, Shapira-Frommer R, Schmutzler RK, Audeh MW, Friedlander M, Balmana J, Mitchell G, Fried G, Stemmer SM, Hubert A, et al. Olaparib monotherapy in patients with advanced cancer and a germline BRCA1/2 mutation. Journal of clinical oncology : official journal of the American Society of Clinical Oncology. 2015;33:244–250. doi: 10.1200/JCO.2014.56.2728. [DOI] [PMC free article] [PubMed] [Google Scholar]
- Kim TK, Hemberg M, Gray JM, Costa AM, Bear DM, Wu J, Harmin DA, Laptewicz M, Barbara-Haley K, Kuersten S, et al. Widespread transcription at neuronal activity-regulated enhancers. Nature. 2010;465:182–187. doi: 10.1038/nature09033. [DOI] [PMC free article] [PubMed] [Google Scholar]
- Kondrashova O, Nguyen M, Shield-Artin K, Tinker AV, Teng NNH, Harrell MI, Kuiper MJ, Ho GY, Barker H, Jasin M, et al. Secondary Somatic Mutations Restoring RAD51C and RAD51D Associated with Acquired Resistance to the PARP Inhibitor Rucaparib in High-Grade Ovarian Carcinoma. Cancer discovery. 2017;7:984–998. doi: 10.1158/2159-8290.CD-17-0419. [DOI] [PMC free article] [PubMed] [Google Scholar]
- Ledermann JA, Harter P, Gourley C, Friedlander M, Vergote I, Rustin G, Scott C, Meier W, Shapira-Frommer R, Safra T, et al. Overall survival in patients with platinum-sensitive recurrent serous ovarian cancer receiving olaparib maintenance monotherapy: an updated analysis from a randomised, placebo-controlled, double-blind, phase 2 trial. The Lancet Oncology. 2016;17:1579–1589. doi: 10.1016/S1470-2045(16)30376-X. [DOI] [PubMed] [Google Scholar]
- Li S, Shen D, Shao J, Crowder R, Liu W, Prat A, He X, Liu S, Hoog J, Lu C, et al. Endocrine-therapy-resistant ESR1 variants revealed by genomic characterization of breast-cancer- derived xenografts. Cell Rep. 2013;4:1116–1130. doi: 10.1016/j.celrep.2013.08.022. [DOI] [PMC free article] [PubMed] [Google Scholar]
- Lin ZP, Ratner ES, Whicker ME, Lee Y, Sartorelli AC. Triapine disrupts CtIP-mediated homologous recombination repair and sensitizes ovarian cancer cells to PARP and topoisomerase inhibitors. Mol Cancer Res. 2014;12:381–393. doi: 10.1158/1541-7786.MCR-13-0480. [DOI] [PMC free article] [PubMed] [Google Scholar]
- Liu S, Umezu-Goto M, Murph M, Lu Y, Liu W, Zhang F, Yu S, Stephens LC, Cui X, Murrow G, et al. Expression of autotaxin and lysophosphatidic acid receptors increases mammary tumorigenesis, invasion, and metastases. Cancer cell. 2009;15:539–550. doi: 10.1016/j.ccr.2009.03.027. [DOI] [PMC free article] [PubMed] [Google Scholar]
- Loven J, Hoke HA, Lin CY, Lau A, Orlando DA, Vakoc CR, Bradner JE, Lee TI, Young RA. Selective inhibition of tumor oncogenes by disruption of super-enhancers. Cell. 2013;153:320–334. doi: 10.1016/j.cell.2013.03.036. [DOI] [PMC free article] [PubMed] [Google Scholar]
- Ma CX, Cai S, Li S, Ryan CE, Guo Z, Schaiff WT, Lin L, Hoog J, Goiffon RJ, Prat A, et al. Targeting Chk1 in p53-deficient triple-negative breast cancer is therapeutically beneficial in human-in-mouse tumor models. J Clin Invest. 2012;122:1541–1552. doi: 10.1172/JCI58765. [DOI] [PMC free article] [PubMed] [Google Scholar]
- Mirza MR, Monk BJ, Herrstedt J, Oza AM, Mahner S, Redondo A, Fabbro M, Ledermann JA, Lorusso D, Vergote I, et al. Niraparib Maintenance Therapy in Platinum-Sensitive, Recurrent Ovarian Cancer. The New England journal of medicine. 2016;375:2154–2164. doi: 10.1056/NEJMoa1611310. [DOI] [PubMed] [Google Scholar]
- Murai J, Huang SY, Das BB, Renaud A, Zhang Y, Doroshow JH, Ji J, Takeda S, Pommier Y. Trapping of PARP1 and PARP2 by Clinical PARP Inhibitors. Cancer research. 2012;72:5588–5599. doi: 10.1158/0008-5472.CAN-12-2753. [DOI] [PMC free article] [PubMed] [Google Scholar]
- Nicodeme E, Jeffrey KL, Schaefer U, Beinke S, Dewell S, Chung CW, Chandwani R, Marazzi I, Wilson P, Coste H, et al. Suppression of inflammation by a synthetic histone mimic. Nature. 2010;468:1119–1123. doi: 10.1038/nature09589. [DOI] [PMC free article] [PubMed] [Google Scholar]
- Norquist B, Wurz KA, Pennil CC, Garcia R, Gross J, Sakai W, Karlan BY, Taniguchi T, Swisher EM. Secondary somatic mutations restoring BRCA1/2 predict chemotherapy resistance in hereditary ovarian carcinomas. Journal of clinical oncology : official journal of the American Society of Clinical Oncology. 2011;29:3008–3015. doi: 10.1200/JCO.2010.34.2980. [DOI] [PMC free article] [PubMed] [Google Scholar]
- Orthwein A, Noordermeer SM, Wilson MD, Landry S, Enchev RI, Sherker A, Munro M, Pinder J, Salsman J, Dellaire G, et al. A mechanism for the suppression of homologous recombination in G1 cells. Nature. 2015;528:422–426. doi: 10.1038/nature16142. [DOI] [PMC free article] [PubMed] [Google Scholar] [Retracted]
- Peng G, Chun-Jen Lin C, Mo W, Dai H, Park YY, Kim SM, Peng Y, Mo Q, Siwko S, Hu R, et al. Genome-wide transcriptome profiling of homologous recombination DNA repair. Nature communications. 2014;5:3361. doi: 10.1038/ncomms4361. [DOI] [PMC free article] [PubMed] [Google Scholar]
- Polato F, Callen E, Wong N, Faryabi R, Bunting S, Chen HT, Kozak M, Kruhlak MJ, Reczek CR, Lee WH, et al. CtIP-mediated resection is essential for viability and can operate independently of BRCA1. The Journal of experimental medicine. 2014;211:1027–1036. doi: 10.1084/jem.20131939. [DOI] [PMC free article] [PubMed] [Google Scholar]
- Puissant A, Frumm SM, Alexe G, Bassil CF, Qi J, Chanthery YH, Nekritz EA, Zeid R, Gustafson WC, Greninger P, et al. Targeting MYCN in neuroblastoma by BET bromodomain inhibition. Cancer Discov. 2013;3:308–323. doi: 10.1158/2159-8290.CD-12-0418. [DOI] [PMC free article] [PubMed] [Google Scholar]
- Ray Chaudhuri A, Callen E, Ding X, Gogola E, Duarte AA, Lee JE, Wong N, Lafarga V, Calvo JA, Panzarino NJ, et al. Replication fork stability confers chemoresistance in BRCA-deficient cells. Nature. 2016;535:382–387. doi: 10.1038/nature18325. [DOI] [PMC free article] [PubMed] [Google Scholar]
- Rhyasen GW, Hattersley MM, Yao Y, Dulak A, Wang W, Petteruti P, Dale IL, Boiko S, Cheung T, Zhang J, et al. AZD5153: A Novel Bivalent BET Bromodomain Inhibitor Highly Active against Hematologic Malignancies. Molecular cancer therapeutics. 2016;15:2563–2574. doi: 10.1158/1535-7163.MCT-16-0141. [DOI] [PubMed] [Google Scholar]
- Sartori AA, Lukas C, Coates J, Mistrik M, Fu S, Bartek J, Baer R, Lukas J, Jackson SP. Human CtIP promotes DNA end resection. Nature. 2007;450:509–514. doi: 10.1038/nature06337. [DOI] [PMC free article] [PubMed] [Google Scholar]
- Shu S, Lin CY, He HH, Witwicki RM, Tabassum DP, Roberts JM, Janiszewska M, Huh SJ, Liang Y, Ryan J, et al. Response and resistance to BET bromodomain inhibitors in triple-negative breast cancer. Nature. 2016;529:413–417. doi: 10.1038/nature16508. [DOI] [PMC free article] [PubMed] [Google Scholar]
- Sun C, Fang Y, Yin J, Chen J, Ju Z, Zhang D, Chen X, Vellano CP, Jeong KJ, Ng PK, et al. Rational combination therapy with PARP and MEK inhibitors capitalizes on therapeutic liabilities in RAS mutant cancers. Science translational medicine. 2017;9:392. doi: 10.1126/scitranslmed.aal5148. [DOI] [PMC free article] [PubMed] [Google Scholar]
- Swisher EM, Lin KK, Oza AM, Scott CL, Giordano H, Sun J, Konecny GE, Coleman RL, Tinker AV, O’Malley DM, et al. Rucaparib in relapsed, platinum-sensitive high-grade ovarian carcinoma (ARIEL2 Part 1): an international, multicentre, open-label, phase 2 trial. The Lancet Oncology. 2017;18:75–87. doi: 10.1016/S1470-2045(16)30559-9. [DOI] [PubMed] [Google Scholar]
- Wang J, Ding Q, Fujimori H, Motegi A, Miki Y, Masutani M. Loss of CtIP disturbs homologous recombination repair and sensitizes breast cancer cells to PARP inhibitors. Oncotarget. 2016;7:7701–7714. doi: 10.18632/oncotarget.6715. [DOI] [PMC free article] [PubMed] [Google Scholar]
- Xu G, Chapman JR, Brandsma I, Yuan J, Mistrik M, Bouwman P, Bartkova J, Gogola E, Warmerdam D, Barazas M, et al. REV7 counteracts DNA double-strand break resection and affects PARP inhibition. Nature. 2015;521:541–544. doi: 10.1038/nature14328. [DOI] [PMC free article] [PubMed] [Google Scholar]
- Yang L, Zhang Y, Shan W, Hu Z, Yuan J, Pi J, Wang Y, Fan L, Tang Z, Li C, et al. Repression of BET activity sensitizes homologous recombination-proficient cancers to PARP inhibition. Science translational medicine. 2017;9:400. doi: 10.1126/scitranslmed.aal1645. [DOI] [PMC free article] [PubMed] [Google Scholar]
- Yang Z, Yik JH, Chen R, He N, Jang MK, Ozato K, Zhou Q. Recruitment of P-TEFb for stimulation of transcriptional elongation by the bromodomain protein Brd4. Molecular cell. 2005;19:535–545. doi: 10.1016/j.molcel.2005.06.029. [DOI] [PubMed] [Google Scholar]
- Yeo JE, Lee EH, Hendrickson EA, Sobeck A. CtIP mediates replication fork recovery in a FANCD2-regulated manner. Human molecular genetics. 2014;23:3695–3705. doi: 10.1093/hmg/ddu078. [DOI] [PMC free article] [PubMed] [Google Scholar]
- Yokoyama Y, Zhu H, Lee JH, Kossenkov AV, Wu SY, Wickramasinghe JM, Yin X, Palozola KC, Gardini A, Showe LC, et al. BET Inhibitors Suppress ALDH Activity by Targeting ALDH1A1 Super-Enhancer in Ovarian Cancer. Cancer research. 2016;76:6320–6330. doi: 10.1158/0008-5472.CAN-16-0854. [DOI] [PMC free article] [PubMed] [Google Scholar]
- Yun MH, Hiom K. CtIP-BRCA1 modulates the choice of DNA double-strand-break repair pathway throughout the cell cycle. Nature. 2009;459:460–463. doi: 10.1038/nature07955. [DOI] [PMC free article] [PubMed] [Google Scholar]
- Zhang Z, Ma P, Jing Y, Yan Y, Cai MC, Zhang M, Zhang S, Peng H, Ji ZL, Di W, et al. BET Bromodomain Inhibition as a Therapeutic Strategy in Ovarian Cancer by Downregulating FoxM1. Theranostics. 2016;6:219–230. doi: 10.7150/thno.13178. [DOI] [PMC free article] [PubMed] [Google Scholar]
- Zuber J, Shi J, Wang E, Rappaport AR, Herrmann H, Sison EA, Magoon D, Qi J, Blatt K, Wunderlich M, et al. RNAi screen identifies Brd4 as a therapeutic target in acute myeloid leukaemia. Nature. 2011;478:524–528. doi: 10.1038/nature10334. [DOI] [PMC free article] [PubMed] [Google Scholar]
Associated Data
This section collects any data citations, data availability statements, or supplementary materials included in this article.