Abstract
High-resolution profiles of surface pH and growth along vertically growing maize (Zea mays) primary root tips were determined simultaneously by pH-sensitive microelectrodes and marking experiments. Methodological tests were carried out that proved the reliability of our kinematic growth analysis, while questioning the validity of an alternative technique employed previously. A distal acidic zone around the meristematic region and a proximal one around the elongation zone proper were detected. This pattern as such persisted irrespective of the bulk pH value. The proximal acidic region coincided with maximum relative elemental growth rates (REGR), and both characters reacted in a correlated manner to auxin and cyanide. The distal acidic band was unrelated to growth, but was abolished by cyanide treatment. We conclude that: (a) the pattern of surface pH as such is a regulated feature of growing root tips; (b) the correlation of extracellular pH and growth rate suggests a functional relationship only along proximal portions of the growing root tip; and (c) the distal acidic band is not caused by pH buffering by root cap mucilage, as suggested previously, but rather is controlled by cellular activity.
According to a long-standing suggestion cell wall extensibility and thus growth is partly under the control of apoplast pH (Hager et al., 1971). Growth rates and cell wall pH are correlated in shoot organs (Cleland, 1992; Peters et al., 1998), and a molecular mechanism for acid growth has been described (Cosgrove, 1997). Growth depends on extracellular pH also in roots (Edwards and Scott, 1974; Evans, 1976; but see Büntemeyer et al., 1998); both parameters change in a correlated manner during auxin-dependent growth inhibition (Evans et al., 1980; Mulkey et al., 1982) and during growth enhancement induced by fusicoccin (McBride and Evans, 1977) and anti-auxins (Moloney et al., 1981).
It has been established since the pioneering work of Hales (1727) that plant organ growth is restricted to defined regions, which today are described in terms of relative elemental growth rate (REGR) profiles (Silk, 1984). Therefore, attempts to identify and analyze growth-relevant parameters without characterization of their spatial patterns will remain inadequate (Spollen and Sharp, 1991). Despite the small size of their growing zone, primary roots of various Poaceae have proven suitable for studying the regulation of spatial growth patterns (Erickson and Sax, 1956; Pahlavanian and Silk, 1988; Sharp et al., 1988; Pritchard et al., 1993). In the case of cell wall pH, however, reports are contradictory:
The correlation of maximum intensity of elongation growth with acidic zones (Pilet et al., 1983; Zieschang et al., 1993) and with more alkaline zones (Weisenseel et al., 1979; O'Neill and Scott, 1983) on the root surface has been postulated. This ambiguity likely stems from methodological deficiencies. Sentenac and Grignon (1987) demonstrated that root surface pH might differ substantially from the pH in the bathing solution. Therefore, the reaction of a pH indicator in the growth medium (e.g. Weisenseel et al., 1979; O'Neill and Scott, 1983) does not necessarily reflect the pH in or near the cell wall. Second, spatial growth patterns are usually determined by marking experiments. Such experiments require observance of strict methodological rules (Silk and Erickson, 1979; Silk, 1984). Not all of the growth data published in the field appear sound. For example, Pilet et al. (1983) claimed that longitudinal profiles of rates of elongation growth correlated with surface acidity in maize (Zea mays) roots. But this conclusion was based on elongation measured over a period of not less than 6 h, which demonstrably causes unacceptable systematic errors (Peters and Bernstein, 1997). Third, roots may change their spatial growth patterns rapidly, as exemplified by the geotropic reaction (Ishikawa et al., 1991). Conclusions regarding the correlation of spatial growth patterns with putative growth controlling factors therefore will remain problematic if both parameters are not measured simultaneously at high spatial and temporal resolution.
In the present study, we sought to resolve these problems by simultaneous high-resolution measurements of root surface pH by means of pH-sensitive microelectrodes and methodologically sound REGR profile determination.
MATERIALS AND METHODS
Plant Material
Seeds of maize (Zea mays L. cv Helix) were sterilized (70% [v/v] ethanol for 2 min, 150 mm NaOCl for 30 min), incubated in distilled water for 6 h, and then allowed to germinate on moist filter paper. After 2 d, seedlings were transferred to hydroponics (constantly aerated solution containing KNO3, NaCl, and CaCl2, 1 mm each). On d 4, when the elongation velocity of primary roots had become constant at 2.5 mm h−1, seedlings with roots 5 to 7 cm long were selected for experiments.
Fabrication of Electrodes
pH-sensitive microelectrodes were produced as described previously (Felle and Bertl, 1986; Felle, 1998). For extracellular use in the present setup, long-shafted (9 cm) electrodes with 20-μm tip diameters were pulled and bent at a right-angle 1 cm behind the tip using the heating coil of the pipette puller. Tips were silanized (0.2% [v/v] tributylchlorosilane in chloroform) and back-filled using a flexible fused silica capillary (TSP-100170, 0.16-mm o.d., Composite Metal Services, Worcester, UK) with a pH-sensitive cocktail (Hydrogenionophor II Cocktail A, Fluka, Milwaukee, WI) dissolved at a ratio of 30:70 (v/v) in a mixture of 40 mg of polyvinylchloride/1 mL tetrahydrofuran. After evaporation of the tetrahydrofuran, the electrodes were filled with reference solution (0.5 m KCl and 0.1 m MES/Tris adjusted to pH 6.0). Electrodes yielding more than 55 mV per pH unit were selected and could be used for up to 4 weeks. pH-sensitive electrodes were calibrated before and after each experiment. Electrodes for the measurement of surface electrical potential had narrower tips (5 μm) and were filled with 0.5 m KCl.
Experimental Setup
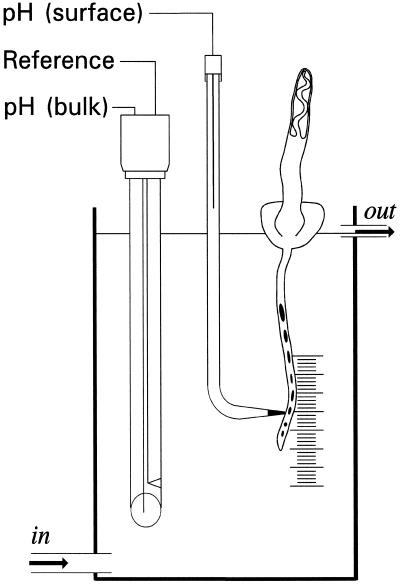
Seedlings were mounted upright in a plexiglass chamber (38-mL volume) with the primary root growing downward into a medium containing KNO3, NaCl, and CaCl2 at 1 mm each, and additional auxin or KCN when required. The solutions were adjusted to the desired pH by 0.5 mm MES/Tris or HCl. The chamber, which could be perfused at controlled flux rates, was fixed in a horizontal microscope so that root growth could be determined using eyepiece graticules and a scale on the back wall of the chamber. Following transfer to the chamber, root elongation velocity usually dropped, but recovered during the following hour. Plants in which root elongation velocity did not reach at least 1.5 mm h−1 within this period were discarded. A semi-micro laboratory pH electrode (Mettler Toledo Inlab 423, Giessen, Germany) monitored bulk medium pH. Its reference cell was also used as a reference for either a pH-sensitive microelectrode or an electrical potential microelectrode fitted to a micromanipulator, by which the vertically growing root was approached from the side (Fig. 1). The latter electrodes were connected to a high-impedance amplifier (M 707, WP Instruments, Sarasota, FL), and the output fed to a multichannel chart recorder (W+W 314, Kontron, Eching, Germany).
Figure 1.
Sketch of the experimental setup. A maize seedling was fixed on top of the test chamber so that the primary root grew downward into a solution flowing through the chamber at an adjustable velocity. A semi-micro laboratory pH electrode measured bulk pH continuously, and its reference cell also gave the reference signal for a modified pH-sensitive micro-electrode mounted on a micromanipulator by which the vertically growing root was approached from the side. The chamber was fixed upright in a horizontal microscope, allowing control of the distance between pH-selective micro-electrode and the root surface, as well as measurement of distances between ink marks on the root. Whole root length could be measured using a scale at the back of the chamber.
Continuous monitoring of the signals from both the conventional pH electrode and the pH-sensitive microelectrode facilitated identification of electrode drift in the latter. Profiles of surface pH and surface potential along the root tip were measured in steps of 430 μm. Surface potentials ranged between 0.1 and 1.8 mV, which will cause errors in the interpretation of the signal from a pH-sensitive electrode of 0.03 pH units in the worst case. This artifact is negligible compared with pH gradients occurring along roots (see below). Signals from single-barreled pH-sensitive electrodes therefore represent valid measurements of the actual pH under the conditions chosen.
Simultaneous Determination of Surface pH and REGR
Marks were made with Indian ink about 0.8 mm apart on root tips before transfer to the experimental setup; marking and transfer required less than 4 min. After 1 h, when root elongation velocity had recovered, the whole root length was measured. A continuous series of segment lengths was determined, with segments defined as the distance between the proximal edges of two consecutive ink marks. A second series was determined independently using the distal edges of the marks to define segments. Segment lengths were determined to the nearest 10 μm. A surface pH profile was measured as described above, and then segment lengths and whole root length were determined again. The period between the two sets of length measurements was 54 min on average. Relative growth rates (R, here referring to elongation growth only) of all segments in the two series were calculated according to:
 |
where L0 and Lt denote the lengths of an individual segment measured before and after pH profile determination, respectively, and Δt the period between the measurements (Green, 1976). Segmental relative growth rates were plotted against the average segment midpoints to yield estimates of REGR profiles (Peters and Bernstein, 1997), which could then be compared with pH profiles measured simultaneously.
Two checks for accuracy of individual REGR profiles were routinely applied. First, since two continuous series of segmental relative growth rates were obtained from each root, errors in data acquisition could be expected to appear as differences between the two REGR profiles derived from the two data sets. Cases in which such deviations occurred were rejected. Second, polynomials were fitted to the REGR data, and root elongation velocity was computed as the integral of the fitted functions. The computed elongation velocity was compared with the velocity determined independently from changes in whole root length during the experiment. If the values differed by more than 16% (the maximum error of direct elongation velocity determination expressed as a percentage of average elongation velocity), the experiment was discarded.
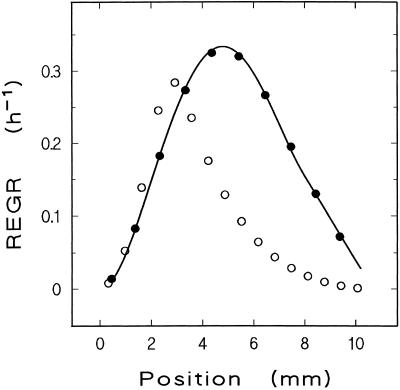
A methodological test for accuracy of our growth analysis was based on theoretical growth data generated by a model REGR profile. For an elaboration of the rationale behind this approach and a more detailed discussion of mathematical principles, see Peters and Bernstein (1997) and Peters et al. (1999). In the present case, a composite polynomial (4th order for position 0.5–8 mm, 1st order for position 8–10.5 mm, with identical values of derivatives at 8 mm) was fitted to a representative set of segmental relative growth rate data (Fig. 2). The composite function served as a model REGR profile, which by integration was turned into the displacement velocity profile. The reciprocal displacement velocity function was integrated to yield the trajectory function, i.e. the path of root elements in a plot of time versus position. This function allowed calculation of segment length changes under conditions chosen for a particular experimental situation. Systematic errors inherent in a particular method of REGR profile determination were then disclosed by applying this method to the growth data created by the model and comparing the resulting REGR profile to the original model. Applied to the artificial data, our method of REGR determination yields results lacking any evidence for significant systematic error (Fig. 2), indicating excellent reliability of the method under the experimental conditions chosen. For comparison, an identical test was performed using an alternative method (Pilet et al., 1983), which proved less reliable (Fig. 2; see legend for experimental details).
Figure 2.
Methodological test for reliability of REGR profile determination. The test is based on a known REGR profile, from which segment length changes in theoretical marking experiments are computed. From these data, derived REGR profiles are determined by application of the method that is to be tested for reliability. Deviations of the derived profile from the known one indicate systematic errors induced by the method under consideration. The graph gives the known REGR profile as a bold line. Two derived profiles are marked by circles; each symbol represents the relative growth rate of a root segment. In one case, data were created for experimental conditions prevailing in the present study and processed by our method (●; initial segment length 0.9 mm, time between measurements 54 min, segmental relative growth rate plotted versus average segment position), and the agreement with the original profile was excellent. In a second case, alternative experimental conditions and analytical methods as used in a previous study (Pilet et al., 1983) were modeled (○; initial segment length 0.65 mm, time between measurements 6 h, segmental relative growth rate plotted versus initial segment position), resulting in significant distortion of the original profile. The REGR peak is shifted apically by almost 2 mm, the growing zone appears shortened, and the velocity of root elongation (which equals the area under an REGR profile) is reduced by 47%. See text for more details.
A particular strength of our method of combined pH/REGR profile determination is that changes in local growth in tensity and surface pH can be described on the level of the individual plant. Therefore, we present results as representative cases instead of averages. However, a sense of the variance of primary data can be derived by comparing Figures 6A, 7A, and 8A.
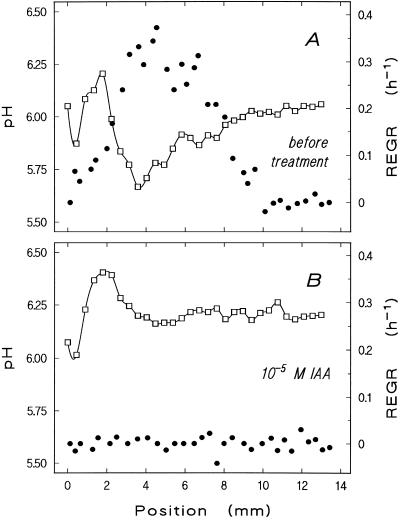
Figure 6.
Correlated response of growth and surface pH to indole-acetic acid (IAA). Profiles of surface pH (□) and REGR (●) were measured simultaneously on a root growing initially at 2.0 mm h−1 in stagnant pH 6.75 medium before (A) and after (B) the addition of 10−5 m IAA (measurement started 20 min after the addition of the hormone). The proximal acidic zone correlates well with the position of maximum REGR; both features vanish in the presence of IAA. The distal acidic zone remains practically unaffected. The experiment was repeated four times on different roots with similar results.
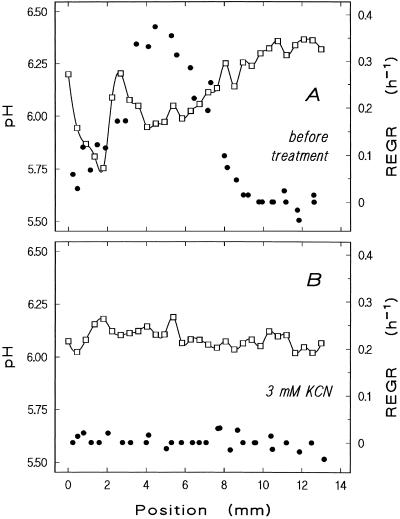
Figure 7.
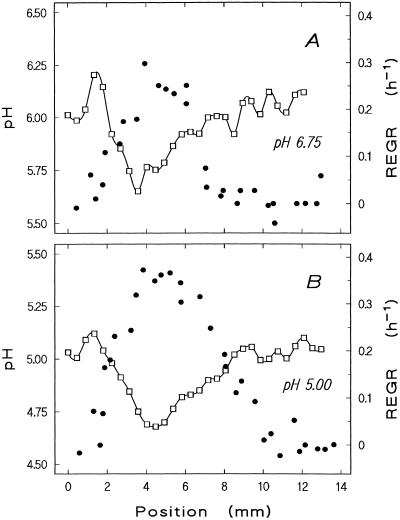
Effect of cyanide on growth and surface pH. Surface pH (□) and REGR (●) profiles were measured simultaneously on a root growing initially at 1.9 mm h−1 in stagnant medium at pH 6.75 before (A) and after (B) the addition of 3 mm KCN (measurement started 5 min after the addition of the toxin). This particular root is one of the few individuals in which lower pH values prevailed in the distal acidic zone than in the proximal zone (A). Both distal and proximal acidic zones are abolished by the respiration inhibitor, but surface pH along the root tip remained more than 0.5 units below medium pH in its presence. Similar results were obtained in two repetitions of this experiment with different roots.
Figure 8.
Response of growth and surface pH to medium acidification in a slowly growing root. Profiles of surface pH (□) and REGR (●) were determined on a root growing at 1.4 mm h−1 in stagnant pH 6.75 medium (A) and after medium acidification to pH 5.0 had induced an elongation velocity of 2.1 mm h−1 (B) (measurement started 15 min after the pH decrease). For the proper understanding of the figure it should be remembered that the velocity of elongation equals the integral of the REGR profile, i.e. the area under the curve described by the REGR data (●). Note different scaling of ordinates in A and B.
RESULTS
Root Surface pH and Its Relationship to Apoplast pH
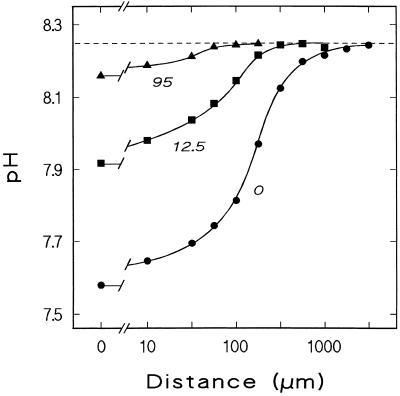
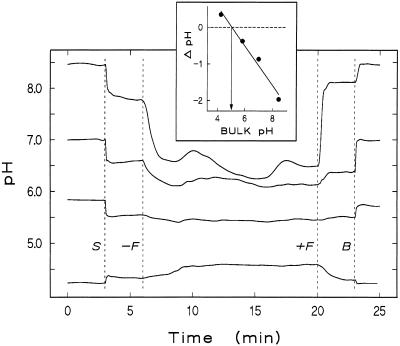
When a root incubated at a pH higher than 5.0 is approached by a pH-sensitive microelectrode at a position just proximal of the growing zone (12 mm above the apex), the pH drops before the electrode tip touches the outermost cell wall. The relationship between proton concentration and distance from the root surface is sigmoidal in a double-logarithmic plot (Fig. 3). As expected, the steepness of this gradient around the root changes with medium flux velocity, an effect due mainly to flux-dependent changes of surface pH. When medium flux is stopped, the surface pH drops to new stable values if the bulk pH is higher than approximately 5.0 (Fig. 4). Conversely, at bulk pH lower than 5.0, the surface pH rises to new stable values after stopping medium flux. Therefore, if the difference between surface pH as measured in stagnant medium and bulk pH is plotted versus bulk pH, a curve results that allows the determination of a bulk pH value at which no difference exists between surface pH and bulk pH (Fig. 4, inset).
Figure 3.
Dependence of pH on the log of perpendicular distance from the root surface measured 12 mm above the root tip. The chamber was perfused with pH 8.25 medium at a flow velocity along the root of 0, 12.5, and 95 mm min−1, as indicated. Data points are means of three measurements each, all performed on the same root; sd was less than 0.026 in all cases. Repetition on different roots and at different bulk pH yielded similar results. Note that not only the steepness of the pH gradient perpendicular to the root surface, but also the surface pH depends on flow velocity.
Figure 4.
Dependence of root surface pH on bulk pH. Original tracks from consecutive experiments at different bulk pH values (8.45, 7.00, 5.80, and 4.20) obtained from one root are shown. All tracks start with the pH-sensitive micro-electrode positioned in the bulk solution at 2-mm distance from the root surface, with the medium flowing through the chamber with a bulk velocity of 10 mm min−1. At 3 min the electrode tip was advanced until it made contact with the root surface at a position 12 mm above the apex (S), leading to a sudden change in the pH signal. At 6 min medium flux was turned off (−F), causing a further change in pH. After the signal had become stable, the flux was turned on again (+F), and the electrode tip was retracted to the initial position (B), which resulted in a reversal of the pH changes. Note that if bulk pH is below a critical value, shifts in the pH measured after electrode positioning and flux stop occur in the opposite direction. The inset shows the difference between bulk pH and stable surface pH at zero flux velocity (ΔpH) plotted versus bulk pH. The critical bulk pH (surface pH = bulk pH) can be derived to be 5.05. The experiment was repeated four times on different roots with similar results.
Surface pH seems to form part of a continuous pH gradient between the inner cortex apoplast and the bulk solution. The fact that increasing buffer concentrations affect surface pH in a similar manner as increasing flux velocities (not shown) supports this conclusion. Although the inner tissue apoplast solution pH cannot be equated with surface pH, its value can be estimated, since a bulk pH can be found at which bulk and surface pH are equal (pH 5.05 in the example shown in Fig. 4, inset). At this critical value the gradient of proton concentration has zero slope, indicating diffusive equilibrium of apoplast and bulk pH.
Longitudinal Gradients of Surface pH
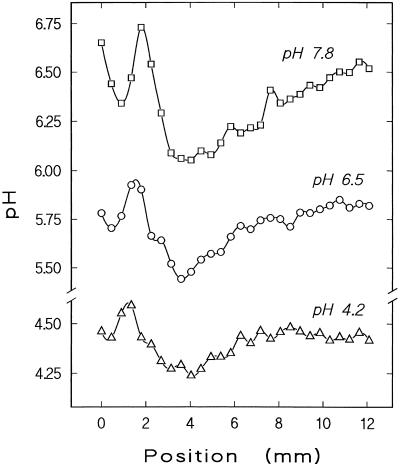
Stepwise measurements of surface pH reveal characteristic patterns along the growing root tip, consisting of a short acidic region near the meristem and a longer one in the elongation zone, separated by a pH maximum 1 to 2 mm below the meristem apex (Fig. 5). Overall, minimal pH values were found in the proximal acidic zone in most individual plants, but in some plants (four out of a total of 36) the lowest pH occurred in the distal acidic zone (see example given in Fig. 7A). The pattern as a whole is shifted along the pH scale by changes in bulk pH in a similar way as described above for pH values measured at a given position (compare Fig. 4). The complete profile of surface pH can be more acidic, intermediate, or more alkaline than the bulk pH. Thus, the longitudinal pH pattern as such does not depend on the orientation of the pH gradient normal to the root surface.
Figure 5.
Profiles of surface pH along the apical 12 mm of one growing root (position 0 refers to the tip of the root cap) measured consecutively in stagnant media at pH 7.8, 6.5, and 4.2, as indicated. A distal acidic region around the meristematic zone (between about position 0–1.5 mm) can be distinguished from a proximal acidic zone along the elongation zone proper (about 2.5–8 mm). The pattern as such is independent of bulk pH, although the pH range covered by one profile tends to decrease with decreasing bulk pH. Note that the complete profile of surface pH is more alkaline than the bulk at medium pH 4.2. Similar results were obtained from four repetitions with different plants.
Correlation of Surface pH and REGR
The existence of a pronounced acidic zone at 4 to 5 mm above the meristem apex suggests a relation to elongation growth, which in maize is known to peak at just that position. Simultaneous measurements reveal good spatial correlation between the proximal pH minimum and the maximum elongation growth intensity (examples of three roots shown in Figs. 6A, 7A, and 8A). To test the idea of a causal relationship between these parameters, their response to exogenous stimuli was investigated. The maxima in surface acidity and growth intensity along the elongation zone are both eliminated by high concentrations of auxin (10−5 m; Fig. 6), and both are reduced by lower concentrations (10−7 m; not shown). When cellular energetics are disturbed by cyanide, growth ceases and the surface pH pattern breaks down concomitantly (Fig. 7). In individual plants with low endogenous root elongation velocity, shifting the bulk pH from neutral to acidic increases REGR and decreases surface pH along the growing zone (Fig. 8). However, we failed to demonstrate this effect unequivocally in fast-growing roots (elongation velocity >1.6 mm h−1).
In contrast to the proximal acidic zone, the distal zone near the meristem did not correlate with local elongation rates (Figs. 6A, 7A, and 8A) and was insensitive to auxin (Fig. 6). It might be assumed that this acidic region is caused by buffering effects of the root cap mucilage, but gentle removal of the calyptra before the experiments did not prevent the occurrence of the acidic region around the meristematic zone (not shown). Moreover, the cyanide sensitivity of the distal acidic zone (Fig. 7; an individual in which this distal acidic zone was more acidic than the proximal one is shown) indicates its dependence on oxidative phosphorylation.
DISCUSSION
Significance of Surface pH
In a previous study on extracellular pH regulation in maize root tips (Felle, 1998), two conclusions were drawn that bear on the present study: (a) the root cortex is able to control its surface pH despite considerable variation in the incubation medium pH; and (b) a complex pH pattern exists along the root tip, consisting of two acidic regions separated by a zone of higher pH. In the present study the experimental setup was modified to facilitate the simultaneous measurement of spatial growth profiles and surface pH gradients; the manipulation required for transferring whole plants into the setup was minimized, and roots grew vertically instead of horizontally. Because apoplast pH (Taylor et al., 1996), surface pH gradients (Collings et al., 1992), and membrane potential (Behrens et al., 1985; Ishikawa and Evans, 1990) react rapidly to geotropic stimulation in roots, it became necessary to verify our previous interpretations under the changed circumstances.
The present data show that the earlier conclusions hold under the modified conditions. Maize root tips create a radial pH gradient in the surrounding medium, the slope of which depends on the perfusion rate (Fig. 3) and the bulk pH of the medium (Fig. 4). In addition, a complex longitudinal gradient exists that is shifted along the pH scale by changes in bulk pH (Fig. 5). We conclude that root surface pH forms part of a continuous pH gradient between the inner apoplast and the bulk medium. Comparison of surface pH profiles at different bulk pH values (Fig. 5, interpreted in analogy to Fig. 4, inset) tempts us to hypothesize that a bimodal longitudinal pH profile with two acidic maxima exists in the subepidermal cortex apoplast, which ranges from minimum pH values of about 4.5 at 4 to 5 mm behind the apex to pH 5.2 at the proximal end of the elongation zone. These figures are in agreement with direct measurements presented previously (Felle, 1998).
Our surface pH profiles (Fig. 5) are similar to those reported for root tips of Phleum pratense L. (Zieschang et al., 1993; Monshausen et al., 1996). There surface pH profiles were determined at an intermediate bulk pH, i.e. the two acidic bands were more acidic than the medium, while the pH maximum between them was slightly more alkaline than the medium. The pH gradients normal to the root surface were interpreted as indicative of proton fluxes: The acidic region in the elongation zone was thought to correspond to a current efflux zone, while the pH maximum was identified with a region of current influx. This interpretation rendered the pH profiles consistent with the hypothesis that the natural currents traversing growing root tips (Weisenseel et al., 1979; Miller et al., 1988; Meyer and Weisenseel, 1997; Taylor and Bloom, 1998) are carried mainly by protons. Our finding that the complete surface pH profile can be more alkaline or more acidic than bulk pH (Fig. 5) is difficult to reconcile with this interpretation. A systematic investigation into the dependence of longitudinal and radial pH gradients and electrical currents on bulk medium pH is clearly needed.
Acid Growth in Roots?
The consistent shape of the extracellular pH profile suggests tight regulation and hence physiological significance. What springs to mind is an involvement in the control of elongation growth. Frequently, the possibility of an acid-growth mechanism in roots was evaluated by scrutinizing the relationship between root elongation growth and bulk medium pH. However, pH on the root surface differs from medium pH depending not only on the latter's actual value (Fig. 4), but also on medium flow velocity (Fig. 3), buffer capacitance (not shown), and time, if the medium is stagnant (Felle, 1998). Moreover, the relationship of surface pH and apoplast pH in the inner cortex layers, which probably limit elongation growth (Pritchard, 1994), is unclear. Therefore, any dependence of growth on bulk pH in a particular experimental setting is hard to interpret, even if the additional complication of longitudinal gradients of growth and cell wall pH is disregarded. It is therefore not surprising that this type of experiment provided controversial evidence (Edwards and Scott, 1974; Büntemeyer et al., 1998).
The correlation between spatial patterns of growth and extracellular pH offers a promising alternative to test the putative causal connection. Such a relationship was implied by Pilet et al. (1983). However, the method by which growth rate profiles were determined in that work is problematic, as discussed below. Moreover, the technique of pH measurement used did not fully resolve the complexity of the longitudinal pH gradient. Our simultaneous measurements of gradients of surface pH and growth intensity (Figs. 6, 7, and 8) demonstrate a coincidence of spatial patterns only along a certain portion of the root tip, namely proximal of a position 2 to 3 mm above the meristem apex. Since surface pH depends on experimental conditions, as discussed above, an elucidation of the nature of this coincidence cannot be expected from comparisons of numerical values of growth rates and pH. The correlated response of the spatial patterns to exogenous stimuli (Figs. 5 and 6) provides more convincing evidence for a functional relationship. The nature of this putative causality cannot be inferred from our data alone.
The fact that higher growth rates can be induced by lowering medium pH only in slowly growing individuals (as shown in Fig. 8) suggests that cell wall pH contributes to growth control, but that additional factors may overrule its influence. The conclusion is supported by the existence of a distal acidic zone unrelated to longitudinal growth. Its sensitivity to cyanide indicates that this acidic zone is not due to pH buffering by root cap mucilage (compare with Zieschang et al., 1993). Baluška et al. (1994) proposed that a peak of growth intensity in the radial direction exists near root meristems, which would coincide spatially with the distal maximum in surface acidity. However, the validity of the analysis suggesting the existence of a radial growth rate peak is disputed (Baskin and Beemster, 1997), and neither a recently published study (Liang et al., 1997) nor our own calculations (not shown) provide supporting evidence.
Validity of Growth Analysis
The methodological accuracy of REGR profile determination, which is critical for the validity of conclusions in studies like the present one, has to be demonstrated. Following our previous argumentation (Peters and Bernstein, 1997), we computed segmental growth data from a known (i.e. theoretical) REGR profile and applied our method of REGR profile determination to these data. Any deviation of the resulting derived profile from the original one must be attributed to errors inherent to the profile determination method used. The reliability of our method of REGR profile determination was proven in this test (Fig. 2 and “Materials and Methods”).
In the most elaborate previous study on this topic, Pilet et al. (1983) concluded that pH and local growth rates correlate along maize roots. However, the long duration of the growth tests in this study prevents sound conclusions (Silk, 1984; Peters and Bernstein, 1997). We repeated the methodological test under the experimental conditions of the previous study. A significantly distorted profile resulted (Fig. 2). Benefiting from hindsight, we feel that Pilet et al. (1983) were lucky in reaching a correct conclusion, probably because errors in growth analysis and poor resolution of pH measurements cancelled each other out. If they had combined their growth analysis with a high-resolution surface pH detection (like the one used in the present study), their data would not have indicated a correlation between maximum growth intensity and minimum pH. Rather, it would have appeared that the REGR peak was localized intermediately between the two pH extremes.
This case exemplifies the problems caused by insufficient accuracy of spatial growth analysis regarding both data acquisition and processing. Methodological tests like the ones performed here should become a matter of routine in similar studies to ensure the validity of conclusions regarding the physiology of growth control.
ACKNOWLEDGMENT
This contribution is dedicated to the memory of Paul B. Green (1931–1998) whose works on growth kinematics inspired the approach here pursued.
Footnotes
This work was supported by the Deutsche Forschungsgemeinschaft (project no. 717).
LITERATURE CITED
- Baluška F, Barlow PW, Kubica Š. Importance of the post-mitotic isodiametric growth (PIG) region for growth and development of roots. Plant Soil. 1994;167:31–41. [Google Scholar]
- Baskin TI, Beemster TS. On the post-mitotic isodiametric growth zone in roots. In: Flores HE, Lynch JP, Eissenstat D, editors. Radical Biology: Advances and Perspectives on the Function of Plant Roots. Rockville, MD: American Society of Plant Physiologists; 1997. pp. 23–33. [Google Scholar]
- Behrens HM, Gradmann D, Sievers A. Membrane-potential responses following gravistimulation in roots of Lepidium sativum L. Planta. 1985;163:463–472. doi: 10.1007/BF00392703. [DOI] [PubMed] [Google Scholar]
- Büntemeyer K, Lüthen H, Böttger M. Auxin-induced changes in cell wall extensibility of maize roots. Planta. 1998;204:515–519. [Google Scholar]
- Cleland RE. Auxin-induced growth of Avena coleoptiles involves two mechanisms of different pH optima. Plant Physiol. 1992;99:1556–1561. doi: 10.1104/pp.99.4.1556. [DOI] [PMC free article] [PubMed] [Google Scholar]
- Collings DA, White RG, Overall RL. Ionic current changes associated with the gravity-induced bending response in roots of Zea mays L. Plant Physiol. 1992;100:1417–1426. doi: 10.1104/pp.100.3.1417. [DOI] [PMC free article] [PubMed] [Google Scholar]
- Cosgrove DJ. Assembly and enlargement of the primary cell wall in plants. Annu Rev Cell Dev Biol. 1997;13:171–201. doi: 10.1146/annurev.cellbio.13.1.171. [DOI] [PubMed] [Google Scholar]
- Edwards KL, Scott TK. Rapid growth responses of corn root segments: effect of pH on elongation. Planta. 1974;119:27–37. doi: 10.1007/BF00390819. [DOI] [PubMed] [Google Scholar]
- Erickson RO, Sax KB. Elemental growth rates of the primary roots of Zea mays. Proc Am Phil Soc. 1956;100:487–498. [Google Scholar]
- Evans ML. A new sensitive root auxanometer. Plant Physiol. 1976;58:599–601. doi: 10.1104/pp.58.4.599. [DOI] [PMC free article] [PubMed] [Google Scholar]
- Evans ML, Mulkey TJ, Vesper MJ. Auxin action on proton influx in corn roots and its correlation with growth. Planta. 1980;148:510–512. doi: 10.1007/BF00552667. [DOI] [PubMed] [Google Scholar]
- Felle H. The apoplastic pH of the Zea mays root cortex as measured with pH-sensitive microelectrodes: aspects of regulation. J Exp Bot. 1998;49:987–995. [Google Scholar]
- Felle H, Bertl A. The fabrication of H+-selective liquid-membrane micro-electrodes for use in plant cells. J Exp Bot. 1986;37:1416–1428. [Google Scholar]
- Green PB. Growth and cell pattern formation on an axis: critique of concepts, terminology, and modes of study. Bot Gaz. 1976;137:187–202. [Google Scholar]
- Hager A, Menzel H, Krauss A. Versuche und Hypothese zur Primärwirkung des Auxins beim Streckungswachstum. Planta. 1971;100:47–75. doi: 10.1007/BF00386886. [DOI] [PubMed] [Google Scholar]
- Hales S. Vegetable Staticks. W. and J. London: Innys; 1727. ; reprint (1961) Beaverbrook Newspapers Ltd., London. [Google Scholar]
- Ishikawa H, Evans ML. Gravity-induced changes in intracellular potentials in elongating cortical cells of mung bean roots. Plant Cell Physiol. 1990;31:457–462. [PubMed] [Google Scholar]
- Ishikawa H, Hasenstein KH, Evans ML. Computer-based video digitizer analysis of surface extension in maize roots. Planta. 1991;183:381–390. doi: 10.1007/BF00197737. [DOI] [PubMed] [Google Scholar]
- Liang BM, Sharp RE, Baskin TI. Regulation of growth anisotropy in well-watered and water-stressed maize roots. I. Spatial distribution of longitudinal, radial, and tangential expansion rates. Plant Physiol. 1997;115:101–111. doi: 10.1104/pp.115.1.101. [DOI] [PMC free article] [PubMed] [Google Scholar]
- McBride R, Evans ML. Auxin inhibition of acid- and fusicoccin-induced elongation in lentil roots. Planta. 1977;136:97–102. doi: 10.1007/BF00396184. [DOI] [PubMed] [Google Scholar]
- Meyer AI, Weisenseel MH. Wound-induced changes of membrane voltage, endogenous currents, and ion fluxes in primary roots of maize. Plant Physiol. 1997;114:989–998. doi: 10.1104/pp.114.3.989. [DOI] [PMC free article] [PubMed] [Google Scholar]
- Miller AL, Shand E, Gow NAR. Ion currents associated with root tips, emerging laterals and induced wound sites in Nicotiana tabacum: spatial relationship proposed between resulting electrical fields and phytophtoran zoospore infection. Plant Cell Environ. 1988;11:21–25. [Google Scholar]
- Moloney MM, Elliott MC, Cleland RE. Acid growth effects in maize roots: evidence for a link between auxin-economy and proton extrusion in the control of root growth. Planta. 1981;152:285–291. doi: 10.1007/BF00388251. [DOI] [PubMed] [Google Scholar]
- Monshausen GB, Zieschang HE, Sievers A. Differential proton secretion in the apical elongation zone caused by gravistimulation is induced by a signal from the root cap. Plant Cell Environ. 1996;19:1408–1414. doi: 10.1111/j.1365-3040.1996.tb00019.x. [DOI] [PubMed] [Google Scholar]
- Mulkey TJ, Kuzmanoff KM, Evans ML. Promotion of growth and hydrogen ion efflux by auxin in roots of maize pretreated with ethylene biosynthesis inhibitors. Plant Physiol. 1982;70:186–188. doi: 10.1104/pp.70.1.186. [DOI] [PMC free article] [PubMed] [Google Scholar]
- O'Neill RA, Scott TK. Proton flux and elongation in primary roots of barley (Hordeum vulgare L.) Plant Physiol. 1983;73:199–201. doi: 10.1104/pp.73.1.199. [DOI] [PMC free article] [PubMed] [Google Scholar]
- Pahlavanian AM, Silk WK. Effect of temperature on spatial and temporal aspects of growth in the primary maize root. Plant Physiol. 1988;87:529–532. doi: 10.1104/pp.87.2.529. [DOI] [PMC free article] [PubMed] [Google Scholar]
- Peters WS, Bernstein N. The determination of relative elemental growth rate profiles from segmental growth rates. Plant Physiol. 1997;113:1395–1404. doi: 10.1104/pp.113.4.1395. [DOI] [PMC free article] [PubMed] [Google Scholar]
- Peters WS, Fricke W, Chandler PM. XET-related genes and growth kinematics in barley leaves. Plant Cell Environ. 1999;22:331–332. [Google Scholar]
- Peters WS, Lüthen H, Böttger M, Felle H. The temporal correlation of changes in apoplast pH and growth rate in maize coleoptiles. Aust J Plant Physiol. 1998;25:21–25. [Google Scholar]
- Pilet PE, Versel JM, Mayor G. Growth distribution and surface pH patterns along maize roots. Planta. 1983;158:398–402. doi: 10.1007/BF00397731. [DOI] [PubMed] [Google Scholar]
- Pritchard J. The control of cell expansion in roots. New Phytol. 1994;127:3–26. doi: 10.1111/j.1469-8137.1994.tb04255.x. [DOI] [PubMed] [Google Scholar]
- Pritchard J, Hetherington PR, Fry SC, Tomos AD. Xyloglucan endotransglycosylase activity, microfibril orientation and the profiles of cell wall properties along growing regions of maize roots. J Exp Bot. 1993;44:1281–1289. [Google Scholar]
- Sentenac H, Grignon C. Effect of H+ excretion on the surface pH of corn root cells evaluated by using weak acid influx as a pH probe. Plant Physiol. 1987;84:1367–1372. doi: 10.1104/pp.84.4.1367. [DOI] [PMC free article] [PubMed] [Google Scholar]
- Sharp RE, Silk WK, Hsiao TC. Growth of the maize primary root at low water potentials. I. Spatial distribution of expansive growth. Plant Physiol. 1988;87:50–57. doi: 10.1104/pp.87.1.50. [DOI] [PMC free article] [PubMed] [Google Scholar]
- Silk WK. Quantitative description of development. Annu Rev Plant Physiol. 1984;35:479–518. [Google Scholar]
- Silk WK, Erickson RO. Kinematics of plant growth. J Theor Biol. 1979;76:481–501. doi: 10.1016/0022-5193(79)90014-6. [DOI] [PubMed] [Google Scholar]
- Spollen WG, Sharp RE. Spatial distribution of turgor and root growth at low water potentials. Plant Physiol. 1991;96:438–443. doi: 10.1104/pp.96.2.438. [DOI] [PMC free article] [PubMed] [Google Scholar]
- Taylor AR, Bloom AJ. Ammonium, nitrate, and proton fluxes along the maize root. Plant Cell Environ. 1998;21:1255–1263. [Google Scholar]
- Taylor DP, Slattery J, Leopold AC. Apoplastic pH in corn root gravitropism: a laser scanning confocal microscopy measurement. Physiol Plant. 1996;97:35–38. [PubMed] [Google Scholar]
- Weisenseel MH, Dorn A, Jaffe LF. Natural H+ currents traverse growing roots and root hairs of barley (Hordeum vulgare L.) Plant Physiol. 1979;64:512–518. doi: 10.1104/pp.64.3.512. [DOI] [PMC free article] [PubMed] [Google Scholar]
- Zieschang HE, Köhler K, Sievers A. Changing proton concentrations at the surfaces of gravistimulated Phleum roots. Planta. 1993;190:546–554. [Google Scholar]


