Abstract
The oviduct (or fallopian tube) serves as an environment for gamete transport, fertilization, and preimplantation embryo development in mammals. Although there has been increasing evidence linking infertility with disrupted oviduct function, the specific roles that the oviduct plays in both normal and impaired reproductive processes remain unclear. The mouse is an important mammalian model to study human reproduction. However, most of the current analyses of the mouse oviduct rely on static histology or 2D visualization, and are unable to provide dynamic and volumetric characterization of this organ. The lack of imaging access prevents longitudinal live analysis of the oviduct and its associated reproductive events, limiting the understanding of mechanistic aspects of fertilization and preimplantation pregnancy. To address this limitation, we report a 3D imaging approach that enables prolonged functional assessment of the mouse oviduct in vivo. By combining optical coherence tomography with a dorsal imaging window, this method allows for extended volumetric visualization of the oviduct dynamics, which was previously not achievable. The approach is used for quantitative analysis of oviduct contraction, spatiotemporal characterization of cilia beat frequency, and longitudinal imaging. This new approach is a useful in vivo imaging platform for a variety of live studies in mammalian reproduction.
Optical coherence tomography through a dorsal imaging window allows for prolonged volumetric analysis of oviduct dynamics and function in the mouse in vivo.
Keywords: optical coherence tomography, dorsal imaging window, mouse oviduct, cilia beat frequency, in vivo, smooth muscle contraction, functional imaging, time-resolved 3D imaging
Graphical Abstract
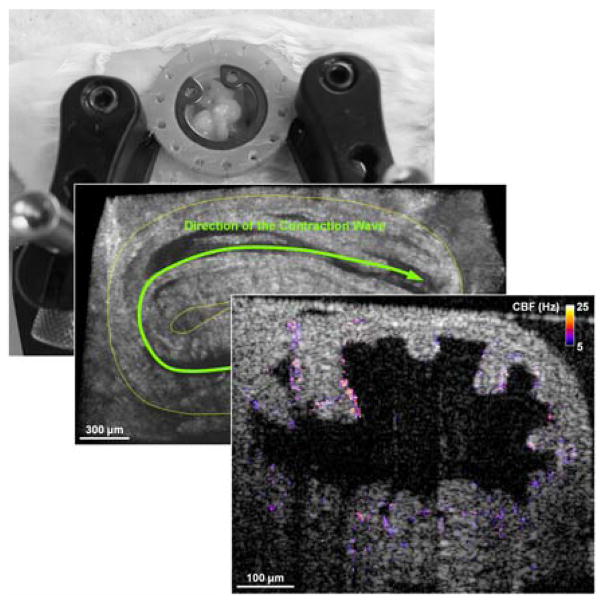
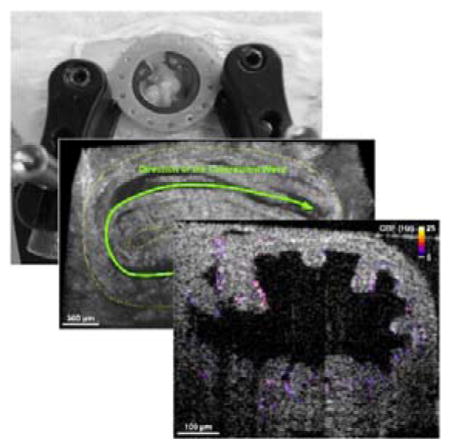
In mammals, a life starts in the oviduct, where a series of reproductive events take place to reach successful pregnancy. It is critical to study the mammalian oviductal function in its native context, which is not possible using existing imaging approaches. Here, we present in vivo optical coherence tomography of the mouse oviduct through a dorsal imaging window, enabling prolonged functional and quantitative assessment that were previously not feasible.
1. Introduction
In mammals, the oviduct (or fallopian tube) connects the ovary with the uterus, and serves as the site for the transport of gametes, the fertilization, and the development of preimplantation embryos. It is well recognized that the normal oviduct function is a prerequisite for successful spontaneous pregnancy; however, the mechanistic role of the oviduct in sensing and regulating the reproductive processes remains unclear [1–3], limiting the further understanding of infertility. Uncovering the regulatory role of the oviduct in reproduction requires integrative analysis of genetic molecular pathways and mechanistic events. On one hand, detailed analyses at the molecular level are required to elucidate the oviductal signaling pathways and to characterize their activities during the reproductive events [4–6]. On the other hand, phenotyping the functional aspects of the oviduct at targeted phases of reproduction in response to genetic or pharmacological manipulations is indispensable for determining the specific roles of these molecular pathways in establishing a successful pregnancy [2, 7]. Recent advancements in molecular and genetic approaches have provided solid tools for molecular analyses. However, due to the lack of proper imaging methods, functional characterization of the mammalian oviduct in vivo is not available [1], acting as a significant hurdle for advanced research in mammalian reproduction.
One of the major oviductal functions is the transfer of gametes and embryos [1, 2]. Smooth muscle contractions, the beating of the luminal epithelial cilia, and flow of secretions are believed to be the drivers of oocyte/embryo transfer within the oviduct [8]. However, their specific roles in these processes remain unclear [1–3]. A number of methods are being used to study the structure and function of the oviduct, though all of them are associated with limitations. Histology has been the gold standard to probe the oviductal structure and molecular composition [9, 10], which is generally not capable of producing functional information. Currently, bright-field microscopy and epifluorescence imaging are the most established methods to examine the functional aspects of cilia beating. However, due to the limited penetration depth of these methods, analyses of epithelial cells usually requires opening up the oviduct lumen [11], which alters the cellular microenvironment and prevents prolonged or longitudinal assessment. Although cell culture techniques were developed to model the oviduct epithelia in vitro [12], allowing for extended imaging time [13], the absence of native and cyclic physiological environment complicates the interpretation of the results. For assessment of the oviduct muscle contraction, the relatively large field of view from the bright-field and epifluorescence imaging is beneficial [14]. Recently, in vivo imaging of the oviduct contraction in the mouse was reported [15]. However, only 2D visualization with a limited imaging depth is available through these approaches. The lack of depth-resolving capabilities leaves it inaccessible to perform the highly-desired 3D quantitative characterization of the oviduct dynamics.
The mouse is an important model to study the biology of mammalian reproduction [16]. Toward live structural and functional imaging of the mouse oviduct, we have recently developed an in vivo approach based on optical coherence tomography (OCT) that allows for volumetric imaging of oviduct structures [17] and spatial mapping of cilia and cilia beat frequency (CBF) [18], both at a micro-scale spatial resolution. OCT is a 3D, high-speed, non-destructive imaging modality that employs near-infrared light and low-coherence interferometry for depth-resolved information over a millimetre-level field of view [19, 20]. The high-resolution structural visualization of the oviduct using OCT provided a new opportunity for volumetric analysis of this complex highly-curled structure, revealing mucosa folding morphology within different regions, which is hard to deduct from 2D sections [17]. The animal manipulations employed in the previous approach involved the exposure of reproductive organs for imaging through dorsal incision, which is routinely used for zygote injection in transgenic mouse production. Although it is an efficient method to probe the oviduct in the living mouse, these methods are not optimal for prolonged and longitudinal study. Exposing the reproductive organs to air limits the time for imaging and affects the environment (temperature and hydration) of the oviduct. Here, we aimed to overcome these limitations by implementation of an intravital imaging window implanted into the body wall of the mouse.
Implantable imaging windows are widely utilized for long-term repetitive access to the internal tissues and physiological processes, which were primarily used with microscopy [21–25]. Recently, a dorsal intravital imaging window was developed for microscopic visualization of the mouse ovary [25]. Here, by combining OCT with a further optimized dorsal imaging window, we report an in vivo imaging approach enabling prolonged functional assessment of the mouse oviduct. Using this method, we performed 3D imaging and quantitative characterization of the oviduct contraction, mapping of the spatiotemporal dynamics of the cilia beating, and longitudinal imaging of the oviduct structure and cilia beat frequency. This in vivo approach opens new avenues for phenotyping of the oviduct morphology and function in the mouse over extended and longitudinal sessions without exogenous labelling.
2. Materials and methods
2.1 OCT system
We employed a home-built spectral domain OCT system. The details of the system can be found in our previous work [26]. Based on a Ti:Sapphire laser source centred at ~810 nm with ~110 nm bandwidth, the OCT system had a ~5 μm axial resolution, as measured from the point spread function. The transverse resolution was characterized as ~4 μm using a test target. A fiber-based Michelson interferometer was utilized for light interference. Two galvanometer-mirrors were used for lateral scanning of the imaging beam over the sample. A spectrometer based on transmission gratings and a CMOS camera was built to resolve the interference fringes, which provided a ~68 kHz A-scan rate with the full 4096 pixels. A sensitivity of ~97 dB was achieved from the system at a 50 μm optical path length difference with a ~4 dB/mm sensitivity drop. The OCT system had a working distance of ~25 mm, providing a convenience for live mouse imaging through the intravital window.
2.2 Dorsal imaging window
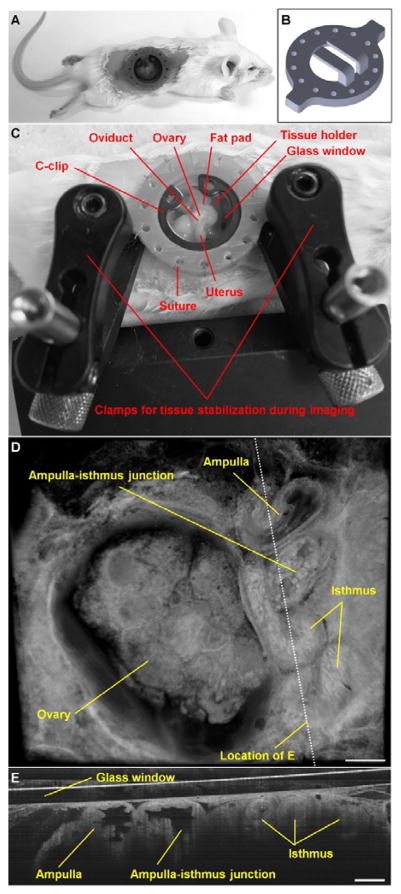
The design of the dorsal imaging window in this study was based on a recently reported model, which was developed for microscopic visualization of the mouse ovary [25]. We optimized this model for imaging the mouse oviduct with OCT (Figure 1A–C). The window frame featured an aperture of 10 mm in diameter, a pair of tissue holders (prongs) to support the reproductive organs in place, and two frame extensions for stabilization during imaging. A circular microscope cover glass (12 mm in diameter) was used to close the aperture, which was fixed by a C-clip. The detailed dimensional information of the dorsal imaging window is presented in Figure S1. In comparison with the previous model for microscopy [25], two major adjustments were made. First, the distance between the surface of tissue holders to the cover glass was increased to 3.3 mm (in comparison to previously reported 1.5 mm). This allowed the ovary and the oviduct to be less compressed, minimizing the possible influence on the oviduct muscle contractions. This adjustment was possible because of the relatively large working distance of OCT, and would affect imaging abilities for light microscopy. Second, instead of using titanium as the material for the window frame, we utilized a high-resolution liquid 3D printer (Form 2, formlabs) to produce the window frame with the standard Grey Resin (formlabs) and a layer thickness of 50 μm. This significantly reduced the cost and improved the efficiency for window optimization.
Figure 1.
In vivo OCT imaging of the mouse oviduct through an implanted dorsal imaging window. (A) A mouse after surgery with the window implanted. (B) The dorsal imaging window model used for 3D printing. (C) The in vivo imaging setup with the window and two stabilization clamps, preventing movement artefacts due to mouse breathing. (D) A representative 3D visualization of the ovary and the oviduct acquired in vivo with OCT through the dorsal imaging window. (E) A 2D depth-resolved cross-sectional view of the oviduct. Scale bars correspond to 500 μm and 300 μm in (D) and (E), respectively.
2.3 Implantation of imaging window
Adult female mice (CD-1, age of 6–8 weeks) were used in this study. A one-time survival surgery was conducted to implant the dorsal imaging window. The female was anesthetized with isoflurane and placed on an operating table connected to a homeothermic control unit to keep the mouse body temperature at 37°C. Petrolatum ophthalmic ointment was applied to the eyes to prevent dehydration during the operation. The mouse was intraperitoneally treated with Ketoprofen prior to the surgery. The dorsal surface of the skin to the right of the spine was shaved and Nair hair removal cream was applied to remove all hair from the area of approximately 2 cm by 3 cm in size (Figure 1A). The depilated skin was then swabbed with betadine and 70% ethanol 3 times, and a circular piece of skin with a diameter of around 1.3 cm was removed. The dorsal imaging window was positioned with the tips of the tissue holders towards the right side of the mouse. Nylon suture (4–0) was utilized to stitch the eyelets of the window frame to the skin along the edge of the incision. After all the eyelets were sutured to the skin, a small cut of 2–3 mm long was made to the muscle layer, where attention was paid to not run across major blood vessels to minimize bleeding. The reproductive organs were then located inside the body cavity, and a pair of blunt forceps was used to grab the fat pad associated with the ovary. The ovary, the oviduct, and part of the uterus were gently pulled up and positioned on the tissue holders with the oviduct facing up. The fat pad was then secured on the holders using tissue adhesive. A circular cover glass was placed on the aperture of window frame and a C-clip was inserted to fix the glass slide in place. After this, tissue adhesive was applied to fill the eyelets to prevent opening of the suture knots and leakage of body fluids. High-vacuum silicone grease was used to create a seal between the glass and the window frame. The mouse skin surrounding the implantation was treated topically with Lidocaine. This whole surgical procedure was typically completed within 45 minutes. Postoperative care was performed, and the mouse was administered nonsteroidal anti-inflammatory drug daily. Mice with the dorsal imaging window implanted exhibited normal feeding activity and grooming behavior. Due to the low cost of imaging window production, each window was only used once.
All mouse manipulation procedures were approved by the Institutional Animal Care and Use Committee of the Baylor College of Medicine, and experiments followed the approved guidelines and regulations.
2.4 In vivo imaging of the mouse oviduct
In vivo OCT imaging was conducted on the anesthetized female through the dorsal imaging window. The mouse was placed on a heated stage to maintain body temperature. During data acquisition, the window was stabilized by two clamps and was slightly lifted to help reduce the influence of the body motion caused by breathing (Figure 1C). To assess the oviduct contraction in 3D, volumetric OCT data was recorded with a 1.5 seconds temporal resolution. To image the ciliary dynamics, B-scans were recorded at a 100 Hz frame rate. For longitudinal imaging, a three-day follow-up was conducted on the same region where the oviduct was located, and 3D structural data and functional cilia data were acquired.
2.5 Data processing and functional analysis
Reconstruction and rendering of the structural data were performed with Imaris software (Bitplane). A typical 3D OCT image is shown in Figure 1D, where detailed structures of the ovary and the oviduct, including the ampulla, ampulla-isthmus junction, and isthmus, can be clearly seen. The depth-resolved cross-sectional view (Figure 1E) provides high-resolution visualization of the whole lumen of the mouse oviduct in vivo, which is generally not available from other imaging modalities.
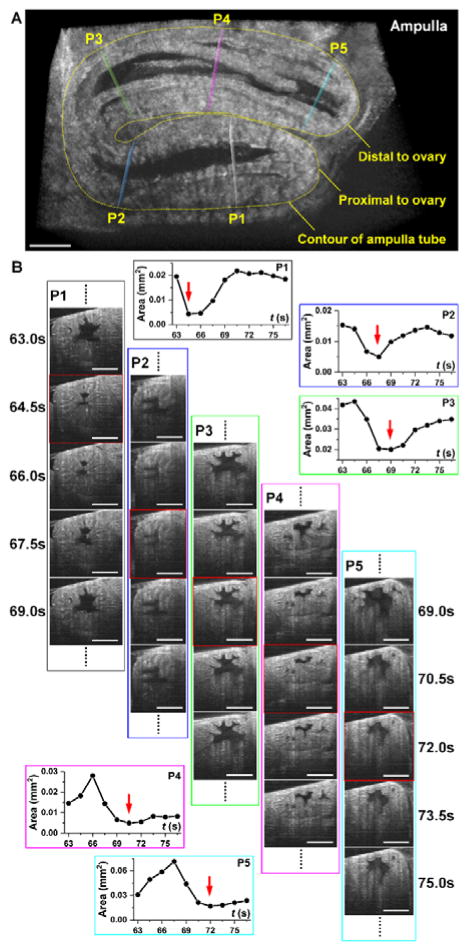
For quantitative assessment of the oviduct contraction, multiple positions were selected within the imaged volume along the oviduct, perpendicular to the length of the oviduct at corresponding locations. The area of the lumen at each cross-section versus time was quantified with ImageJ, revealing the dynamics of the contractile wave. The time of the most contracted state at each location was used to quantify the contraction wave propagation.
The mapping of the oviduct CBF was performed through the functional OCT method that was previously established [18]. Briefly, the method relies on the periodic variation of the speckles induced by the beat of cilia. Each pixel in OCT B-scan time lapse acquired from the oviduct was analysed over 2.56 seconds (256 time points), and the fast Fourier transform was performed on the temporal profile to reveal the frequency spectrum with the resolution of ~0.4 Hz. The amplitude of the dominant frequency was used to identify the cilia location within the structural image, and the value of the dominant frequency was then mapped on the image. In this study, all histograms of CBF were obtained with a 0.4 Hz bin size.
3. Results and discussion
The contraction wave propagating through the mouse oviduct visualized by OCT through the dorsal imaging window in vivo is shown in Figure 2 and Media 1. The wave propagated through the ampulla in the direction from the ovary to the uterus, which correlates with the direction of the longitudinal calcium waves in the oviduct [27]. Depth-resolved cross-sectional views of the luminal dynamics show the contraction wave propagating along the ampulla. Measurement of the lumen area over time provides a quantification of oviduct contraction. Based on analysis in three animals, a contraction cycle was revealed to be 18.7±2.3 seconds. Comparing the normalized profiles of the area at different locations allows one to reconstruct the contraction wave propagation through the oviduct (Figure 3). The linear regression analysis shows a statistically significant dependence of the time delay on the wave traveling distance (Figure 3); the wave velocity is quantified as the reciprocal of slope. Over five continuous cycles, the velocity of the contraction wave was measured as 0.30±0.06 mm/s. The ampulla and the isthmus show different degrees of contraction. At the most contracted state, the lumen of the isthmus is fully closed (Media 2), whereas the ampulla lumen does not close completely (Figure 2 and Media 1). This correlates with previous reports suggesting that the ampulla has a relatively thinner smooth muscle layer than the isthmus, which leads to reduced contractility [28].
Figure 2.
3D imaging of the oviduct contraction in vivo (Media 1). (A) A frame from a 3D time-lapse showing the ampulla tube and five positions (P1-P5) selected for analysis of the contraction wave. (B) Corresponding 2D cross-sections at designated positions P1-P5 over five time points show dynamic changes within the oviduct. Measurements of the luminal area over time provide quantitative assessment of the oviduct contraction wave. Red squares indicate frames corresponding to the most contracted state at each location, corresponding to the red arrows in the plots. Scale bars correspond to 300 μm.
Figure 3.
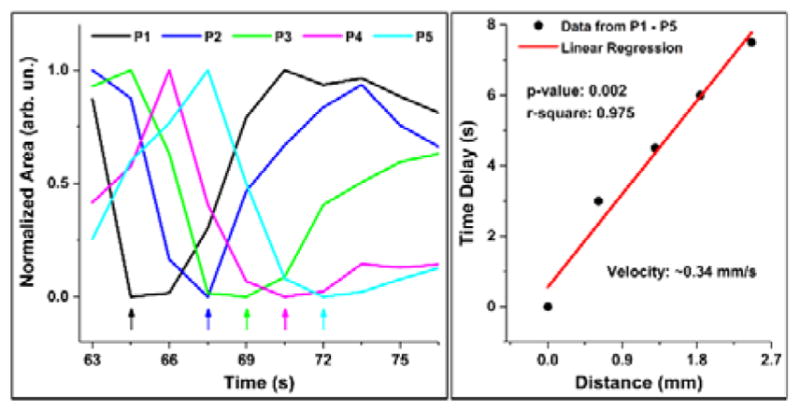
Quantification of oviductal contraction wave velocity. Normalized area profiles over time from the five locations along the ampulla (Figure 2A) show delay of 1–2 time points between the adjacent locations (left). A linear regression on the data of the time delay versus the distance of wave propagation provides an estimation of the wave velocity (right).
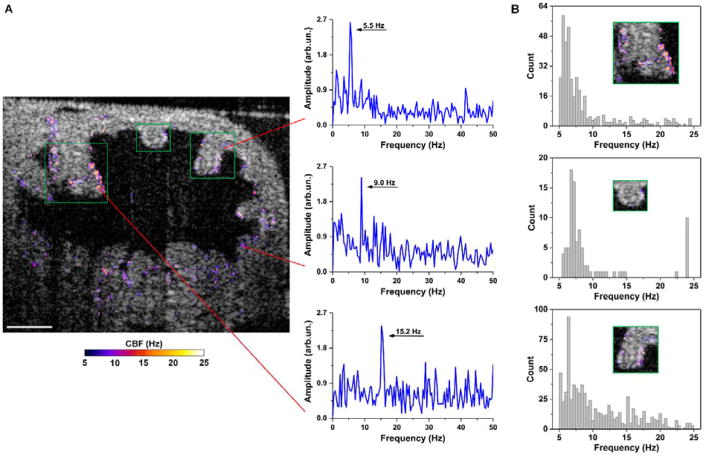
Functional OCT imaging of the oviduct cilia dynamics performed in vivo through the dorsal imaging window is shown in Figures 4 and 5. Based on three typical frequency spectra at different epithelial locations in the oviduct ampulla (Figure 4A), it is clear that the cilia can beat at distinct frequencies spreading a range of up to 20 Hz in the same sample. Even from the same mucosa fold (Figure 4B), there exists a great heterogeneity of the CBF, which suggests that the beats of cilia in vivo in the mouse oviduct ampulla are not well synchronized in terms of the frequency. This observation agrees with the previous experimental finding where the mouse oviduct CBF was measured by bright field microscopy in vitro [29]. As shown in Figure 5, the isthmus of the mouse oviduct has a reduced coverage of cilia (Figure 5A); however, the heterogeneity of CBF is still present (Figure 5B).
Figure 4.
In vivo OCT mapping of CBF in the ampulla through the dorsal imaging window reveals the heterogeneity of the ciliary dynamics. (A) A representative depth-resolved CBF image shows a wide frequency range of cilia beat. Three frequency spectra are selected to show the distinct CBFs in the same oviduct ampulla with the red lines pointing at the spatial locations. (B) Histograms of the CBF from three mucosa folds (labelled with green boxes) in the ampulla present the heterogeneity of CBF even on the same fold. Histograms have a bin size of 0.4 Hz. Scale bars correspond to 100 μm.
Figure 5.
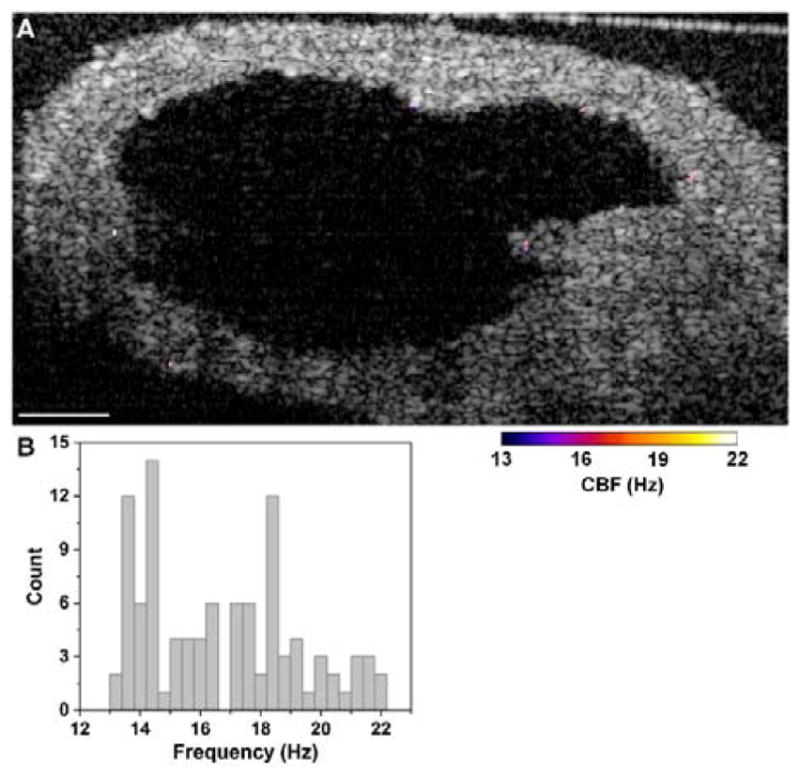
Mapping of CBF in the isthmus with OCT through the dorsal imaging window. (A) A depth-resolve CBF image shows a reduced cilia coverage in this region in comparison to the ampulla. (B) Although with fewer cilia patches, histogram of CBF reveals heterogeneous frequencies of cilia beat. The histogram has a bin size of 0.4 Hz. Scale bar corresponds to 100 μm.
Prolonged imaging of the same oviductal area allows for assessment of the cilia dynamics in the oviduct over time (Figure 6). As an example, a region of interest at the mucosa fold corner in the ampulla was selected for prolonged analysis (Figure 6A). Based on the images (Figure 6B) and measurements (Figure 6C) taken every minute over a seven-minute period, the frequency of the cilia beating in this region remained relatively constant despite of the spatial heterogeneity (Figure 4).
Figure 6.
Time-dependent assessment of CBF in the ampulla in vivo through the dorsal imaging window. (A) A depth-resolved CBF image from a selected time point shows the region of interest for monitor ciliary dynamics over time. (B) The CBF images at every minute over the seven minutes duration show the stable activity of the oviduct cilia. (C) Plot of the CBF over time indicates a relatively constant frequency from the cilia beat. Bars represent the mean values and whiskers represent the standard deviations. Scale bars correspond to 100 μm.
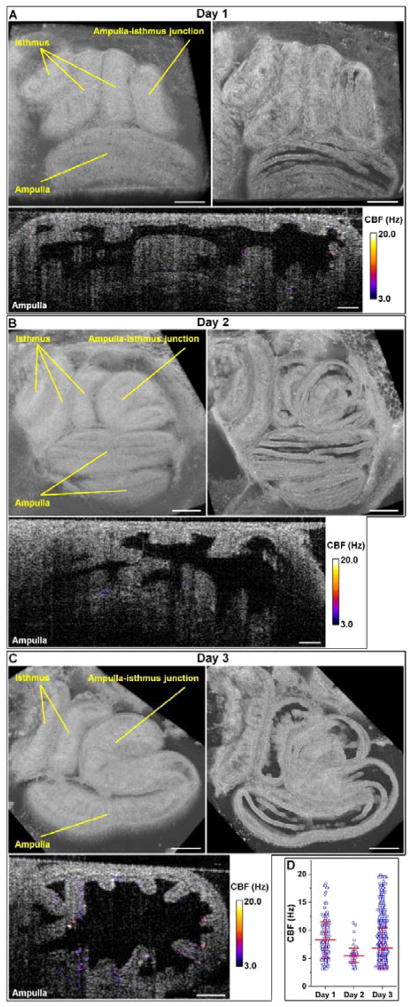
To show the feasibility of this in vivo approach for longitudinal study, we imaged the same oviductal area over three consecutive days after window implantation (Figure 7). Based on the structural images (top in Figure 7A–C), although overall positioning of the oviduct tubes remained similar, the detailed layout of the ampulla and the isthmus slightly changed over days. These rearrangements of the oviduct could be caused by the smooth muscle contractions. The CBF images of the ampulla (bottom in Figure 7A–C) indicate variations of the cilia coverage and the beat frequency over the course of the study, which can also be seen from Figure 7D. This variation is likely to be associated with the changes in hormonal levels, as ciliogenesis and deciliation of the oviductal epithelium are linked to the increase of estrogen and progesterone levels, respectively [30, 31].
Figure 7.
Longitudinal OCT imaging of the mouse oviduct in vivo through the dorsal imaging window. (A-C) Structural and functional OCT images over 3 consecutive days post-surgery show the morphology of ampulla and isthmus as well as the cilia beating. Scale bars correspond to 400 μm for structural images and 100 μm for CBF images.
The first session of the longitudinal imaging was on the day of implanting the dorsal window, and the estrous phase was not measured over the course of the study. As with any invasive procedure, the presented method might affect the normal cycling of the mouse because of the stress the window implantation surgery, which might be a limitation for certain studies. However, the mouse is expected to become accustomed to manipulations over days and re-establish normal cycling [32]. Our future work will monitor the estrous cycle of the mouse after window implantation and will establish the mouse cycling status post-surgery. Further in vivo investigations will focus on the possible correlations between the estrous phase and the oviductal structure and function.
The presented imaging approach is intended for studying the dynamic events taking place in the mouse oviduct during estrous cycle, ovulation, fertilization and preimplantation pregnancy. Once embryos are transported from the oviduct to the uterus for implantation, the thickness of the uterine wall prevents further imaging access, making the described approach unsuitable for post-implantation analysis. If particular study requires for the post-surgery mouse to give birth, feasibility of the presented approach would need to be further investigated.
The OCT imaging of CBF requires the oviduct to be stationary for certain amount of time for the acquisition of time-resolved B-scans. In this study, we utilized 256 time points for frequency analysis, corresponding to a duration of 2.56 seconds. Within each cycle of muscle contraction, the oviduct stayed relaxed for a time period which was over 2.56 seconds. Thus, all the CBF results presented here correspond to the relaxed state of the oviduct. To obtain CBF imaging of contracted state, reducing the number of time points is necessary, which lowers the spectral resolution in the frequency domain. The mucosa folds within the lumen often touch, which make some pixels associated with cilia beating appear like they are within the tissue (Figure 4). This can be clearly seen in our previous study comparing the OCT-based cilia mapping with the corresponding histology [18].
Not only beating cilia, but also blood flow through the vessels within the reproductive system can result in variations of pixel intensities in OCT images. However, because the data processing for CBF relies on dominant peaks in the frequency domain, and the blood-flow-induced variations are not expected to be highly periodic over the imaging time, the influence on CBF mapping is expected to be minimal.
Continuous monitoring of CBF from the same oviduct location is potentially useful to study the time-dependent response of the ciliary activity to hormonal or pharmacological treatments in vivo. In this study, for CBF assessment over time (Figure 6), we relied on 2D imaging and assumed that the oviduct wall returned to the same relaxed position after periodic contractions, which proved to be viable based on the structural information. In this case, potential 3D CBF imaging acquired from the single cycle of contraction could provide a more robust comparison between time points. This may require an increase of the OCT frame rate and implementation of a 3D scanning scheme where a highly dense sampling between adjacent B-scans is conducted over a small distance, as used in OCT angiography [33].
The contraction of the oviduct is driven by pacemaker cells (interstitial cells of Cajal) distributed along the entire oviduct [34], which is considered as one of three critical factors responsible for the oviduct transport function [3]. Thus, the capability of the presented approach in dynamic and quantitative imaging of the mouse oviduct contraction in vivo could provide useful phenotypical analyses for studies involving stimulation or disruption of smooth muscle activity. The temporal resolution of the OCT 3D imaging can be further improved by reducing the field of view. Alternatively, system with a higher A-scan rate (e.g. MHz OCT imaging [35]) can be employed for ultra-fast volumetric imaging of the oviduct contraction.
The design of the dorsal imaging window allows for removal of the cover glass, making it possible to perform manipulations of the oviduct when necessary, such as the topical application and microinjection of substances. The glass can be scratched or spotted with stains during the movement of mouse in the cage, which might affect the imaging quality. Thus, examination and possibly cleaning or replacement of the glass may be performed prior to the imaging experiments. We also noticed that the mouse tends to chew on the implanted window frame. Fitting the mouse with an Elizabethan collar or covering the window frame with a thin metal washer could help to solve this problem.
This imaging approach opens various opportunities for live investigations of oviduct function in mammalian reproduction. Future work will be focused on imaging of oviduct contraction with the oocytes or the cumulus-oocyte complexes presented to detail the oocyte transport process in 3D in vivo, as well as to determine the specific role of smooth muscle contraction in delivering oocytes to the fertilization site and transferring preimplantation embryos toward the uterus. There have been a number of recent studies investigating cilia dynamics with OCT [18, 36–39], with a major focus on the airway cilia. Some of these methods can be implemented using described approach toward detailed assessment of the cilia beat in the oviduct in correlation with the fluid flow and oocyte movements, which will provide direct in vivo analysis on the cilia function in mammalian reproduction.
4. Conclusion
We demonstrate in vivo functional OCT assessment of the mouse oviduct through a dorsal imaging window, which allows for prolonged quantitative characterization of smooth muscle contraction and ciliary dynamics as well as longitudinal analyses. The 3D printed imaging window used in this study is inexpensive, easy to implant, and convenient for prolonged and longitudinal imaging. Quantitative structural dynamics of the reproductive system, such as the velocity of the oviduct contraction wave, can be provided with this method. A high spatial heterogeneity of CBF in the mouse oviduct has also been revealed. The major advantages of the presented method over the widely used bright-field and fluorescence microscopy are the volumetric depth-resolving capability and the non-destructive mapping of CBF through the oviduct wall. This in vivo approach could be useful in studying dynamic aspects of normal reproductive events as well as investigating the effect of genetic and pharmacological manipulations.
Supplementary Material
Muscle contraction of the mouse oviduct in 3D with 2D cross-sectional visualizations from five selected positions shows the wave propagation along the ampulla.
Visualization of the oviduct contraction at the ampulla and isthmus shows difference in luminal closure.
Drawing of the dorsal imaging window shows its detailed dimensions (unit: mm).
Acknowledgments
This project was supported by the National Institute of Health grant R01HL120140 (I.V.L.) and the American Heart Association grant 16POST30990070 (S.W.).
Footnotes
Author biographies Please see Supporting Information online.
References
- 1.Lyons RA, Saridogan E, Djahanbakhch O. Human reproduction update. 2006;12:363–372. doi: 10.1093/humupd/dml012. [DOI] [PubMed] [Google Scholar]
- 2.Coy P, García-Vázquez FA, Visconti PE, Avilés M. Reproduction. 2012;144:649–660. doi: 10.1530/REP-12-0279. [DOI] [PMC free article] [PubMed] [Google Scholar]
- 3.Li S, Winuthayanon W. The Journal of endocrinology. 2017;232:R1–r26. doi: 10.1530/JOE-16-0302. [DOI] [PubMed] [Google Scholar]
- 4.Fazeli A, Affara NA, Hubank M, Holt WV. Biology of reproduction. 2004;71:60–65. doi: 10.1095/biolreprod.103.026815. [DOI] [PubMed] [Google Scholar]
- 5.Georgiou AS, Sostaric E, Wong CH, Snijders AP, Wright PC, Moore HD, Fazeli A. Molecular & cellular proteomics : MCP. 2005;4:1785–1796. doi: 10.1074/mcp.M500119-MCP200. [DOI] [PubMed] [Google Scholar]
- 6.Mondejar I, Acuna OS, Izquierdo-Rico MJ, Coy P, Aviles M. Reproduction in domestic animals = Zuchthygiene. 2012;47(Suppl 3):22–29. doi: 10.1111/j.1439-0531.2012.02027.x. [DOI] [PubMed] [Google Scholar]
- 7.Besenfelder U, Havlicek V, Brem G. Reproduction in Domestic Animals. 2012;47:156–163. doi: 10.1111/j.1439-0531.2012.02070.x. [DOI] [PubMed] [Google Scholar]
- 8.Halbert S, Tam P, Blandau R. Science. 1976;191:1052–1053. doi: 10.1126/science.1251215. [DOI] [PubMed] [Google Scholar]
- 9.Jung JG, Lim W, Park TS, Kim JN, Han BK, Song G, Han JY. Reproductive biology and endocrinology : RB&E. 2011;9:62. doi: 10.1186/1477-7827-9-62. [DOI] [PMC free article] [PubMed] [Google Scholar]
- 10.Mokhtar DM. Journal of Microscopy and Ultrastructure. 2015;3:44–52. doi: 10.1016/j.jmau.2014.09.002. [DOI] [PMC free article] [PubMed] [Google Scholar]
- 11.Noreikat K, Wolff M, Kummer W, Kolle S. Biology of reproduction. 2012;86:120. doi: 10.1095/biolreprod.111.096339. [DOI] [PubMed] [Google Scholar]
- 12.Adissu HA, Asem EK, Lelievre SA. Reproductive Sciences. 2007;14:11–19. doi: 10.1177/1933719107310872. [DOI] [PubMed] [Google Scholar]
- 13.Chen S, Einspanier R, Schoen J. Theriogenology. 2013;80:862–869. doi: 10.1016/j.theriogenology.2013.07.011. [DOI] [PubMed] [Google Scholar]
- 14.Kölle S, Reese S, Kummer W. Theriogenology. 2010;73:786–795. doi: 10.1016/j.theriogenology.2009.11.002. [DOI] [PubMed] [Google Scholar]
- 15.Ishikawa Y, Usui T, Yamashita M, Kanemori Y, Baba T. Biology of reproduction. 2016;94:89. doi: 10.1095/biolreprod.115.135418. [DOI] [PubMed] [Google Scholar]
- 16.Wang H, Dey SK. Nat Rev Genet. 2006;7:185–199. doi: 10.1038/nrg1808. [DOI] [PubMed] [Google Scholar]
- 17.Burton JC, Wang S, Stewart CA, Behringer RR, Larina IV. Biomed Opt Express. 2015;6:2713–2723. doi: 10.1364/BOE.6.002713. [DOI] [PMC free article] [PubMed] [Google Scholar]
- 18.Wang S, Burton JC, Behringer RR, Larina IV. Scientific Reports. 2015;5:13216. doi: 10.1038/srep13216. [DOI] [PMC free article] [PubMed] [Google Scholar]
- 19.Huang D, Swanson EA, Lin CP, Schuman JS, Stinson WG, Chang W, Hee MR, Flotte T, Gregory K, Puliafito CA, et al. Science. 1991;254:1178–1181. doi: 10.1126/science.1957169. [DOI] [PMC free article] [PubMed] [Google Scholar]
- 20.Izatt JA, Choma MA. In: Theory of Optical Coherence Tomography, Vol. Drexler W, Fujimoto JG, editors. Springer Berlin Heidelberg; Berlin, Heidelberg: 2008. pp. 47–72. [Google Scholar]
- 21.Alieva M, Ritsma L, Giedt RJ, Weissleder R, van Rheenen J. IntraVital. 2014;3:e29917. doi: 10.4161/intv.29917. [DOI] [PMC free article] [PubMed] [Google Scholar]
- 22.Ritsma L, Steller EJA, Beerling E, Loomans CJM, Zomer A, Gerlach C, Vrisekoop N, Seinstra D, van Gurp L, Schäfer R, Raats DA, de Graaff A, Schumacher TN, de Koning EJP, Rinkes IHB, Kranenburg O, Rheenen Jv. Science Translational Medicine. 2012;4:158ra145–158ra145. doi: 10.1126/scitranslmed.3004394. [DOI] [PubMed] [Google Scholar]
- 23.Holtmaat A, Bonhoeffer T, Chow DK, Chuckowree J, De Paola V, Hofer SB, Hübener M, Keck T, Knott G, Lee WCA, Mostany R, Mrsic-Flogel TD, Nedivi E, Portera-Cailliau C, Svoboda K, Trachtenberg JT, Wilbrecht L. Nature protocols. 2009;4:1128–1144. doi: 10.1038/nprot.2009.89. [DOI] [PMC free article] [PubMed] [Google Scholar]
- 24.Farrar MJ, Bernstein IM, Schlafer DH, Cleland TA, Fetcho JR, Schaffer CB. Nature methods. 2012;9:297–302. doi: 10.1038/nmeth.1856. [DOI] [PMC free article] [PubMed] [Google Scholar]
- 25.Bochner F, Fellus-Alyagor L, Kalchenko V, Shinar S, Neeman M. Scientific Reports. 2015;5:12446. doi: 10.1038/srep12446. [DOI] [PMC free article] [PubMed] [Google Scholar]
- 26.Wang S, Lakomy DS, Garcia MD, Lopez AL, Larin KV, Larina IV. Journal of Biophotonics. 2016;9:837–847. doi: 10.1002/jbio.201500314. [DOI] [PMC free article] [PubMed] [Google Scholar]
- 27.Dixon RE, Britton FC, Baker SA, Hennig GW, Rollings CM, Sanders KM, Ward SM. American Journal of Physiology - Cell Physiology. 2011;301:C1458–C1469. doi: 10.1152/ajpcell.00293.2011. [DOI] [PMC free article] [PubMed] [Google Scholar]
- 28.Rendi MH, Muehlenbachs A, Garcia RL, Boyd KL. In: 17 - Female Reproductive System A2 - Treuting, Piper M, Vol. Dintzis SM, editor. Academic Press; San Diego: 2012. pp. 253–284. [Google Scholar]
- 29.Shi D, Komatsu K, Uemura T, Fujimori T. Genes to cells : devoted to molecular & cellular mechanisms. 2011;16:282–290. doi: 10.1111/j.1365-2443.2011.01484.x. [DOI] [PubMed] [Google Scholar]
- 30.Verhage HG, Bareither ML, Jaffe RC, Akbar M. The American journal of anatomy. 1979;156:505–521. doi: 10.1002/aja.1001560405. [DOI] [PubMed] [Google Scholar]
- 31.Donnez J, Casanas-Roux F, Caprasse J, Ferin J, Thomas K. Fertility and sterility. 1985;43:554–559. doi: 10.1016/s0015-0282(16)48496-7. [DOI] [PubMed] [Google Scholar]
- 32.Caligioni C. Current protocols in neuroscience/editorial board, Jacqueline N. Crawley … [et al.] 2009 APPENDIX, Appendix-4I. [Google Scholar]
- 33.Chen CL, Wang RK. Biomed Opt Express. 2017;8:1056–1082. doi: 10.1364/BOE.8.001056. [DOI] [PMC free article] [PubMed] [Google Scholar]
- 34.Dixon RE, Hwang SJ, Hennig GW, Ramsey KH, Schripsema JH, Sanders KM, Ward SM. Biology of reproduction. 2009;80:665–673. doi: 10.1095/biolreprod.108.073833. [DOI] [PMC free article] [PubMed] [Google Scholar]
- 35.Wang S, Singh M, Lopez AL, Wu C, Raghunathan R, Schill A, Li J, Larin KV, Larina IV. Opt Lett. 2015;40:4791–4794. doi: 10.1364/OL.40.004791. [DOI] [PMC free article] [PubMed] [Google Scholar]
- 36.Jonas S, Bhattacharya D, Khokha MK, Choma MA. Biomed Opt Express. 2011;2:2022–2034. doi: 10.1364/BOE.2.002022. [DOI] [PMC free article] [PubMed] [Google Scholar]
- 37.Oldenburg AL, Chhetri RK, Hill DB, Button B. Biomed Opt Express. 2012;3:1978–1992. doi: 10.1364/BOE.3.001978. [DOI] [PMC free article] [PubMed] [Google Scholar]
- 38.Liu L, Chu KK, Houser GH, Diephuis BJ, Li Y, Wilsterman EJ, Shastry S, Dierksen G, Birket SE, Mazur M, Byan-Parker S, Grizzle WE, Sorscher EJ, Rowe SM, Tearney GJ. PLOS ONE. 2013;8:e54473. doi: 10.1371/journal.pone.0054473. [DOI] [PMC free article] [PubMed] [Google Scholar]
- 39.Jing JC, Chen JJ, Chou L, Wong BJF, Chen Z. Scientific Reports. 2017;7:8522. doi: 10.1038/s41598-017-08968-x. [DOI] [PMC free article] [PubMed] [Google Scholar]
Associated Data
This section collects any data citations, data availability statements, or supplementary materials included in this article.
Supplementary Materials
Muscle contraction of the mouse oviduct in 3D with 2D cross-sectional visualizations from five selected positions shows the wave propagation along the ampulla.
Visualization of the oviduct contraction at the ampulla and isthmus shows difference in luminal closure.
Drawing of the dorsal imaging window shows its detailed dimensions (unit: mm).


