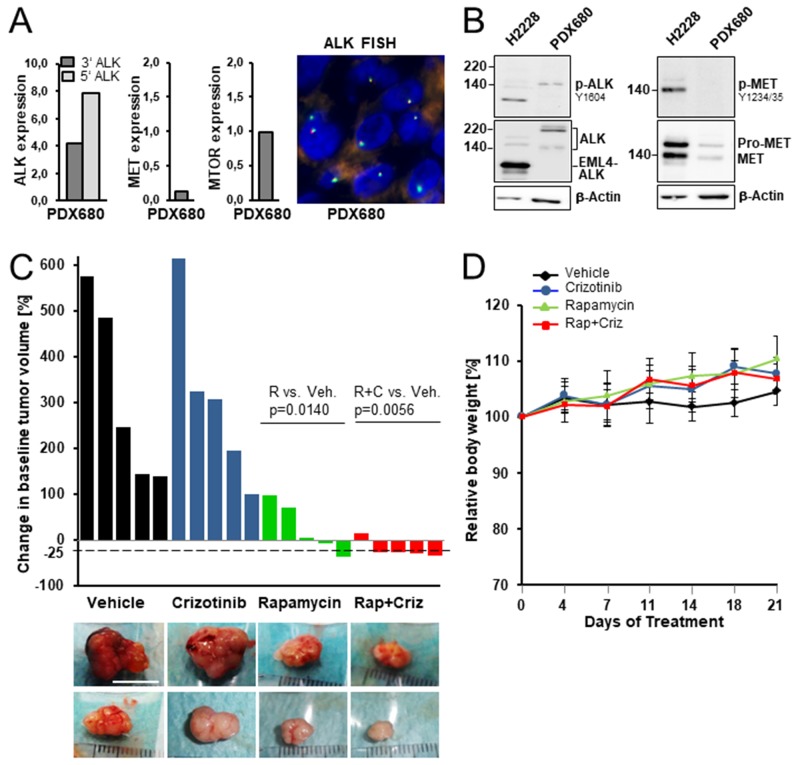
Figure 3. Preclinical efficacy of rapamycin, crizotinib and combined treatment in a mesothelioma xenograft model.
(A) ALK, MET and MTOR transcript expression in xenograft PDX680. ALK break-apart FISH confirmed translocation-independent gene expression. (B) ALK was activated in PDX680, MET was expressed at low levels, but not phosphorylated demonstrated by immunoblot analysis using cell line H2228 as positive control for active EML4-ALK and MET. (C) Waterfall plots of tumoral response in mice treated with vehicle, crizotinib, rapamycin, or rapamycin and crizotinib. Each bar indicated percent change in the volume of an individual tumor on day 21 compared with day 0 of treatment. Statistically significant differences: vehicle vs. rapamycin (p=0.0140), vehicle vs. combined treatment (p=0.0056). Representative pictures of excised tumors from each treatment group; each row contains tumors that had almost identical volumes at day 0 of treatment: upper row, 160-200 mm3; lower row, 100-120 mm3. Scale bar, 10 mm. (D) Changes in the mean of body weight over the time course of the experiment.

