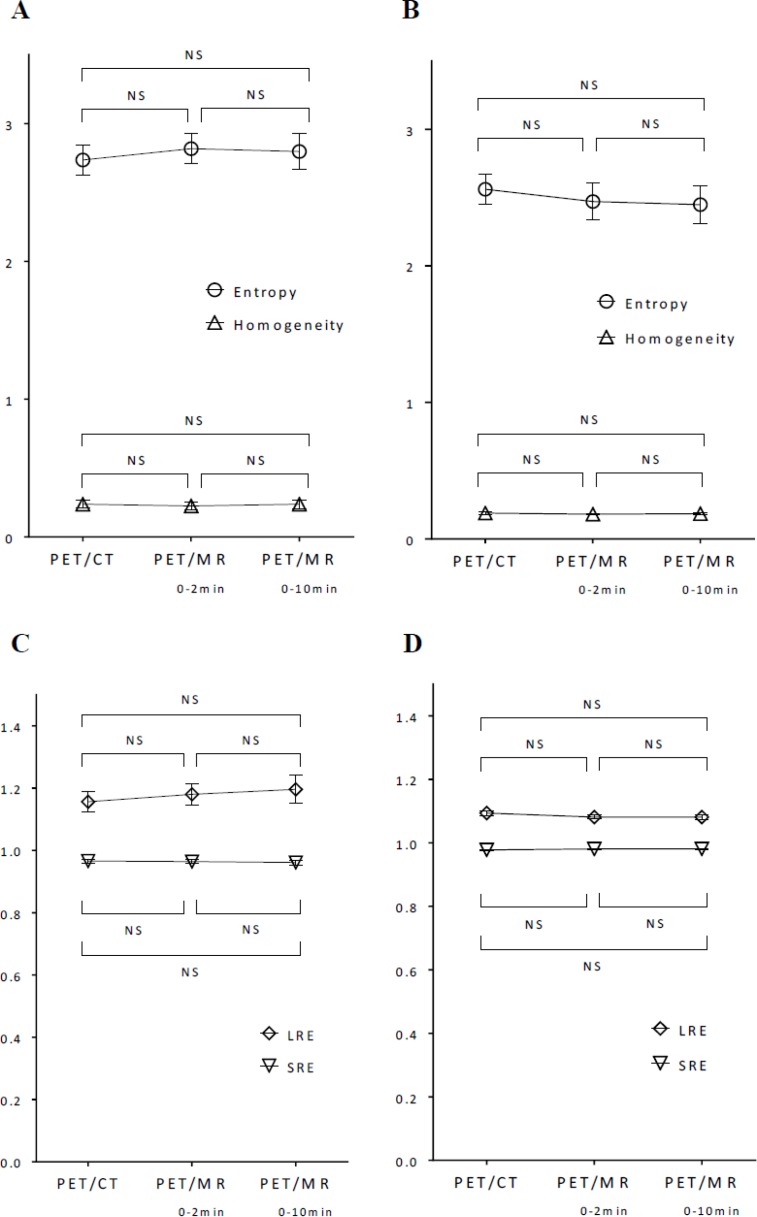
Figure 4.
Comparisons of entropy, homogeneity, SRE, and LRE extracted using 64 bins (bin width = 0.4 SUV) among 3 images in gynecological cancer (A, C) and oral cavity/oropharyngeal cancer (B, D). Data represent the mean with error bars showing standard errors. The significance of differences was tested by a one-way repeated measures ANOVA. NS: not significant.

