

Abstract
Aim: Endothelial progenitor cells (EPCs) are shown to participate in the pathological processes of atherosclerosis. While Vitamin D and its receptor axis might exert some effects on EPCs' function. But their exact relationship with clinical patients is still elusive, which inspired us to explore the potential association of vitamin D receptor (VDR) expression on circulating EPCs and serum vitamin D levels among patients with coronary artery disease (CAD).
Methods: Two hundred patients with CAD after their admission to hospital and one hundred healthy controls were enrolled. Medical history data were retrieved and fresh blood samples were collected for flow cytometry analysis. VDR expressions on EPCs were evaluated according to the standardized protocol. Logistic regression analysis was used to investigate the potential risk factor of CAD.
Results: CAD patients were found to have lower log10VDR-MFIs than those of control group, especially for patients with diabetes (p < 0.001). Log10VDR-MFIs were inversely correlated with glycated hemoglobin (R = −0.472, p < 0.001), and while EPCs challenged with high glucose had lower VDR expression. Multivariate logistic regression analysis revealed that lower log10VDR-MFIs were independently associated with the risk of CAD (OR = 0.055, p = 0.008).
Conclusion: A significant decrease of VDR expression on circulating EPCs was observed among CAD patients, particularly among those also with diabetes. VDR expression on EPCs was independently negatively correlated with HbA1c and high glucose decreased EPCs' VDR expression. Low levels of VDR expression on circulating EPCs might serve as a potential risk factor of CAD.
Keywords: Coronary artery disease, Endothelial progenitor cells, Vitamin D receptor, Diabetes
Introduction
Atherosclerosis is featured by imbalance of endothelium injury and repair, which often leads to some severe clinical complications such as myocardial infarct, stroke, and so on1). Data from recent studies uncovered the key role of endothelial progenitor cells (EPCs) during such pathological process by mediating the activation of endogenous endothelial repair2). After sensing the damage to endothelial layer of arteries and following tissue ischemia, EPCs are mobilized from the bone marrow or adjacent arteries, homing to the affected areas and mediating tissue recovery3). Abnormal levels and dysfunction of circulating EPCs were shown to be associated with severity of coronary artery disease (CAD)4–7). EPCs have been defined by several cell surface markers, such as CD34, CD133, and kinase insert domain receptor (KDR). According to the standardized International Society of Hematotherapy and Graft Engineering (ISHAGE) protocol described before, combination of CD45dim, CD34+, and KDR+ could be used to define human circulating EPC population8).
Recently several researches reported the increased proportion of EPCs with the osteoblastic marker osteocalcin (OCN) among patients with atherosclerosis9–11), which implied that such specific markers on EPCs would be used as potential biomarkers of endothelium regeneration and prognosis of atherosclerosis. In addition to being involved with the maintenance of mineral homeostasis in vivo, Vitamin D receptor (VDR) was also suggested to modulate endothelial function in response to inflammation, thrombosis, and vasodilation12, 13). Data from a cross-sectional study about dialysis patients showed that VDR expressions on circulating EPCs decreased among dialysis patients compared with those of control group and significantly increased after calcitriol or paricalcitol therapy14, 15), which implied that change of VDR expression on circulating EPCs might be used to evaluate patient's therapy response.
Since patients with end-stage renal disease had been confirmed with high risk of atherosclerotic cardiovascular disease (ASCVD), but no data about the correlation between VDR expressed on circulating EPCs and ASCVD was available. Our study aimed to evaluate the expression of VDR on circulating EPCs and serum vitamin D among patients with coronary artery disease (CAD).
Methods
Ethics Statement
Protocol of this study was approved by the ethics committee of Shanghai Changzheng Hospital, which was conformed to the ethical guidelines of the 1975 Declaration of Helsinki. Written informed consents were given to all study participants.
Enrolled Participants Selection
100 healthy volunteers and 200 patients with diagnosed CAD were enrolled in the study. Diagnosis of CAD was based on typical chest pain, ischemic proofs of electrocardiogram, and angiographically proven coronary artery stenosis (> 70%)16). Unstable angina (UA) was defined as angina pain at rest lasting for at least 10 min within 24 h before enrollment or more severe and prolonged angina pectoris or angina precipitated by less exertion than in the past and electrocardiographic (ECG) changes compatible with the clinical diagnosis of UA (new ST-segment depression more than 0.1 mV and T wave inversion ≥ 0.1 mV in at least two adjacent leads)17, 18). Others were diagnosed as stable angina (SA). Control group included healthy volunteers from physical examination centers without previous history or current symptoms or signs of ischemic heart disease. All CAD patients underwent coronary angiography. Stenosis severity was evaluated based on Syntax scores by two experienced cardiologists blinded to the experimental data, and patients were divided into two groups (low Syntax score ≤ 22, high Syntax score > 22)19).
Data about enrollers' risk factor of CAD, such as age, gender, smoking habits, diabetes mellitus (DM), and hypertension were also collected. Hypertension was diagnosed based on repeated blood pressure measurements ≥ 140/90 mmHg (at least two times in different environments) or the current medication of antihypertensive drugs. Diagnose of DM was based on a fasting serum glucose level ≥ 6.99 mmol/L on multiple occasions and/or oral glucose tolerance test result ≥ 11.01mmol/L and/or random plasma glucose level ≥ 11.01mmol/L and/or glycated hemoglobin (HbA1c) level ≥ 47.54 mmol/mol, and/or the use of insulin or oral antidiabetic agents20).
Exclusion criteria for all groups were: 1) age > 80 years or age < 50 years, 2) patients with myocardial infarction, 3) evidence of any systemic inflammatory or infectious diseases, organ failure, malignancies, immunologic or hematologic diseases, 4) current treatment with non-steroidal anti-inflammatory drugs other than aspirin, 5) evidence of chronic renal insufficiency (evaluated glomerular filtration rate less than 90 ml/min × 1.73m2) and medical history of exogenous vitamin D supplements.
Laboratory Tests
Laboratory data were acquired from venous blood samples obtained after a 12 h overnight fast prior to coronary angiography. Serum levels of lipids, 25(OH) vitamin D, C-reactive protein (CRP), and HbA1C were examined with the commercial kits. IFCC-HbA1C was transformed according to the IFCC-aligned standards for reporting HbA1C using the following formula: HbA1C (%) = HbA1C (mmol/mol)/10.929 + 2.1521).
Flow Cytometry Quantification of VDR Expression on Circulating EPCs
EPCs were quantified using the following protocol: fresh blood collected into EDTA collection tubes were transported on wet ice and preceded within 2 to 3 h. FcR-blocking antibody was added and incubated for 10 min at room temperature. All staining procedures were performed on ice. 100 µl whole blood was incubated with 2 µl of CD45 (FITC; Beckton Dickinson), 1 µl of CD34 (PerCP; Abcam), 1 µl of KDR (PE; Beckton Dickinson), and 1 µl of VDR (Abcam) for 30 min. After a gentle wash, the sample was incubated with 1 µl of rat anti-mouse antibody (APC; Beckton Dickinson). Before flow cytometry analysis, the samples were lysed and washed to remove the erythrocytes. Circulating EPCs were sequential gating according to our previous study protocol7) derived from the ISHAGE strategy8) using FlowJo, and expression of VDR on circulating EPCs was shown as geometric mean fluorescence intensity (VDR-MFIs). For the level of VDR-MFIs was too high and too discrete to count, log10VDR-MFIs were used for statistics.
Preparation of Human EPCs
EPCs were prepared as described previously22). Briefly, blood obtained from healthy volunteers was diluted 1:2 in phosphate-buffered saline layered over Histopaque 1077 (Amersham Biosciences, Piscataway, NJ, USA) and centrifuged for 30 min at 400 g at room temperature. Peripheral blood mononuclear cells were incubated in M-199 (GIBCO, Los Angeles, CA, USA) medium supplemented with recombinant human vascular endothelial growth factor (30 ng/mL, from Pepro Tech, London) in six-well tissue culture plates (107 per well) at 37°C 2). The medium was replaced every 3 days, and cells not adhering to the bottom were washed away. On day 7, the cells were changed to serum-free medium for another 24 h23) and then treated with different culture media: one containing normal glucose (5.5 mmol/L) as negative control, one containing normal glucose and mannitol (16.5 mmol/L) as osmotic pressure control, and the last one with high glucose (22 mmol/L).
VDR mRNA Expression
Total RNA was extracted from the sample by the TRIzol method strictly following the manufacturer's protocol (Takara, Dalian, China). Concentrations and purities of isolated RNA were measured at 260 nm using Nanodrop and with A260/280 ratio respectively. The first-strand cDNA used for quantitative real-time PCR was synthesized from 1 µg of RNA with Prime-Script RT Master Mix (Takara, Dalian, China). Expression levels of VDR gene were quantified with Bio-Rad real-time PCR system (Bio-rad, USA) and SYBR green PCR reaction mix (Bio-Rad, USA). Primers of VDR and GAPDH (synthesized by Takara Biological Technology Co. Ltd, Dalian, China) are listed in Table 1. The program was as follows: 95°C for 3 min, 45 cycles of 95°C for 15 s, and annealing temperature for 45 s. Melting curve analysis and agarose gel electrophoresis were performed to confirm the specificity of the PCR products obtained using each primer pair. Relative expression levels of genes were analyzed using the 2−ΔΔct method by normalizing with GAPDH housekeeping gene expression and presented as fold change relative to cells cultured in normal glucose.
Table 1. Primers for quantitative real-time PCR.
| Genes | Primer sequence | Product size (bp) | Annealing temperature (°C) |
|---|---|---|---|
| VDR | S: 5′-GGTACAGCGTAAGAGGGAGATGA-3′ AS: 5′-TAGGTGGGGTCATAGGTCTTGTG-3′ |
144 | 6 |
| GAPDH | S: 5′-TATGACTCTACCCACGGCAAGT-3′ AS: 5′-ATACTCAGCACCAGCATCACC-3′ |
138 | 60 |
Statistical Analysis
Continuous variables were tested for normal distribution with the Kolmogorov–Smirnov test. Comparisons between the two groups were analyzed by t test (two-sided) for normally distributed variables or ANOVA for those with more than two subgroups. Data were expressed as mean ± SD. Not normally distributed continuous variables were compared by the Mann–Whitney U test. Categorical variables were presented as frequency and percentage, which were compared using Pearson chi-square test. Multivariate linear regression analysis and nonparametric bivariate correlation (Spearman rank correlation coefficient) were used to correlate log10VDR-MFIs with cardiovascular risk factors. Statistical significance was assumed if a null hypothesis could be rejected at p ≤ 0.05. All statistical analysis was performed with SPSS 17.
Results
Characteristics of enrolled 300 participants are summarized in Tables 1 and 2.
Table 2. Clinical characteristics of study population based on with or without DM.
| Control (n = 100) | CAD only (n = 120) | CAD with DM (n = 80) | P-value | |
|---|---|---|---|---|
| Male (%) | 62 (62) | 88 (73.33) | 58 (72.50) | 0.149 |
| Age, yeas | 58.31 ± 8.52 | 60.39 ± 9.57 | 59.13 ± 10.81 | 0.270 |
| Hypertension, n (%) | 39 (39) | 56 (46.67) | 44 (55) | 0.101 |
| History of smoking, n (%) | 40 (40) | 54 (45.45) | 45 (56.25) | 0.088 |
| Current Medication | ||||
| Aspirin, n (%) | 4 (4) | 116 (96.67) | 78 (97.5) | < 0.001 |
| Clopidogrel, n (%) | 0 (0) | 109 (90.83) | 73 (91.25) | < 0.001 |
| β-blocker, n (%) | 14 (14) | 92 (76.67) | 63 (78.75) | < 0.001 |
| ACEI/ARBs, n (%) | 21 (21) | 57 (47.5) | 58 (72.5) | < 0.001 |
| Statin, n (%) | 0 (0) | 110 (91.67) | 76 (95) | < 0.001 |
| Insulin/Oral antidiabetic drugs, n (%) | 2 (2) | 0 (0) | 75 (93.75) | < 0.001 |
| Laboratory testing | ||||
| Fasting glucose, mmol/L | 5.34 ± 0.57 | 5.27 ± 0.69 | 9.05 ± 1.79 | < 0.001*, # |
| Total cholesterol, mmol/L | 4.43 ± 1.02 | 4.28 ± 1.15 | 4.39 ± 1.24 | 0.597 |
| LDL-C, mmol/L | 2.41 ± 0.77 | 2.30 ± 1.06 | 2.55 ± 0.92 | 0.181 |
| HDL-C, mmol/L | 1.07 ± 0.31 | 1.06 ± 0.38 | 0.96 ± 0.45 | 0.107 |
| Triglycerides, mmol/L | 1.92 ± 1.43 | 1.95 ± 1.27 | 2.08 ± 1.02 | 0.916 |
| 25(OH) vitamin D, ng/ml | 33.05 ± 7.28 | 32.70 ± 6.72 | 30.79 ± 7.13 | 0.074 |
| hs-CRP, mg/L | 6.34 ± 7.25 | 5.62 ± 4.98 | 6.50 ± 7.51 | 0.581 |
| HbA1c, mmol/mol | 38.72 ± 4.29 | 39.35 ± 4.50 | 61.63 ± 9.91 | < 0.001*, # |
| Syntax Score | / | 12.26 ± 9.43 | 16.57 ± 8.82 | 0.001 |
Continuous variables were presented as mean ± S.D. for normal distribution. One-way ANOVA was used to compare the difference among groups and post-hoc (Tukey) test was used for multiple comparisons.
P < 0.001, CAD with diabetes vs control,
P < 0.001, CAD with diabetes vs CAD only
Categorical variables were presented as frequency and percentage, which were compared using Chi-square test.
Notably, patients with CAD and DM had higher levels of HbA1c and fasting glucose than those of the other two groups (p < 0.001). No statistical differences of ages, serum lipids, and CRP were seen among the three groups. Comparing with those with CAD only, no significant difference of Syntax Score with patients with CAD and DM was revealed. As summarized in Table 2, patients with UA had higher levels of HbA1c than those of control (p < 0.001), but no statistical difference was observed between the groups of UA and SA. Patients with UA had higher levels of fasting glucose than those of the other two groups (p < 0.001).
As Fig. 1 showed, the numbers of EPCs were significantly higher in healthy controls compared with those of patients with CAD, no matter with or without DM (p = 0.001). Comparison of log10VDR-MFIs on circulating EPCs among the three groups, lower log10VDR-MFIs was found within the patients with CAD only (p = 0.001) and those with CAD and DM (p < 0.001), and the latter had even lower log10VDR-MFIs (p = 0.005). In addition to log10VDR-MFIs, no significant differences of serum 25(OH) vitamin D levels were seen among the three groups (p = 0.074, Fig. 1C). Log10VDR-MFIs among the control group were significantly higher than those among UA groups (p < 0.001), but not higher than those within SA group (p = 0.065), and no difference was shown between the two CAD subgroups (p = 0.127, Fig. 2A). While no significant differences of serum 25(OH) vitamin D levels were shown among the three groups (p = 0.063, Fig. 2C).
Fig. 1.

Differences of VDR-MFIs on circulating EPCs and serum 25(OH) vitamin D levels among three groups
A. EPC levels were significantly higher among healthy controls compared with those of patients with CAD, no matter with or without DM, but no difference was observed between the two CAD groups.
B. VDR-MFIs on circulating EPCs were significantly lower in CAD patients compared with those in control groups, no mater with DM or not, and patients with DM had lower Log10VDR-MFIs than patients with CAD only.
C. No difference was observed on serum 25(OH) vitamin D levels among these groups.
Fig. 2.

Differences of log10VDR-MFIs on circulating EPCs and serum 25(OH) vitamin D levels among three groups
A. EPC levels were significantly higher among healthy controls compared with those of patients with CAD, no matter stable or not, but no difference was observed between the two CAD groups. B. Log10VDR-MFIs on circulating EPCs were significantly lower in CAD patients with UA compared with those in control groups, but no difference was observed between SA and control groups, and also no difference between the two CAD groups.
C. No difference was observed on serum 25(OH) vitamin D levels among these groups.
Patients with CAD were divided into two groups based on Syntax Score as shown in Table 3. More patients with high Syntax Score had DM (p < 0.001) and hypertension (p < 0.001) than those with low Syntax Score, and those with high Syntax Score had higher levels of fasting glucose (p < 0.001), LDL (p < 0.001), and HbA1c (p < 0.001). But no differences of log10VDR-MFIs (p = 0.179), EPCs numbers (p = 0.230), and serum 25(OH) vitamin D levels (p = 0.068) were observed between these two groups.
Table 3. Clinical characteristics of study population based on severity of angina.
| Control (n = 100) | SA (n = 73) | UA (n = 127) | P-value | |
|---|---|---|---|---|
| Male (%) | 62 (62) | 51 (69.86) | 95 (74.80) | 0.115 |
| Age, yeas | 58.31 ± 8.52 | 60.58 ± 9.32 | 61.03 ± 10.42 | 0.089 |
| Hypertension, n (%) | 39 (39) | 33 (45.21) | 67 (52.76) | 0.116 |
| DM, n (%) | 2 (2) | 17 (23.29) | 63 (49.61) | < 0.001 |
| History of smoking, n (%) | 40 (40) | 34 (46.58) | 65 (51.18) | 0.187 |
| Current Medication | ||||
| Aspirin, n (%) | 4 (4) | 70 (95.89) | 124 (97.64) | < 0.001 |
| Clopidogrel, n (%) | 0 (0) | 65 (89.04) | 117 (92.13) | < 0.001 |
| β-blocker, n (%) | 14 (14) | 63 (86.30) | 92 (72.44) | < 0.001 |
| ACEI/ARBs, n (%) | 21 (21) | 36 (49.36) | 79 (62.20) | < 0.001 |
| Statin, n (%) | 0 (0) | 64 (87.67) | 122 (96.06) | < 0.001 |
| Insulin/Oral antidiabetic drugs, n (%) | 2 (2) | 15 (20.55) | 60 (47.24) | < 0.001 |
| Laboratory testing | ||||
| Fasting glucose, mmol/L | 5.34 ± 0.57 | 7.13 ± 1.57 | 8.08 ± 0.91 | < 0.001*, #, & |
| Total cholesterol, mmol/L | 4.43 ± 1.02 | 4.46 ± 0.95 | 4.58 ± 1.23 | 0.556 |
| LDL-C, mmol/L | 2.41 ± 0.77 | 2.43 ± 0.78 | 2.50 ± 0.97 | 0.713 |
| HDL-C, mmol/L | 1.07 ± 0.31 | 1.05 ± 0.40 | 0.96 ± 0.42 | 0.072 |
| Triglycerides, mmol/L | 1.92 ± 1.43 | 2.07 ± 1.35 | 1.96 ± 1.14 | 0.744 |
| 25(OH) vitamin D, ng/ml | 33.05 ± 7.28 | 30.68 ± 7.25 | 32.67 ± 6.37 | 0.063 |
| hs-CRP, mg/L | 6.34 ± 7.25 | 4.98 ± 4.90 | 5.43 ± 9.77 | 0.509 |
| HbA1c, mmol/mol | 38.72 ± 4.29 | 44.15 ± 12.51 | 50.05 ± 13.82 | < 0.001*, #, & |
| Syntax Score | / | 12.71 ± 0.25 | 15.37 ± 8.77 | 0.127 |
Continuous variables were presented as mean ± S.D. for normal distribution. One-way ANOVA was used to compare the difference among groups and post-hoc (Tukey) test was used for multiple comparisons.
P < 0.001, UA vs control;
P < 0.001, SA vs control;
P < 0.01, UA vs SA
Categorical variables were presented as frequency and percentage, which were compared using Chi-square test.
Table 4 shows the potential correlations between log10VDR-MFIs on circulation EPCs and other clinical variables. A negative correlation between log10VDR-MFIs and HbA1c was uncovered (R = −0.472, p < 0.001, Fig. 3). Except for HbA1C, no correlations between VDR-MFIs and other factors such as age, lipids, CRP, serum 25(OH) vitamin D levels, and Syntax Score were observed.
Table 4. Clinical characteristics based on Syntax Score grouping.
| Low Syntax Score (≤ 22, n = 134) | High Syntax Score (> 22, n = 66) | P-value | |
|---|---|---|---|
| Male (%) | 96 (71.64) | 50 (75.76) | 0.538 |
| Age, yeas | 60.54 ± 9.13 | 61.02 ± 9.74 | 0.528 |
| Hypertension, n (%) | 54 (40.30) | 46 (69.70) | < 0.001 |
| DM, n (%) | 32 (23.88) | 48 (72.73) | < 0.001 |
| History of smoking, n (%) | 70 (57.46) | 29 (43.94) | 0.270 |
| Current Medication | |||
| Aspirin, n (%) | 130 (97.01) | 64 (96.97) | 0.986 |
| Clopidogrel, n (%) | 120 (89.55) | 62 (93.94) | 0.308 |
| β-blocker, n (%) | 109 (81.34) | 46 (69.70) | 0.064 |
| ACEI/ARBs, n (%) | 73 (54.48) | 42 (63.64) | 0.218 |
| Statin, n (%) | 123 (91.79) | 63 (95.45) | 0.340 |
| Insulin/Oral antidiabetic drugs, n (%) | 30 (22.39) | 45 (68.18) | < 0.001 |
| Laboratory testing | |||
| Fasting glucose, mmol/L | 5.62 ± 1.20 | 6.99 ± 1.35 | < 0.001 |
| Total cholesterol, mmol/L | 4.24 ± 1.20 | 4.46 ± 1.31 | 0.238 |
| LDL-C, mmol/L | 2.38 ± 0.86 | 2.89 ± 0.98 | < 0.001 |
| HDL-C, mmol/L | 1.02 ± 0.45 | 0.95 ± 0.29 | 0.251 |
| Triglycerides, mmol/L | 1.99 ± 1.17 | 1.82 ± 1.15 | 0.332 |
| 25(OH) vitamin D, ng/ml | 32.05 ± 7.35 | 30.21 ± 5.02 | 0.068 |
| hs-CRP, mg/L | 5.81 ± 11.52 | 3.45 ± 2.63 | 0.102 |
| HbA1c, mmol/mol | 44.86 ± 12.35 | 55.25 ± 10.93 | < 0.001 |
| Log10VDR-MFIs, (lgRFU) | 3.25 ± 0.25 | 3.20 ± 0.24 | 0.179 |
Continuous variables were presented as mean ± S.D. for normal distribution. Student t test was used to compare the difference between groups.
Categorical variables were presented as frequency and percentage, which were compared using Chi-square test.
Fig. 3.

Correlation between log10VDR-MFIs on circulating EPCs and IFCC-HbA1c among all participants
Log10VDR-MFIs were shown to be negatively correlated with HbA1c (R = −0.472, p < 0.001). IFCC-HbA1C was transformed according to the IFCC-aligned standards for reporting HbA1C using the following formula: HbA1C (%) = HbA1C (mmol/mol)/10.929 + 2.15.
Univariate and Multivariate Logistic Regression Analysis
Among those included parameters, such as dyslipidemia, DM, age, genders, and et al., univariate logistic regression revealed that the following four variables were significantly associated with severity of CAD: DM [OR = 13.56, 95% CI (2.61–70.45), p = 0.002], HbA1c [OR = 4.37, 95% CI (1.76–10.85), p = 0.003], EPCs number [OR = 0.039, 95% CI (0.012–0.13), p = 0.001], and log10VDR-MFIs [OR = 0.025, 95% CI (0.003–0.21), p = 0.001]. Other variables including age, sex, serum lipid, and 25(OH) vitamin D levels, were not statistically significant in our analysis (Table 3). Based on the above, lower log10VDR-MFIs of circulating EPCs were significantly associated with the severity of CAD after adjusting for those covariates [OR = 0.055, 95% CI (0.006–0.508), p = 0.008] using multivariate logistic regression analysis. HbA1c and DM were not found to be significantly associated in the multivariate logistic regression analysis (Table 5). More importantly, as shown in Table 6, the results of the multivariate logistic regression analysis of variables predicting a high Syntax Score suggested that only the hypertension was independent predictor of the severity of CAD (OR = 11.82, 95% CI (3.07–45.51), p = 0.005), after adjusting for DM, dyslipidemia, fasting glucose, and HbA1c.
Table 5. Correlations between Log10VDR-MFIs on circulating EPCs and clinical features of all subjects involved.
| Variable | R-value | P-value |
|---|---|---|
| Age | 0.091 | 0.402 |
| Fasting glucose | 0.207 | 0.099 |
| Total cholesterol | 0.168 | 0.215 |
| LDL-C | 0.173 | 0.198 |
| HDL-C | 0.158 | 0.251 |
| Triglycerides | −0.122 | 0.302 |
| 25(OH) vitamin D | 0.095 | 0.430 |
| Hs-CRP | 0.053 | 0.701 |
| Syntax Score | 0.103 | 0.274 |
| HbA1c | −0.472 | < 0.001 |
Table 6. Univariate and multivariate logistic regression analysis to determine independent risk factors of CAD.
| Variables | Univariate |
P-value | Multivariate |
P-value | ||
|---|---|---|---|---|---|---|
| OR | 95%CI | OR | 95%CI | |||
| Age | 1.04 | 0.97–1.12 | 0.097 | / | / | / |
| Sex | 1.99 | 0.77–5.14 | 0.115 | / | / | / |
| Smoking history | 1.72 | 0.87–3.40 | 0.269 | / | / | / |
| Hypertension | 2.27 | 0.91–5.66 | 0.082 | / | / | / |
| Fasting glucose | 1.13 | 0.75–1.70 | 0.195 | / | / | / |
| Total cholesterol | 0.65 | 0.39–1.08 | 0.113 | / | / | / |
| LDL-C | 0.67 | 0.41–1.09 | 0.153 | / | / | / |
| HDL-C | 0.83 | 0.37–1.86 | 0.528 | / | / | / |
| Triglycerides | 1.05 | 0.86–1.28 | 0.317 | / | / | / |
| 25(OH) vitamin D | 0.94 | 0.81–1.09 | 0.206 | / | / | / |
| Hs-CRP | 0.99 | 0.96–1.02 | 0.751 | / | / | / |
| DM | 13.56 | 2.61–70.45 | 0.002 | 0.61 | 0.06–7.44 | 0.586 |
| HbA1c | 4.37 | 1.76–10.85 | 0.003 | 1.07 | 0.92–1.24 | 0.335 |
| EPCs number | 0.039 | 0.012–0.13 | 0.001 | 0.45 | 0.097–2.09 | 0.229 |
| Log10VDR-MFIs | 0.025 | 0.003–0.21 | 0.001 | 0.055 | 0.006–0.508 | 0.008 |
In order to explore the effects of high glucose on EPCs VDR expression, we analyzed the change of VDR mRNA expression by human EPCs with different culture medium. Compared with normal glucose, expressions of VDR mRNA were reduced by approximately 61% at 24 h and 82% at 48 h (Fig. 4) after changing to high glucose medium (p < 0.05), whereas no reduced levels were found with medium containing mannitol, which implied such effects were not caused by osmotic pressure change of high glucose.
Fig. 4.
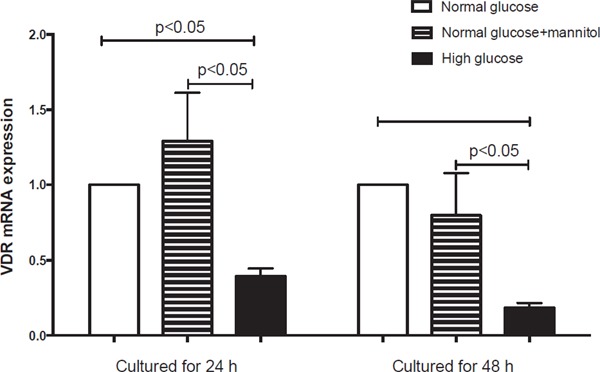
Changes of VDR mRNA expression in EPCs cultured in different medium
Compared with normal glucose cultured EPCs, expression of VDR mRNA reduced by approximately 61% at 24 h and 82% at 48 h (Fig. 4) in high glucose (p < 0.05). No reduced levels of VDR mRNA in mannitol cultured EPCs were observed compared with those in normal glucose group.
Discussion
To our knowledge, this might be the first study to evaluate the expression of VDR in circulating EPCs among CAD patients. Our observations indicated that: 1) decreased VDR expression on EPCs might be associated with CAD, and 2) persistent high serum glucose state might lower VDR expression on EPCs, which would accelerate the pathological process of atherosclerosis.
Previous studies demonstrated that among patients with diabetes circulating EPCs were shown to be lower and abnormal compared with those in non-diabetics, which could be improved by tight glycemic control24). While patients with HbA1c in the prediabetic range were shown to have a significant increase of EPCs co-expressing osteoblastic marker osteocalcin25). However, behind mechanisms is still unknown. In the condition of diabetes, the formation and accumulation of advanced glycation end products (AGEs) is accelerated, which is considered to accelerate the development of vascular atherosclerosis26–28). AGEs would impair the migration, adhesion, and secretion potential of EPCs, and promote EPCs apoptosis29). In-vitro studies demonstrated that AGEs could induce endothelial cells dysfunction by decreasing expression of endothelial nitric oxide synthase (eNOS)22, 30). High glucose was shown to promote EPCs dysfunction and apoptosis through inhibition of eNOS-AMP-activated protein kinase pathway31). All the above might contribute to endothelial dysfunction and abnormal wound healing in patients with diabetes, which would eventually lead to atherosclerosis progression.
Table 7. Univariate and multivariate logistic regression analysis to identify independent predictors of a high Syntax Score (> 22).
| Variables | Univariate |
P-value | Multivariate |
P-value | ||
|---|---|---|---|---|---|---|
| OR | 95%CI | OR | 95%CI | |||
| Age | 1.03 | 0.99–1.07 | 0.125 | / | / | / |
| Sex | 1.48 | 0.81–2.63 | 0.263 | / | / | / |
| Smoking history | 2.09 | 0.88–4.96 | 0.104 | / | / | / |
| Hypertension | 5.53 | 2.36–12.96 | 0.013 | 11.82 | 3.07–45.51 | 0.005 |
| Fasting glucose | 2.31 | 1.38–3.87 | 0.002 | 1.70 | 0.53–5.45 | 0.426 |
| Total cholesterol | 1.73 | 0.92–3.25 | 0.092 | / | / | / |
| LDL-C | 3.11 | 2.07–4.67 | 0.006 | 2.81 | 0.95–8.31 | 0.06 |
| HDL-C | 0.35 | 0.09–1.36 | 0.249 | / | / | / |
| Triglycerides | 0.88 | 0.54–1.43 | 0.481 | / | / | / |
| 25(OH) vitamin D | 0.92 | 0.84–1.01 | 0.091 | / | / | / |
| Hs-CRP | 0.93 | 0.79–1.09 | 0.314 | / | / | / |
| DM | 8.47 | 4.32–16.61 | 0.001 | 3.55 | 0.05–252.05 | 0.539 |
| HbA1c | 1.37 | 1.07–1.75 | 0.008 | 0.93 | 0.82–1.05 | 0.358 |
| EPCs number | 0.28 | 0.053–1.48 | 0.130 | / | / | / |
| Log10VDR-MFIs | 0.12 | 0.01–1.44 | 0.118 | / | / | / |
Vitamin D and VDR had been thoroughly investigated for their potentially beneficial cardiovascular effects. Data from our studies implied that the expression of VDR on EPCs was independently associated with CAD. Similarly, among hemodialysis patients, VDR-MFIs of EPCs in patients was lower than those of control, and those receiving calcitriol therapy had higher VDR-MFIs of EPCs14, 15), and while an inverse relationship between vitamin D levels and circulating EPCs levels were uncovered among patients with diabetes32). Furthermore, intravenous transfusion of EPCs overexpressing VDR could inhibit atherosclerosis in apoE-/- mice by elevating eNOS expression within arteries and serum concentration of NO33). Vitamin D could improve the angiogenic properties of EPCs34), and an in-vitro study showed that vitamin D might modulate NO metabolism and blunt the pathological effects of AGEs against EPCs30). Above all, Vitamin D and VDR might play a protective role in atherosclerotic disease by enhancing the function of EPCs and attenuating the impairment of AGEs.
While as our research demonstrated, serum levels of 25(OH) vitamin D among CAD patients were not significantly lower than those of control. A research involving 1568 community-dwelling elderly participants and following-up 4.4 years also suggested that 25(OH) vitamin D could not be used to predict the onset of peripheral artery disease35). In fact, the 1,25(OH) vitamin D, but not the 25(OH) vitamin D, is the active form of vitamin D transforming from 25(OH) vitamin D in kidney by 1α-hydroxylase36). Compared with 25(OH) vitamin D, detection serum 1,25(OH) vitamin D is a high demanding task for its low level and instability, so the serum level of 25(OH) vitamin D is often considered as the indicator of vitamin D status37). No such data are available about the association between serum level of 1,25(OH) vitamin D and atherosclerosis in human until now. Recent study showed that swine administered with vitamin D deficient diet were found with accelerated CAD progression, which implied that lower serum level of 1,25(OH) vitamin D, but not 25(OH) vitamin D would be the risk factor of atherosclerosis38).
Data from our research showed that log10VDR-MFIs were inversely associated with HbA1c, and decreased expression of VDR of EPCs challenged with high glucose. Similar data has shown that a significant decrease of VDR expression in pancreas, skeletal muscle, and adipose tissue of experimentally-induced type 2 diabetes rats compared with those of the control39). A research using osteoblast-like MG-63 cells demonstrated that high glucose would inhibit VDR expression of in such cells and subsequently impair the ability to synthesize osteocalcin, which might explain the potential mechanism of diabetic osteopenia40). Therefore, the diabetic-like environment may impair the EPCs by decreasing VDR expression, which might be partly reversed by vitamin D.
This study had several potential limitations. Firstly, the markers we used for gating EPCs only included KDR, CD34, and CD45, which might contribute to selection bias. Secondly, only the expression of VDR on EPCs was reported without such cells' function. Association of VDR on EPCs, function of EPCs, and the prognosis of CAD patients would need to be studied in the future.
In conclusion, we demonstrated a significant decrease of EPCs VDR expression among CAD patients, particularly among those with elevated HbA1c. VDR expression on EPCs would be independently correlated with HbA1c, and high glucose might lead to lower VDR expression in EPCs. EPCs with low VDR expression could play a role in the pathogenesis of CAD and might serve as a potential biomarker for evaluating the severity of CAD.
Acknowledgment
National Natural Science Foundation of China (8151101216, 91539118, 81473445, 81770352,81400336, and 81503371), Program of Shanghai Academic Research Leader (17XD1405000), Program for Outstanding Medical Academic Leader (LJRC2015-21), and Shanghai Municipal Natural Science Foundation (15401931500), supported this work.
Abbreviations
- CAD
coronary artery disease
- VDR
vitamin D receptor
- HbA1c
glycated hemoglobin
- SA
stable angina
- UA
unstable angina
- eNOS
endothelial nitric oxide synthase
- MFI
mean fluorescence intensity
- LDL-C
low-density lipoprotein cholesterol
- HDL
High-density lipoprotein cholesterol
- Hs-CRP
High-sensitive C-reactive protein
- AGEs
advanced glycation end products
- RAGE
receptor for advanced glycation end products
- FGF23
fibroblast growth factor 23
Conflict of Interests
Authors declare that there is no conflict of interests regarding the publication of this paper.
References
- 1). Ross R: Atherosclerosis--an inflammatory disease. N Engl J Med, 1999; 340: 115-126 [DOI] [PubMed] [Google Scholar]
- 2). Asahara T, Murohara T, Sullivan A, Silver M, van der Zee R, Li T, Witzenbichler B, Schatteman G, Isner JM: Isolation of putative progenitor endothelial cells for angiogen esis. Science (New York, NY), 1997; 275: 964-967 [DOI] [PubMed] [Google Scholar]
- 3). Zampetaki A, Kirton JP, Xu Q: Vascular repair by endothelial progenitor cells. Cardiovasc Res, 2008; 78: 413-421 [DOI] [PubMed] [Google Scholar]
- 4). Hughes AD, Coady E, Raynor S, Mayet J, Wright AR, Shore AC, Kooner JS, Thom SAM, Chaturvedi N: Reduced endothelial progenitor cells in European and South Asian men with atherosclerosis. Eur J Clin Invest, 2007; 37: 35-41 [DOI] [PMC free article] [PubMed] [Google Scholar]
- 5). Chi J, Hong X, Wang Y, Zhao J, Yang W: Inverse correlation between circulating endothelial progenitor cells with CD34+CD133+ and the severity of coronary atherosclerosis assessed by Syntax score. Am J Med Sci, 2014; 347: 457-462 [DOI] [PubMed] [Google Scholar]
- 6). Bettencourt N, Oliveira S, Toschke AM, Rocha J, Leite D, Carvalho M, Xara S, Schuster A, Chiribiri A, Leite-Moreira A, Nagel E, Alves H, Gama V: Predictors of circulating endothelial progenitor cell levels in patients without known coronary artery disease referred for multidetector computed tomography coronary angiography. Rev Port Cardiol, 2011; 30: 753-760 [DOI] [PubMed] [Google Scholar]
- 7). Wu J, He Z, Gao X, Wu F, Ding R, Ren Y, Jiang Q, Fan M, Liang C, Wu Z: Oxidized high-density lipoprotein impairs endothelial progenitor cells' function by activation of CD36-MAPK-TSP-1 pathways. Antioxid Redox Signal, 2015; 22: 308-324 [DOI] [PMC free article] [PubMed] [Google Scholar]
- 8). Schmidt-Lucke C, Fichtlscherer S, Aicher A, Tschope C, Schultheiss HP, Zeiher AM, Dimmeler S: Quantification of circulating endothelial progenitor cells using the modified ISHAGE protocol. PloS one, 2010; 5: e13790. [DOI] [PMC free article] [PubMed] [Google Scholar]
- 9). Gossl M, Modder UI, Atkinson EJ, Lerman A, Khosla S: Osteocalcin expression by circulating endothelial progenitor cells in patients with coronary atherosclerosis. J Am Coll Cardiol, 2008; 52: 1314-1325 [DOI] [PMC free article] [PubMed] [Google Scholar]
- 10). Flammer AJ, Gossl M, Widmer RJ, Reriani M, Lennon R, Loeffler D, Shonyo S, Simari RD, Lerman LO, Khosla S, Lerman A: Osteocalcin positive CD133+/CD34-/KDR+ progenitor cells as an independent marker for unstable atherosclerosis. Eur Heart J, 2012; 33: 2963-2969 [DOI] [PMC free article] [PubMed] [Google Scholar]
- 11). Foresta C, De Toni L, Biagioli A, Ganz F, Magagna S, Caretta N: Increased levels of osteocalcin-positive endothelial progenitor cells in patients affected by erectile dysfunction and cavernous atherosclerosis. J Sex Med, 2010; 7: 751-757 [DOI] [PubMed] [Google Scholar]
- 12). Thadhani R, Appelbaum E, Pritchett Y, Chang Y, Wenger J, Tamez H, Bhan I, Agarwal R, Zoccali C, Wanner C, Lloyd-Jones D, Cannata J, Thompson BT, Andress D, Zhang W, Packham D, Singh B, Zehnder D, Shah A, Pachika A, Manning WJ, Solomon SD: Vitamin D therapy and cardiac structure and function in patients with chronic kidney disease: the PRIMO randomized controlled trial. JAMA, 2012; 307: 674-684 [DOI] [PubMed] [Google Scholar]
- 13). Wu-Wong JR, Noonan W, Nakane M, Brooks KA, Segreti JA, Polakowski JS, Cox B: Vitamin d receptor activation mitigates the impact of uremia on endothelial function in the 5/6 nephrectomized rats. Int J Endocrinol, 2010; 2010: 625852. [DOI] [PMC free article] [PubMed] [Google Scholar]
- 14). Cianciolo G, La Manna G, Della Bella E, Cappuccilli ML, Angelini ML, Dormi A, Capelli I, Laterza C, Costa R, Alviano F, Donati G, Ronco C, Stefoni S: Effect of vitamin D receptor activator therapy on vitamin D receptor and osteocalcin expression in circulating endothelial progenitor cells of hemodialysis patients. Blood Purif, 2013; 35: 187-195 [DOI] [PubMed] [Google Scholar]
- 15). Cianciolo G, LaManna G, Cappuccilli ML, Lanci N, Della Bella E, Cuna V, Dormi A, Todeschini P, Donati G, Alviano F, Costa R, Bagnara GP, Stefoni S: VDR expression on circulating endothelial progenitor cells in dialysis patients is modulated by 25(OH)D serum levels and calcitriol therapy. Blood Purif, 2011; 32: 161-173 [DOI] [PubMed] [Google Scholar]
- 16). Levine GN, Bates ER, Bittl JA, Brindis RG, Fihn SD, Fleisher LA, Granger CB, Lange RA, Mack MJ, Mauri L, Mehran R, Mukherjee D, Newby LK, O'Gara PT, Sabatine MS, Smith PK, Smith SC, Jr.: 2016 ACC/AHA Guideline Focused Update on Duration of Dual Antiplatelet Therapy in Patients With Coronary Artery Disease: A Report of the American College of Cardiology/American Heart Association Task Force on Clinical Practice Guidelines: An Update of the 2011 ACCF/AHA/SCAI Guideline for Percutaneous Coronary Intervention, 2011 ACCF/AHA Guideline for Coronary Artery Bypass Graft Surgery, 2012 ACC/AHA/ACP/AATS/PCNA/SCAI/STS Guideline for the Diagnosis and Management of Patients With Stable Ischemic Heart Disease, 2013 ACCF/AHA Guideline for the Management of ST-Elevation Myocardial Infarction, 2014 AHA/ACC Guideline for the Management of Patients With Non-ST-Elevation Acute Coronary Syndromes, and 2014 ACC/AHA Guideline on Perioperative Cardiovascular Evaluation and Management of Patients Undergoing Noncardiac Surgery. Circulation, 2016; 134: e123-155 [DOI] [PubMed] [Google Scholar]
- 17). Jneid H: The 2012 ACCF/AHA Focused Update of the Unstable Angina/Non-ST-Elevation Myocardial Infarction (UA/NSTEMI) Guideline: a critical appraisal. Methodist DeBakey. Cardiovasc J, 2012; 8: 26-30 [DOI] [PMC free article] [PubMed] [Google Scholar]
- 18). Jneid H, Anderson JL, Wright RS, Adams CD, Bridges CR, Casey DE, Jr., Ettinger SM, Fesmire FM, Ganiats TG, Lincoff AM, Peterson ED, Philippides GJ, Theroux P, Wenger NK, Zidar JP: 2012 ACCF/AHA focused update of the guideline for the management of patients with unstable angina/non-ST-elevation myocardial infarction (updating the 2007 guideline and replacing the 2011 focused update): a report of the American College of Cardiology Foundation/American Heart Association Task Force on Practice Guidelines. J Am Coll Cardiol, 2012; 60: 645-681 [DOI] [PubMed] [Google Scholar]
- 19). Baktir AO, Dogan Y, Sarli B, Sahin O, Demirci E, Akpek M, Ozkan E, Arinc H, Saglam H: Relationship between serum 25-hydroxyvitamin D levels and the SYNTAX score in patients with acute coronary syndrome. Anatol J, 2017; 17: 293-297 [DOI] [PMC free article] [PubMed] [Google Scholar]
- 20). Chamberlain JJ, Rhinehart AS, Shaefer CF, Jr., Neuman A: Diagnosis and Management of Diabetes: Synopsis of the 2016 American Diabetes Association Standards of Medical Care in Diabetes. Ann Intern Med, 2016; 164: 542-552 [DOI] [PubMed] [Google Scholar]
- 21). Arch BN, Blair J, McKay A, Gregory JW, Newland P, Gamble C: Measurement of HbA1c in multicentre diabetes trials - should blood samples be tested locally or sent to a central laboratory: an agreement analysis. Trials, 2016; 17: 517. [DOI] [PMC free article] [PubMed] [Google Scholar]
- 22). Liang C, Ren Y, Tan H, He Z, Jiang Q, Wu J, Zhen Y, Fan M, Wu Z: Rosiglitazone via upregulation of Akt/eNOS pathways attenuates dysfunction of endothelial progenitor cells, induced by advanced glycation end products. Br J Pharmacol, 2009; 158: 1865-1873 [DOI] [PMC free article] [PubMed] [Google Scholar]
- 23). Sun C, Liang C, Ren Y, Zhen Y, He Z, Wang H, Tan H, Pan X, Wu Z: Advanced glycation end products depress function of endothelial progenitor cells via p38 and ERK 1/2 mitogen-activated protein kinase pathways. Basic Res Cardiol, 2009; 104: 42-49 [DOI] [PubMed] [Google Scholar]
- 24). Lev EI, Singer J, Leshem-Lev D, Rigler M, Dadush O, Vaduganathan M, Battler A, Kornowski R: Effect of intensive glycaemic control on endothelial progenitor cells in patients with long-standing uncontrolled type 2 diabetes. Eur J Prev Cardiol, 2014; 21: 1153-1162 [DOI] [PubMed] [Google Scholar]
- 25). Flammer AJ, Gössl M, Li J, Matsuo Y, Reriani M, Loeffler D, Simari RD, Lerman LO, Khosla S, Lerman A: Patients with an HbA1c in the Prediabetic and Diabetic Range Have Higher Numbers of Circulating Cells with Osteogenic and Endothelial Progenitor Cell Markers. J Clin Endocrinol Metab, 2012; 97: 4761-4768 [DOI] [PMC free article] [PubMed] [Google Scholar]
- 26). Brownlee M, Cerami A, Vlassara H: Advanced glycosylation end products in tissue and the biochemical basis of diabetic complications. N Engl J Med, 1988; 318: 1315-1321 [DOI] [PubMed] [Google Scholar]
- 27). Bucala R, Cerami A: Advanced glycosylation: chemistry, biology, and implications for diabetes and aging. Adv Pharmacol, 1992; 23: 1-34 [DOI] [PubMed] [Google Scholar]
- 28). Makita Z, Radoff S, Rayfield EJ, Yang Z, Skolnik E, Delaney V, Friedman EA, Cerami A, Vlassara H: Advanced glycosylation end products in patients with diabetic nephropathy. N Engl J Med, 1991; 325: 836-842 [DOI] [PubMed] [Google Scholar]
- 29). Li H, Zhang X, Guan X, Cui X, Wang Y, Chu H, Cheng M: Advanced glycation end products impair the migration, adhesion and secretion potentials of late endothelial progenitor cells. Cardiovasc Diabetol, 2012; 11: 46. [DOI] [PMC free article] [PubMed] [Google Scholar]
- 30). Talmor Y, Golan E, Benchetrit S, Bernheim J, Klein O, Green J, Rashid G: Calcitriol blunts the deleterious impact of advanced glycation end products on endothelial cells. Am J Physiol Renal Physiol, 2008; 294: F1059-1064 [DOI] [PubMed] [Google Scholar]
- 31). Tsai HY, Lin CP, Huang PH, Li SY, Chen JS, Lin FY, Chen JW, Lin SJ: Coenzyme Q10 Attenuates High Glucose-Induced Endothelial Progenitor Cell Dysfunction through AMP-Activated Protein Kinase Pathways. J Diabetes Res, 2016; 2016: 6384759. [DOI] [PMC free article] [PubMed] [Google Scholar]
- 32). Yiu YF, Chan YH, Yiu KH, Siu CW, Li SW, Wong LY, Lee SW, Tam S, Wong EW, Cheung BM, Tse HF: Vitamin D deficiency is associated with depletion of circulating endothelial progenitor cells and endothelial dysfunction in patients with type 2 diabetes. Jlin Endocrinol Metab, 2011; 96: E830-835 [DOI] [PubMed] [Google Scholar]
- 33). Xiang W, Hu ZL, He XJ, Dang XQ: Intravenous transfusion of endothelial progenitor cells that overexpress vitamin D receptor inhibits atherosclerosis in apoE-deficient mice. Biomed Pharmacother, 2016; 84: 1233-1242 [DOI] [PubMed] [Google Scholar]
- 34). Grundmann M, Haidar M, Placzko S, Niendorf R, Darashchonak N, Hubel CA, von Versen-Hoynck F: Vitamin D improves the angiogenic properties of endothelial progenitor cells. Am J Physiol Cell Physiol, 2012; 303: C954-962 [DOI] [PMC free article] [PubMed] [Google Scholar]
- 35). Veronese N, De Rui M, Bolzetta F, Toffanello ED, Coin A, Zambon S, Corti MC, Baggio G, Perissinotto E, Maggi S, Crepaldi G, Manzato E, Sergi G: Serum 25-Hydroxyvitamin D and the Incidence of Peripheral Artery Disease in the Elderly: The Pro.V.A Study. J Atheroscler Thromb, 2015; 22: 726-734 [DOI] [PubMed] [Google Scholar]
- 36). Mozos I, Marginean O: Links between Vitamin D Deficiency and Cardiovascular Diseases. Biomed Res Int, 2015; 2015: 109275. [DOI] [PMC free article] [PubMed] [Google Scholar]
- 37). Candido FG, Bressan J: Vitamin D: link between osteoporosis, obesity, and diabetes? Int J Mol Sci, 2014; 15: 6569-6591 [DOI] [PMC free article] [PubMed] [Google Scholar]
- 38). Chen S, Swier VJ, Boosani CS, Radwan MM, Agrawal DK: Vitamin D Deficiency Accelerates Coronary Artery Disease Progression in Swine. Arterioscler Thromb Vasc Biol, 2016; 36: 1651-1659 [DOI] [PMC free article] [PubMed] [Google Scholar]
- 39). Aly YE, Abdou AS, Rashad MM, Nassef MM: Effect of exercise on serum vitamin D and tissue vitamin D receptors in experimentally induced type 2 Diabetes Mellitus. J Adv Res, 2016; 7: 671-679 [DOI] [PMC free article] [PubMed] [Google Scholar]
- 40). Inaba M, Terada M, Koyama H, Yoshida O, Ishimura E, Kawagishi T, Okuno Y, Nishizawa Y, Otani S, Morii H: Influence of high glucose on 1,25-dihydroxyvitamin D3-induced effect on human osteoblast-like MG-63 cells. J Bone Miner Res, 1995; 10: 1050-1056 [DOI] [PubMed] [Google Scholar]