

Abstract
As test costs decline, whole-exome sequencing (WES) has become increasingly used for clinical diagnosis, and now represents the primary alternative to gene panel testing for patients with a suspected genetic disorder. We sought to compare the diagnostic yield of singleton-WES with simulated application of commercial gene panels in children suspected of having a genetically heterogeneous condition. Recruitment, singleton-WES and phenotype-driven variant analysis was completed for 145 paediatric patients. At recruitment, clinicians were required to propose commercial gene panel tests as an alternative to WES and nominate a phenotype-driven candidate gene list. In WES-diagnosed children, three commercial options for each proposed panel were identified and evaluated for hypothetical diagnostic yield assuming 100% analytical sensitivity and specificity. We compared the price of WES with the least costly panel in WES-diagnosed children. In WES-undiagnosed children, we evaluated the exonic coverage of their phenotype-driven gene list using aggregate data. WES diagnoses were made in genes not included in at least one-of-three commercial panels in 42% of cases. Had a panel been selected instead, 23% of WES-diagnosed children would not have been diagnosed. In 26% of cases, the least costly panel option would have been more expensive than WES. Evaluation of WES coverage found that at the most stringent level of 20× coverage, the likelihood of missing a clinically relevant variant in a candidate gene list was maximally 8%. The broader coverage of WES makes it a superior alternative to gene panel testing at similar financial cost for children with suspected complex monogenic phenotypes.
Introduction
The current options for diagnostic testing of individuals suspected of having a monogenic condition include the targeted approaches of single-gene sequencing and gene panel testing or broader approaches, such as whole-exome sequencing (WES) and whole-genome sequencing (WGS) [1, 2]. Multiplex ligation-dependent probe amplification (MLPA) or array based technologies are often used to supplement these techniques for the detection of copy number variants (CNVs). Currently, targeted panels and WES are more widely used than WGS in the clinical setting due to lower cost and more manageable data volumes [1].
Clinical utility has been demonstrated for WES and panels in the diagnosis of a range of genetically heterogeneous phenotypes [3–12]. Gene panels, which target predetermined gene-sets associated with a specific disease or condition [1], have shown diagnostic efficacy for genetically heterogeneous presentations, such as epilepsy [10], retinal dystrophy [13] and inherited cardiomyopathies [12]. WES has demonstrated diagnostic yields from 25 to 58% in phenotypically diverse populations with suspected monogenic conditions [3, 5–8, 14, 15].
Each next-generation sequencing (NGS) technology has distinct advantages and disadvantages. Gene panels, through their targeted nature, produce a lower volume of data and minimise the chance of secondary findings when compared to WES [1, 10, 16]. Panels are also commonly assumed to cost less than WES, but this is not true in all cases. Panels require regular re-design to incorporate new gene discoveries, and their data has limited use in future re-analysis of undiagnosed cases. WES offers the advantage of a less restricted approach, enabling the identification of variants at loci not considered at point of ordering and providing data for genes not yet associated with human disease, which can be re-analysed and yield diagnoses not identified at the time of initial assessment [17, 18]. Limitations of WES include the bioinformatic challenge of interpreting a large volume of data (1–2 orders of magnitude more than most gene panels) with a higher chance of identifying variants of unknown significance (VUS) and incidental findings [6, 19]. While WES offers greater breadth of coverage, it comes with some compromise in depth compared to panels [20, 21]. WES and panels are both limited in their capacity to detect certain lesions, such as low-level heteroplasmic mitochondrial genomic variants, CNVs and repetitive variations, all of which are potentially within reach of WGS. Providers of WES and targeted panels may utilise additional sequencing techniques to ‘boost’ the number of reads in genomic regions known for reduced coverage, minimising false negative results [1].
Despite their differences, both gene panel testing and WES represent suitable testing options for many patients with suspected monogenic conditions. Direct comparisons of the diagnostic performance or costs of WES with gene panel testing are limited. The current recommendations for targeted NGS are largely based on expert opinion rather than evidence [1, 2]. A key assumption underpinning these recommendations is that the superior coverage of panels will result in a higher diagnosis rate for well-defined phenotypes. A prospective study comparing the diagnostic yield and costs of WES over a targeted NGS panel done in parallel would be a costly undertaking in a clinical setting, and the variable gene content of different commercial panels complicates such a study. Lionel et al. [22] compared WGS with targeted panels done in paediatric subspecialty clinics and found diagnostic superiority of WGS. We took a novel alternative approach by simulating the application of three commercially available panels to each WES-diagnosed individual in a cohort of children with suspected monogenic disorders [14, 15] to determine the hypothetical diagnostic yield of panel testing. We sought to determine the quality of our WES data in undiagnosed individuals by assessing the depth of coverage at potentially pathogenic loci in their proposed candidate gene list. Finally, we compared the price of proposed panels with WES from our local provider.
Subjects and methods
Study participants
We undertook a retrospective simulation study of panel testing in 145 children who had undergone WES for diagnostic purposes as part of the Melbourne Genomics Health Alliance Childhood Syndromes Flagship [23]. Recruitment and sequencing are as previously described [14, 15]. In brief, participants suspected of having a genetically heterogeneous condition or features overlapping several conditions underwent WES with variants prioritised based on a phenotype-driven gene list. Phenotypes were recorded in PhenoTips [24] using standardised Human Phenotype Ontology (HPO) terms [24]. Only variants in genes known to cause human disease (the ‘Mendeliome’) were analysed. Variant classification was as recommended by the American College of Medical Genetics and Genomics standards [25].
Study procedures
Design
Simulated analysis of panel diagnostic yield
In addition to demographic data, phenotype and candidate disease gene list, at enrolment each participant’s clinician recorded alternative testing options should WES be unavailable (Fig. 1). Suggestions could either be specific (e.g., Provider X’s osteopetrosis panel) or general (e.g., “mitochondrial diseases panel”). We then selected three real-world commercial examples for the panel proposed for each diagnosed child. The selection was undertaken without knowledge of the causative gene, only the clinically suspected diagnosis at recruitment. We selected three commercial options to account for the variation that exists between panels targeting the same phenotype from different providers . Commercial providers of gene panels were identified through internet searches and the National Center for Biotechnology Information’s Genetic Testing Registry [26]. Commercial provider websites were accessed between April and June 2016 to obtain gene coverage and pricing of each panel. To be selected, each proposed panel was required to sufficiently cover the differential diagnoses provided at recruitment. If there were more than three commercial options available for each proposed panel, clinicians were asked to identify the option they would most likely order, considering each test’s gene list, cost, and previous provider experience. In two cases, clinicians could only identify two options for the proposed test, and these children were included in the analysis. For some children clinicians were unable to identify any suitable alternatives to WES because of the broad differential diagnosis list or panels could not be found containing all candidate genes. The commercial panel options for each WES-diagnosed case were analysed to determine whether the causative gene would have been identified. We took the conservative approach and assumed that the analytical sensitivity and specificity of all panels were 100%. If the panel listed the case’s causative gene (identified by WES) as a target, it was considered ‘diagnostic’.
Table 1.
Descriptive statistics of total cohort (n = 145) categorised by WES-diagnosed children and WES-undiagnosed children
| All (n = 145) | Diagnosed (n = 78) | Undiagnosed (n = 67) | p-value | |
|---|---|---|---|---|
| Age at time of consent (months) | ||||
| 0–12 months | 67 (46%) | 38 (49%) | 29 (43%) | 0.656 |
| 12–24 months | 28 (19%) | 13 (16%) | 15 (22%) | |
| >24 months | 50 (35%) | 27 (35%) | 23 (34%) | |
| Gender | ||||
| Male | 82 (57%) | 40 (51%) | 42 (63%) | 0.167 |
| Female | 63 (43%) | 38 (49%) | 25 (37%) | |
| Consanguineous parents | ||||
| Yes | 23 (16%) | 13 (17%) | 10 (15%) | 0.933 |
| No | 110 (76%) | 59 (76%) | 51 (76%) | |
| Undisclosed | 12 (8%) | 6 (8%) | 6 (9%) | |
| Deceased | ||||
| Yes | 14 (10%) | 10 (13%) | 4 (6%) | 0.164 |
| No | 131 (90%) | 68 (87%) | 63 (94%) | |
| Intellectual disability | ||||
| Yes | 62 (42.8%) | 34 (43.6%) | 28 (41.8%) | 0.827 |
| No | 83 (57.2%) | 44 (56.4%) | 39 (51.2%) | |
| Primary phenotype | ||||
| Dermatological | 4 (3%) | 2 (3%) | 2 (3%) | |
| Dysmorphic with congenital abnormalities | 65 (45%) | 33 (42%) | 32 (48%) | |
| Neurometabolic | 43 (30%) | 27 (35%) | 16 (24%) | |
| Skeletal dysplasia | 13 (9%) | 8 (10%) | 5 (7%) | |
| Ophthalmological | 4 (3%) | 2 (3%) | 2 (3%) | |
| Other | 16 (11%) | 6 (8%) | 10 (15%) | |
| WES indication | ||||
| Unclear diagnosis | 67 (46%) | 22 (28%) | 45 (67%) | <0.00001 |
| Genetically heterogeneous condition | 70 (48%) | 51 (65%) | 19 (28%) | |
| Dual diagnosis | 4 (3%) | 2 (3%) | 2 (3%) | |
| Likely variant in recently published gene(s) without commercially available test | 4 (3%) | 3 (4%) | 1 (1%) | |
| Number of candidate genes (median with 1st, 3rd quartiles) | 13.5 (7, 20.75) | 21 (11.5, 36.5) | p = 0.0048 | |
| 0–10 | 49 (34%) | 33 (42%) | 16 (24%) | |
| 11–20 | 41 (28%) | 25 (33%) | 16 (24%) | |
| 21–30 | 23 (16%) | 10 (13%) | 13 (19%) | |
| 31–40 | 10 (7%) | 1 (1%) | 9 (13%) | |
| 41–50 | 4 (3%) | 2 (3%) | 2 (3%) | |
| >50 | 18 (12%) | 7 (9%) | 11 (16%) | |
| Was there a viable panel alternative | ||||
| Yes | 86 (59%) | 57 (73%) | 29 (43%) | 0.000272 |
| No | 59 (41%) | 21 (27%) | 38 (57%) | |
All percentages are expressed in relation to the number of individuals in each column (n). Statistically significant differences were identified between diagnostic rates in those with a clinically suspected genetically heterogeneous condition compared to those with an unknown diagnosis. Those with fewer candidate genes were more likely to be WES-diagnosed, likely reflecting greater clinical certainty in their diagnosis.
WES whole-exome sequencing, SD standard deviation
Fig. 1.

Overview of study methodology and results of simulated panel analysis in WES-diagnosed children who had a viable alternative panel test option proposed. The proposed panels from three commercial providers were assessed in a simulated analysis of those who received a diagnosis by WES (n = 78). In the 57/78 (73%) WES-diagnosed children who had a panel proposed, 13/57 (23%) would have gone undiagnosed by any of the three panels proposed; 11/57 (19.3%) would have gone undiagnosed by at least one of the proposed commercial panels; and 33/57 (57.9%) would have been diagnosed by any of the three proposed panels. A panel was deemed to be diagnostic if it covered the WES-identified gene. The diagnostic yield of panel testing in the WES-undiagnosed group (n = 67) is unknown, but we sought to determine the analytical validity of WES by in silico assessment of coverage of individual phenotype-driven candidate gene lists (Fig. 2)
Price comparison analysis
We compared the price of WES against the proposed panels in each WES-diagnosed child. We identified the price of the least expensive diagnostic panel for each child who received a diagnosis and compared this to the price of WES from our local provider to determine the number of children in whom the least costly panel cost was greater than that of WES. All foreign currencies were converted to Australian Dollars (AUD) based on the exchange rate at the date of the child’s enrolment. Historical currency exchange data were obtained from the Reserve Bank of Australia [27].
Simulated analysis of WES analytical validity
We sought to assess the analytical validity of WES in the undiagnosed children by examining the exonic coverage using aggregate data from a cohort of >100 of our WES data sets. Aggregate data were used to remove confounding factors resulting from variability of quality in individual data. The per-base mean-minus-standard-deviation read coverage (adjusted coverage) was ascertained for each gene within every undiagnosed child’s candidate gene list. Human mutation databases (ClinVar and Human Gene Mutation Database) were then used to identify which of these loci were clinically relevant; i.e., had any previous attribution of pathogenicity [28, 29]. From these data, we calculated the fraction of clinically relevant loci in each child’s candidate list which fell below 20×, 10× and 5× adjusted coverage. A threshold of 20× was chosen as it reflects international NGS coverage standards and has been reported to show 99% sensitivity for single-nucleotide variants (SNV) [30–32]. A threshold of 10× coverage was also studied as it was set as the lower limit for variant curation in our study.
Statistical methods
Descriptive statistics was used to outline the study population, reported as mean ± standard deviation for normally distributed numerical variables, median + first and third quantiles for skewed numerical values and percentage/frequency for categorical variables. Studies of statistical significance were performed by χ2-test for categorical relationships, t-test for normally distributed numerical variables and Mann–Whitney U-test for skewed numerical data. Statistical significance was denoted as p < 0.05. STATA v14.0 (College Station, USA) was used for analyses [33].
Ethics approval
Ethics approval for this study was provided by a Human Research Ethics Committee (13/MH/326). All parents or guardians of each participant gave informed, written consent for WES after appropriate genetic counselling.
Results
Sample characteristics
The demographics, clinical characteristics and indications for WES in the children suspected of a monogenic disorder are published separately but summarised in Table 1 and Supplementary Table 1 [14, 15]. All children had features of a genetically heterogeneous condition or features overlapping several genetic conditions. Intellectual disability or developmental delay was a feature in 62/145 (42.8%) individuals. Children had a median of 15 candidate genes prioritised for analysis in WES data (range: 1–179).
Diagnostic yield of WES
Of the cohort of 145 children, 78 (54%) received a diagnosis by WES. Clinicians included the causative gene in their candidate list for 58/78 (74%) of WES-diagnosed children.
There was no statistical difference in the distribution of age, gender or phenotype categories between the WES-diagnosed and undiagnosed groups. Children with a clinical diagnosis of a genetically heterogeneous condition were more likely to be diagnosed compared to those with an unknown a priori diagnosis (p < 0.00001). The median number of candidate genes was significantly higher in the undiagnosed group compared to the diagnosed (21 versus 13.5 respectively; p = 0.0048).
Fifty-nine of the 145 children in this cohort had no panel testing option proposed because the differential diagnosis list was too broad. Analysing these 59 individuals further, the proportion with no panel alternative to WES was higher in those who were undiagnosed 38/67 (57%) versus those who were diagnosed 21/78 (27%) (p < 0.001). The diagnostic rate of WES for children where no option for panel testing could be identified was 21/59 (36%).
Diagnostic yield of simulated panel testing
When we simulated the application of three commercial panels to each of the WES-diagnosed children in whom alternative testing options were proposed, we found that 13/57 (22.8%) would not have been diagnosed had any of their panel options been chosen over WES. For 11/57 children (19.3%), one or two of the three options would have missed the diagnosis. For the remaining 33/57 (57.9%) children in whom a panel was proposed as an alternative, all options would have been diagnostic. Commercial panel providers are listed in Supplementary Table 2.
Price comparison
In 15/57 (26%) WES-diagnosed children for whom a panel would also have been diagnostic, the least costly diagnostic panel had a higher price than the price of WES in our study (AUD$2,000).
Analytical performance of exome sequencing
Sixty-seven children remained undiagnosed following WES and it is unknown what the yield of panel testing would have been in this group. Clinicians proposed a panel alternative in 29/67 (43.3%) of these undiagnosed children. We used in-house aggregate coverage data to evaluate the analytical validity of WES for the individual candidate gene list of each undiagnosed child (Fig. 2). Each candidate gene list was evaluated to determine the fraction of potentially pathogenic loci falling below the coverage thresholds of 20×, 10× and 5×. In all WES-undiagnosed children, <4% of potentially pathogenic loci in their gene list fell below the threshold of 10× coverage (representing the lower coverage limit for variant curation in this study); in 93% of these children, this fraction was <2%. The quality cutoff of 20× coverage has previously been cited as a recommended minimum depth for analysis [30–32]. Less than 8% of potentially pathogenic loci fell below 20× coverage in the gene lists of the undiagnosed individuals; for all children, the fraction of potentially pathogenic loci falling below 20× was <5%.
Fig. 2.
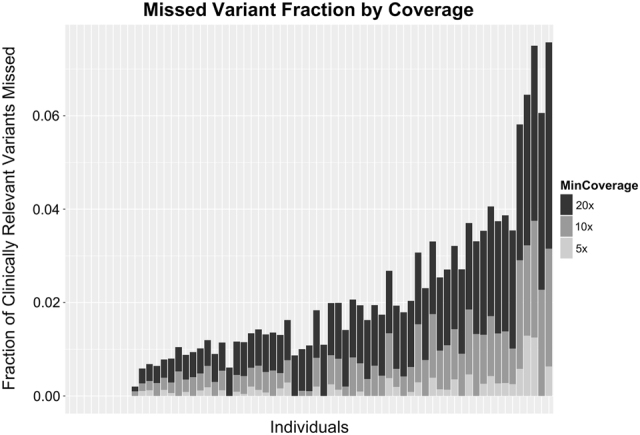
Fraction of clinically relevant loci in WES-undiagnosed children’s candidate gene lists falling below three thresholds of coverage quality. At least 92% of potentially pathogenic (clinically relevant) loci in all undiagnosed children’s gene lists were covered by 20 reads or more. At least 96% of potentially pathogenic loci were in regions with >10× coverage. Each bar represents an individual child’s gene list. Note that in the first nine WES-undiagnosed children, 100% of potentially pathogenic loci in their candidate gene list were covered (hence no bar). The variability in the fractions falling below the three quality thresholds is reflective of the different genic content of individual gene lists. Potentially pathogenic loci are defined as those with any entry with attributed pathogenicity in HGMD or ClinVar at the time of analysis [28, 29]. A threshold of 10× represents the lower limit of variant curation for our study, 20× represents a commonly cited threshold at which 99% of single-nucleotide variants (SNVs) are detected [30–32]
Discussion
WES and gene panels are emerging as essential tools for the investigation of individuals with undiagnosed and heterogeneous monogenic conditions, with both seeing widespread uptake in the clinical setting. However, evidence to guide the most effective use of these testing alternatives is required. The clinician’s choice of WES or panel testing for a patient requires consideration of the a priori clinical hypothesis, cost, methodology and gene coverage. We sought to simulate how well panel testing might have performed against WES in children with genetically heterogeneous conditions or features overlapping multiple conditions.
Our primary aim was to determine the proportion of WES-diagnosed children whose causative gene would have been covered by gene panels proposed at recruitment as alternative testing options. We identified three commercial options for the panels proposed for each WES-diagnosed child. Although the causative gene was included in all commercial panel options for 33/57 (57.9%) of WES-diagnosed children, at least one of the panels would have missed the diagnosis in 24/57 (42.1%). Indeed, when we consider that 21/78 of the WES-diagnosed group did not have a viable panel alternative proposed, only 33/78 (42.3%) of all WES-diagnosed children would have been confidently diagnosed by gene panel. This finding highlights the limitation of using a panel with its restricted gene list in clinically complex phenotypes, and in detection of atypical presentations of known monogenic conditions.
While panel testing may be a better option for testing in patients with well-defined phenotypes for which the genetic aetiology is well described [34], this may not apply to children with features overlapping multiple conditions or less differentiated phenotypes. Our finding that none of the three simulated commercial panels covered the causative gene for nearly 1 in 4 WES-diagnosed children suggests that panels miss diagnoses in patients with suspected Mendelian disorders which are detectable by WES [6, 16, 34, 35], and underscores the utility of WES when the a priori clinical hypothesis is imprecise. One possible explanation for this finding could be poor clinical acumen of clinicians at point of panel-choice; however, the fact that the phenotype-driven gene lists defined at enrolment by the same clinicians contained the causative gene for 74% of the WES-diagnosed group argues against this notion. If testing was initiated by non-geneticist sub-specialists, a narrower differential diagnosis may result because of a focus on genes familiar to that specialist. This might lower the diagnostic yield of panel testing or result in consecutive gene panels being ordered, which is inefficient and costly. New gene discoveries for different phenotypes, as well as the expansion of traditional phenotypes associated with mutations in a given gene are likely to be contributing factors to our finding that panels may have missed diagnoses.
A second aim was to examine the consistency of gene content in commercially available panels and evaluate its impact on diagnosis. In 19.3% of WES-diagnosed children, we found that one or two of the three commercial panels proposed as an alternative to WES would have missed the diagnosis. This finding highlights the variability of gene content between different panels targeting similar phenotypes. The variation in gene panels complicates selection at point of ordering and may result in a missed diagnosis because the causative gene was not covered by the chosen panel. This was a frequent finding in a study that demonstrated a higher diagnostic rate of whole-genome sequencing (41%) compared to panels (24%) and conventional testing in a cohort of children with well characterised heterogeneous rare disease phenotypes [22]. Our finding underscores the challenge faced by clinicians in the selection of a panel most appropriate for their patient, and confirms that panel use should be limited to patients with a narrow differential diagnosis.
Several studies of patient populations with single-system or clearly defined phenotypes show that the use of a targeted panel in such populations is superior to WES due to increased depth and coverage of target genes [9, 16, 20, 36, 37]. Our findings do not refute this notion; in sub-group analysis WES was at its most potent in patients with an unknown a priori diagnosis. While these data may be less applicable to an adult patient population with single-system disease, our study reflects the ‘real-world’ paediatric clinical setting in the selection of test options for a heterogeneous population based on clinician judgement with a range of presentations. Our findings support the selection of WES over a panel when faced with the diagnostic challenge of a child having an undifferentiated or complex phenotype.
For many clinicians, test cost is a key determinant of test selection. In the Australian context, in 26% of cases, the least costly panel option would still have been more expensive than WES. This refutes the frequently held assumption that WES is a more expensive test option than panels. Furthermore, the sequential ordering of multiple panels in a child with a complex phenotype is costly and inefficient.
While singleton WES was successful for many children, a substantial proportion of our cohort (67/145 (46%)) remains undiagnosed. The potential reasons for this are varied, including non-detection of small CNVs below the resolution of a standard microarray, deep intronic variants not captured by WES, and causative variants in genes not yet associated with human disease. Data re-analysis with updated Mendeliome and improved bioinformatics [17] or adding parental sequencing as a trio [38, 39] might yield additional diagnoses.
A limitation of our study relates to the patients who did not receive a diagnosis by WES. We cannot be certain of the proportion of these undiagnosed children in whom panel testing would have made a diagnosis. Limitations of NGS sequencing are known to result in false-negatives; some studies have suggested that WES sequencing coverage is poorer than that of gene panel [40], and others have proposed WGS to capture deep intronic variants or small copy number changes not detectable by WES [22]. Many commercial providers supplement panel analysis with MLPA and array technologies for detection of CNVs, and ‘boosted’ Sanger sequencing for low coverage regions, but these incur additional expense and their diagnostic value is unknown. It is possible that had we actually proceeded with each proposed panel with supplemented analysis, the diagnostic yield may have been higher due to diagnoses in children who were not diagnosed by WES.
We sought to address the limitation of our approach by evaluating the coverage performance of WES, aiming to determine the likelihood that WES missed clinically relevant variants in the candidate gene lists of our undiagnosed group (n = 67). Our analysis showed that at the most stringent level of 20× coverage, the likelihood of missing a known clinically relevant variant in a patient’s candidate gene list was maximally 8%. This finding is supported by a recent study where WES was shown to adequately cover 98.6% of pathogenic variants when compared in silico with data from targeted NGS panels and validated against records from ExAC [41]. Together, these data suggest that the minor differences between panel and WES coverage performance have minimal impact on diagnosis rates.
The retrospective nature of our simulated evaluation may have over-estimated the hypothetical yield of the targeted panels. While all the panel suggestions in our study were recorded at recruitment, our analysis was not performed until all WES results had been confirmed in 2016. Consequently, the panel gene lists we considered were from 2016 rather than at the time of recruitment in 2014–2015. The gene lists of most of the panels would likely have been updated with new disease genes in the period between recruitment and analysis, potentially leading to some over-estimation of the diagnostic yield. This further serves to highlight that one of the advantages of WES is the enduring relevance of its data, which can be periodically re-analysed, which has been reported to add a further 10% to diagnostic yield [17]. This is in contrast to panels which require re-design to incorporate newly discovered genes, with further costs incurred with repeat testing.
The data from our study provides practical insights into the application of targeted NGS diagnostics and from a cost and diagnosis viewpoint supports the use of WES in paediatric patients, particularly those with multi-system phenotypes and no clinical diagnosis. In our cohort, had a panel been selected instead, 1 in 4 of WES-diagnosed children would have been undiagnosed. Panels have an established clinical role in the investigation of a strong clinical diagnosis with well-defined aetiology (e.g., inherited cardiomyopathies and retinal dystrophy), however our study demonstrates superior diagnostic performance of WES in a paediatric setting with heterogeneous or poorly defined phenotypes. With further improvement in WES mapping and capture techniques, we expect the costs and difference in analytical quality between WES and panels to decrease. In children with suspected monogenic conditions, we recommend the use of WES with phenotype-driven gene lists acting as a ‘virtual panel’, with the option of expanding analysis to include the Mendeliome as the most effective diagnostic tool, offering the advantage of being able to analyse genes beyond the a priori hypothesis, and then re-analyse as new genes are discovered in the future.
Electronic supplementary material
Acknowledgements
The authors are grateful to all the children and families involved in this study. Statistical support was provided by Susan Donath from the Clinical Epidemiology and Biostatistics Unit of the Murdoch Children’s Research Institute. Genetic counselling support was provided by the Melbourne Genomics funded genetic counsellors and data-management support from Nessie Mupfeki. Systems and standards support was provided by the Clinical Genomics and Bioinformatics Advisory Group and the Clinical Genomics Advisory Group. The study was funded by the founding organisations of the Melbourne Genomics Health Alliance (Royal Melbourne Hospital, Royal Children’s Hospital, University of Melbourne, Walter and Eliza Hall Institute, Murdoch Children’s Research Institute, Australian Genome Research Facility and CSIRO) and the State Government of Victoria (Department of Health and Human Services). The involvement of AGRF was supported by sponsorship from Bioplatforms Australia and the NCRIS program. Further support and backing for this study was provided by the Royal Children’s Hospital, Melbourne and Victorian Clinical Genetics Services staff for referring patients.
Compliance with Ethical Standards
Conflict of interest
The authors declare that they have no conflict of interest.
Footnotes
Susan M. White and Tiong Yang Tan are equal senior authors.
Contributor Information
Susan M. White, Phone: +61383416201, Email: sue.white@vcgs.org.au
Tiong Yang Tan, Phone: +61383416201, Email: tiong.tan@vcgs.org.au.
Electronic supplementary material
The online version of this article (10.1038/s41431-018-0099-1) contains supplementary material, which is available to authorized users.
References
- 1.Xue Y, Ankala A, Wilcox WR, Hegde MR. Solving the molecular diagnostic testing conundrum for Mendelian disorders in the era of next-generation sequencing: single-gene, gene panel, or exome/genome sequencing. Genet Med. 2015;17:444–51. doi: 10.1038/gim.2014.122. [DOI] [PubMed] [Google Scholar]
- 2.Jamuar SS, Tan EC. Clinical application of next-generation sequencing for Mendelian diseases. Hum Genom. 2015;9:10. doi: 10.1186/s40246-015-0031-5. [DOI] [PMC free article] [PubMed] [Google Scholar]
- 3.Sawyer SL, Hartley T, Dyment DA, et al. Utility of whole-exome sequencing for those near the end of the diagnostic odyssey: time to address gaps in care. Clin Genet. 2016;89:275–84. doi: 10.1111/cge.12654. [DOI] [PMC free article] [PubMed] [Google Scholar]
- 4.Deciphering Developmental Disorders Study. Large-scale discovery of novel genetic causes of developmental disorders. Nature. 2015;519:223–8. doi: 10.1038/nature14135. [DOI] [PMC free article] [PubMed] [Google Scholar]
- 5.Yang Y, Muzny DM, Xia F, et al. Molecular findings among patients referred for clinical whole-exome sequencing. JAMA. 2014;312:1870–9. doi: 10.1001/jama.2014.14601. [DOI] [PMC free article] [PubMed] [Google Scholar]
- 6.Yang Y, Muzny DM, Reid JG et al. Clinical whole-exome sequencing for the diagnosis of mendelian disorders. http://dxdoior/101056/NEJMoa1306555 2013. [DOI] [PMC free article] [PubMed]
- 7.Lee H, Deignan JL, Dorrani N, et al. Clinical exome sequencing for genetic identification of rare Mendelian disorders. JAMA. 2014;312:1880–7. doi: 10.1001/jama.2014.14604. [DOI] [PMC free article] [PubMed] [Google Scholar]
- 8.Neveling K, Feenstra I, Gilissen C, et al. A post-hoc comparison of the utility of sanger sequencing and exome sequencing for the diagnosis of heterogeneous diseases. Hum Mutat. 2013;34:1721–6. doi: 10.1002/humu.22450. [DOI] [PubMed] [Google Scholar]
- 9.de Koning TJ, Jongbloed JD, Sikkema-Raddatz B, Sinke RJ. Targeted next-generation sequencing panels for monogenetic disorders in clinical diagnostics: the opportunities and challenges. Expert Rev Mol Diagn. 2015;15:61–70. doi: 10.1586/14737159.2015.976555. [DOI] [PubMed] [Google Scholar]
- 10.Wang J, Gotway G, Pascual JM, Park JY. Diagnostic yield of clinical next-generation sequencing panels for epilepsy. JAMA Neurol. 2014;71:650–1. doi: 10.1001/jamaneurol.2014.405. [DOI] [PubMed] [Google Scholar]
- 11.Shashi V, McConkie-Rosell A, Rosell B, et al. The utility of the traditional medical genetics diagnostic evaluation in the context of next-generation sequencing for undiagnosed genetic disorders. Genet Med. 2014;16:176–82. doi: 10.1038/gim.2013.99. [DOI] [PubMed] [Google Scholar]
- 12.Ouellette AC, Mathew J, Manickaraj AK, et al. Clinical genetic testing in pediatric cardiomyopathy: is bigger better? Clin Genet. 2017;93:33–40. doi: 10.1111/cge.13024. [DOI] [PubMed] [Google Scholar]
- 13.Glockle N, Kohl S, Mohr J, et al. Panel-based next generation sequencing as a reliable and efficient technique to detect mutations in unselected patients with retinal dystrophies. Eur J Hum Genet. 2014;22:99–104. doi: 10.1038/ejhg.2013.72. [DOI] [PMC free article] [PubMed] [Google Scholar]
- 14.Stark Z, Tan TY, Chong B, et al. A prospective evaluation of whole-exome sequencing as a first-tier molecular test in infants with suspected monogenic disorders. Genet Med. 2016;18:1090–6. doi: 10.1038/gim.2016.1. [DOI] [PubMed] [Google Scholar]
- 15.Tan TY, Dillon OJ, Stark Z, et al. Diagnostic impact and cost-effectiveness of whole-exome sequencing for ambulant children with suspected monogenic conditions. JAMA Pediatr. 2017;171:855–62. doi: 10.1001/jamapediatrics.2017.1755. [DOI] [PMC free article] [PubMed] [Google Scholar]
- 16.Group SM. Comprehensive gene panels provide advantages over clinical exome sequencing for Mendelian diseases. Genome Biol. 2015;16:134. doi: 10.1186/s13059-015-0693-2. [DOI] [PMC free article] [PubMed] [Google Scholar]
- 17.Wenger AM, Guturu H, Bernstein JA, Bejerano G. Systematic reanalysis of clinical exome data yields additional diagnoses: implications for providers. Genet Med. 2017;19:209–14. doi: 10.1038/gim.2016.88. [DOI] [PubMed] [Google Scholar]
- 18.Eldomery MK, Coban-Akdemir Z, Harel T, et al. Lessons learned from additional research analyses of unsolved clinical exome cases. Genome Med. 2017;9:26. doi: 10.1186/s13073-017-0412-6. [DOI] [PMC free article] [PubMed] [Google Scholar]
- 19.Lawrence L, Sincan M, Markello T, et al. The implications of familial incidental findings from exome sequencing: the NIH Undiagnosed Diseases Program experience. Genet Med. 2014;16:741–50. doi: 10.1038/gim.2014.29. [DOI] [PMC free article] [PubMed] [Google Scholar]
- 20.Ankala A, da Silva C, Gualandi F, et al. A comprehensive genomic approach for neuromuscular diseases gives a high diagnostic yield. Ann Neurol. 2015;77:206–14. doi: 10.1002/ana.24303. [DOI] [PubMed] [Google Scholar]
- 21.Kammermeier J, Drury S, James CT, et al. Targeted gene panel sequencing in children with very early onset inflammatory bowel disease--evaluation and prospective analysis. J Med Genet. 2014;51:748–55. doi: 10.1136/jmedgenet-2014-102624. [DOI] [PubMed] [Google Scholar]
- 22.Lionel AC, Costain G, Monfared N, et al. Improved diagnostic yield compared with targeted gene sequencing panels suggests a role for whole-genome sequencing as a first-tier genetic test. Genet Med. 2017 Aug 3. 10.1038/gim.2017.119. [Epub ahead of print]. [DOI] [PMC free article] [PubMed]
- 23.Gaff CL, M. Winship I, M. Forrest S, et al. Preparing for genomic medicine: a real world demonstration of health system change. npj Genom Med. 2017;2:16. doi: 10.1038/s41525-017-0017-4. [DOI] [PMC free article] [PubMed] [Google Scholar]
- 24.Girdea M, Dumitriu S, Fiume M, et al. PhenoTips: patient phenotyping software for clinical and research use. Hum Mutat. 2013;34:1057–65. doi: 10.1002/humu.22347. [DOI] [PubMed] [Google Scholar]
- 25.Richards CS, Bale S, Bellissimo DB, et al. ACMG recommendations for standards for interpretation and reporting of sequence variations: revisions 2007. Genet Med. 2008;10:294–300. doi: 10.1097/GIM.0b013e31816b5cae. [DOI] [PubMed] [Google Scholar]
- 26.Rubinstein WS, Maglott DR, Lee JM, et al. The NIH genetic testing registry: a new, centralized database of genetic tests to enable access to comprehensive information and improve transparency. Nucleic Acids Res. 2013;41:D925–935. doi: 10.1093/nar/gks1173. [DOI] [PMC free article] [PubMed] [Google Scholar]
- 27.Australia RBo: Historical Data | RBA: Exachange Rates—Daily—2014 to Current. http://www.rba.gov.au/statistics/historical-data.html: @RBAInfo, 2014.
- 28.Landrum MJ, Lee JM, Benson M, et al. ClinVar: public archive of interpretations of clinically relevant variants. Nucleic Acids Res. 2016;44:D862–868. doi: 10.1093/nar/gkv1222. [DOI] [PMC free article] [PubMed] [Google Scholar]
- 29.Stenson PD, Mort M, Ball EV, Shaw K, Phillips AD, Cooper DN. The Human Gene Mutation Database: building a comprehensive mutation repository for clinical and molecular genetics, diagnostic testing and personalized genomic medicine. Hum Genet. 2014;133:1–9. doi: 10.1007/s00439-013-1358-4. [DOI] [PMC free article] [PubMed] [Google Scholar]
- 30.Rehm HL, Bale SJ, Bayrak-Toydemir P, et al. ACMG clinical laboratory standards for next-generation sequencing. Genet Med. 2013;15:733–47. doi: 10.1038/gim.2013.92. [DOI] [PMC free article] [PubMed] [Google Scholar]
- 31.Weiss MM, Van der Zwaag B, Jongbloed JD, et al. Best practice guidelines for the use of next-generation sequencing applications in genome diagnostics: a national collaborative study of Dutch genome diagnostic laboratories. Hum Mutat. 2013;34:1313–21. doi: 10.1002/humu.22368. [DOI] [PubMed] [Google Scholar]
- 32.Meynert AM, Ansari M, FitzPatrick DR, Taylor MS. Variant detection sensitivity and biases in whole genome and exome sequencing. BMC Bioinform. 2014;15:247. doi: 10.1186/1471-2105-15-247. [DOI] [PMC free article] [PubMed] [Google Scholar]
- 33.StataCorp. Stata Statistical Software: Release 14. College Station, TX: StataCorp LP; 2015. [Google Scholar]
- 34.Consugar MB, Navarro-Gomez D, Place EM, et al. Panel-based genetic diagnostic testing for inherited eye diseases is highly accurate and reproducible, and more sensitive for variant detection, than exome sequencing. Genet Med. 2015;17:253–61. doi: 10.1038/gim.2014.172. [DOI] [PMC free article] [PubMed] [Google Scholar]
- 35.Soden SE, Saunders CJ, Willig LK, et al. Effectiveness of exome and genome sequencing guided by acuity of illness for diagnosis of neurodevelopmental disorders. Sci Transl Med. 2014;6:265ra168. doi: 10.1126/scitranslmed.3010076. [DOI] [PMC free article] [PubMed] [Google Scholar]
- 36.Blue GM, Kirk EP, Giannoulatou E, et al. Targeted next-generation sequencing identifies pathogenic variants in familial congenital heart disease. J Am Coll Cardiol. 2014;64:2498–506. doi: 10.1016/j.jacc.2014.09.048. [DOI] [PubMed] [Google Scholar]
- 37.Lim EC, Brett M, Lai AH, et al. Next-generation sequencing using a pre-designed gene panel for the molecular diagnosis of congenital disorders in pediatric patients. Hum Genom. 2015;9:33. doi: 10.1186/s40246-015-0055-x. [DOI] [PMC free article] [PubMed] [Google Scholar]
- 38.Farwell KD, Shahmirzadi L, El-Khechen D, et al. Enhanced utility of family-centered diagnostic exome sequencing with inheritance model-based analysis: results from 500 unselected families with undiagnosed genetic conditions. Genet Med. 2015;17:578–86. doi: 10.1038/gim.2014.154. [DOI] [PubMed] [Google Scholar]
- 39.Retterer K, Juusola J, Cho MT, et al. Clinical application of whole-exome sequencing across clinical indications. Genet Med. 2015;18:696–704. doi: 10.1038/gim.2015.148. [DOI] [PubMed] [Google Scholar]
- 40.Chang YS, Huang HD, Yeh KT, Chang JG. Evaluation of whole exome sequencing by targeted gene sequencing and Sanger sequencing. Clin Chim Acta. 2017;471:222–32. doi: 10.1016/j.cca.2017.06.015. [DOI] [PubMed] [Google Scholar]
- 41.LaDuca H, Farwell KD, Vuong H, et al. Exome sequencing covers > 98% of mutations identified on targeted next generation sequencing panels. PLoS ONE. 2017;12:e0170843. doi: 10.1371/journal.pone.0170843. [DOI] [PMC free article] [PubMed] [Google Scholar]
Associated Data
This section collects any data citations, data availability statements, or supplementary materials included in this article.