

Abstract
Genome-wide association studies (GWAS) have identified >250 loci for body mass index (BMI), implicating pathways related to neuronal biology. Most GWAS loci represent clusters of common, non-coding variants from which pinpointing causal genes remains challenging. Here, we combined data from 718,734 individuals to discover rare and low-frequency (MAF<5%) coding variants associated with BMI. We identified 14 coding variants in 13 genes, of which eight in genes (ZBTB7B, ACHE, RAPGEF3, RAB21, ZFHX3, ENTPD6, ZFR2, ZNF169) newly implicated in human obesity, two (MC4R, KSR2) previously observed in extreme obesity, and two variants in GIPR. Effect sizes of rare variants are ~10 times larger than of common variants, with the largest effect observed in carriers of an MC4R stop-codon (p.Tyr35Ter, MAF=0.01%), weighing ~7kg more than non-carriers. Pathway analyses confirmed enrichment of neuronal genes and provide new evidence for adipocyte and energy expenditure biology, widening the potential of genetically-supported therapeutic targets to treat obesity.
Obesity is a heritable disease and represents a major unmet public health problem with only a few safe and long-term effective therapies1 and intervention strategies2. To understand the genetic basis of obesity and identify potential targets for new therapies, genome-wide association studies (GWAS) for body mass index (BMI) and obesity risk have identified >250 common variants over the past decade3–7. Consistent with single-gene disorders of obesity8, tissue expression and gene-set enrichment analyses for genes in BMI-associated loci have shown that the central nervous system (CNS) plays a critical role in body weight regulation5. While the numerous GWAS loci have provided insight into broad biological mechanisms underlying body weight regulation, pinpointing the causal gene(s)/variant(s) remains a major challenge9, as GWAS-identified variants are typically non-coding and may affect genes at long distance. The association of intronic FTO variants with BMI illustrates the challenges of identifying causal regulatory effects. The proposed causal variant was found to regulate the expression of nearby RPGRIP1L in some studies10–12, whereas others found that it regulates distant IRX3/IRX5 genes in specific cell types13,14.
To expedite mapping of obesity-related genes, we performed an exome-wide search for low-frequency (LF, minor allele frequency [MAF]=1–5%) and rare (R, MAF<1%) single nucleotide variants (SNVs) associated with BMI using exome-targeted genotyping arrays. A total of 125 studies (Nindividuals=718,734) performed single-variant association between up to 246,328 SNVs and BMI. In addition, we performed gene-based meta-analyses to aggregate rare and LF (R/LF) coding SNVs across 14,541 genes. Using genetic, functional and computational follow-up analyses, we gained insights into the function of BMI-implicated genes, and the biological pathways through which they may influence body weight.
RESULTS
Fourteen rare and low-frequency coding variants in 13 genes
Our study comprises a discovery and a follow-up stage (Supplementary Figure 1, Supplementary Tables 1–3, Online Methods). In our primary analysis, the discovery stage includes data from 123 studies (Nmax=526,508) across five ancestry groups, predominantly European (~85%). Each study performed single-variant association analyses of coding variants present on the exome array, including up to 13,786 common (MAF>5%) and 215,917 R/LF coding SNVs (exons and splicing sites). Summary statistics were combined using fixed-effect meta-analyses. SNV-associations of R/LF variants that reached suggestive significance (P<2.0×10⁻⁶) were taken forward for follow-up in two European cohorts, deCODE (Nmax=72,613) and UK Biobank (Nmax=119,613 [interim release]). Overall significance was assessed after combining results of discovery and follow-up studies into a final meta-analysis (all-ancestries, sex-combined, additive model, Nmax=718,734); SNV-associations that reached P<2×10⁻⁷ were considered array-wide significant15,16 (Table 1, Supplementary Table 4, Supplementary Figures 2–4). In secondary analyses, we performed sex-specific analyses, analyses limited to individuals of European ancestry, and analyses using a recessive model.
Table 1.
Rare and low-frequency coding variants significantly associated with BMI
| Chr:position | Variant | Coding locus |
Allele | Amino acid change |
EAF (%) |
β (SD/allele) |
SE | P-value | N | Explained variance (%) |
|
|---|---|---|---|---|---|---|---|---|---|---|---|
|
|
|||||||||||
| Effect | Other | ||||||||||
| All-ancestries additive | |||||||||||
| 1:154987704 | rs141845046 | ZBTB7B* | T | C | p.Pro190Ser | 2.44% | 0.048 | 0.006 | 7.73E-18 | 718,628 | 0.011% |
| 7:100490797 | rs1799805 | ACHE* | T | G | p.His353Asn | 3.90% | 0.029 | 0.005 | 2.82E-10 | 707,448 | 0.006% |
| 12:48143315 | rs145878042 | RAPGEF3* | G | A | p.Leu300Pro | 1.10% | 0.066 | 0.008 | 1.56E-15 | 700,852 | 0.010% |
| 12:49399132 | rs1126930 | PRKAG1 | C | G | p.Thr38Ser | 3.22% | 0.034 | 0.005 | 3.98E-12 | 712,354 | 0.007% |
| 12:72179446 | rs61754230 | RAB21* | T | C | p.Ser224Phe | 1.74% | 0.040 | 0.007 | 1.33E-09 | 693,373 | 0.005% |
| 12:117977550 | rs56214831 | KSR2 | T | C | p.Arg525Gln | 0.82% | 0.057 | 0.010 | 1.08E-08 | 655,049 | 0.005% |
| 12:123345509 | rs34149579 | HIP1R | T | G | p.Cys938Phe | 4.54% | −0.032 | 0.004 | 2.00E-14 | 716,253 | 0.009% |
| 16:72830539 | rs62051555 | ZFHX3* | G | C | p.Gln1100His | 4.34% | −0.024 | 0.004 | 4.01E-08 | 690,637 | 0.005% |
| 18:58039478 | rs13447324 | MC4R | T | G | p.Tyr35Ter | 0.01% | 0.542 | 0.086 | 2.26E-10 | 631,683 | 0.006% |
| 19:46178020 | rs139215588 | GIPR | A | G | p.Arg190Gln | 0.11% | −0.148 | 0.028 | 1.25E-07 | 695,800 | 0.005% |
| 19:46180976 | rs143430880 | GIPR | G | A | p.Glu288Gly | 0.13% | −0.153 | 0.028 | 2.96E-08 | 599,574 | 0.006% |
| 20:25195509 | rs6050446 | ENTPD6* | A | G | p.Lys185Glu | 2.71% | −0.034 | 0.005 | 2.40E-10 | 717,084 | 0.006% |
| All-ancestries sex-specific additive (women only) | |||||||||||
| 19:3813906 | rs45465594 | ZFR2* | C | A | p.Ile718Met | 2.55% | −0.040 | 0.008 | 1.94E-07 | 373,848 | 0.008% |
| European Ancestry additive | |||||||||||
| 9:97062981 | rs12236219 | ZNF169* | T | C | p.Arg381Cys | 4.23% | −0.029 | 0.005 | 8.78E-10 | 612,396 | 0.007% |
Array-wide significant is defined as P < 2×10⁻⁷.
Variant positions are reported according to Build 37 and their alleles are coded based on the positive strand.
Alleles (effect/other), effect allele frequency (EAF), beta (b), standard error (SE) and P values are based on the meta-analysis of Discovery Stage (GIANT) and Validations stage (deCODE, UKBiobank) studies. Effect allele is always the minor allele. Effects (b) are expressed in SD, assuming mean=0 and SD=1.
The amino acid change from the most abundant coding transcript is shown in this table (see Supplementary Table 25 for more details on protein annotation based on VEP tool and transcript abundance from GTEx database).
Novel gene; i.e. not previously implicated in human obesity
In our primary analysis of R/LF variants, we identified five rare SNVs in three genes (KSR2, 2 in MC4R, 2 in GIPR) and nine LF SNVs in eight genes (ZBTB7B, 2 in ACHE, RAPGEF3, PRKAG1, RAB21, HIP1R, ZFHX3, ENTPD6) (Table 1, Box 1, Supplementary Table 5, Supplementary Figure 3a). In secondary analyses, we identified two additional LF SNVs; one in all-ancestry women-only (ZFR2) and one in European ancestry only analyses (ZNF169) (Table 1, Supplementary Tables 6–8, Supplementary Figures 3b, 3c). Of these 16 SNVs, located in 13 genes, the two SNVs in MC4R (r2=1; D’=1) and two in ACHE (r2=0.98; D’=0.99) were in high LD, whereas the two SNVs in GIPR (r2=0; D’=0.16) were independent of each other. Hence, the 16 SNVs represent 14 independent SNVs (4 rare, 10 LF), of which eight locate in genes not previously implicated in BMI (ZBTB7B, ACHE, RAPGEF3, RAB21, ZFHX3, ENTPD6, ZFR2, ZNF169), and six are located in five loci that were previously identified by GWAS (PRKAG1/BCDIN3D, HIP1R/CLIP1, MC4R, GIPR/QPCTL)5 and/or through sequencing of severe early-onset obesity cases (MC4R, KSR2)17–19 (Supplementary Figure 5). Conditional analyses established that coding SNVs in PRKAG1, MC4R and GIPR are independent of the common lead variants in GWAS loci (rs7138803, rs17782313, rs2287019, respectively), whereas the SNV in HIP1R and GWAS locus near CLIP1 (rs11057405) represent the same signal (Online Methods, Supplementary Tables 9, 10, Supplementary Figure 5).
BOX 1. Brief description of the 13 genes (alphabetical) identified.
ACHE (acetylcholinesterase). ACHE is mainly expressed in brain and muscle76. Its encoded protein hydrolyzes acetylcholine (Ach) at brain cholinergic synapses and neuromuscular junctions, and thus terminates signal transmission67. Knockout mice showed a reduction in expression of muscarinic Ach receptors in brain regions associated with learning and memory and showed lower ability to initiate the signaling cascade77. This gene has fewer missense variants than expected and is highly intolerant to loss of function (LoF) mutations52.
ENTPD6 (ectonucleoside triphosphate diphosphohydrolase 6). Previously known as Interleukin 6 Signal Transducer-2, this gene is similar to E-type nucleotidases that participate in purine and pyrimidine metabolism, calcium ion binding, hydrolase activity, magnesium ion binding and nucleoside-diphosphatase activity78. It is widely expressed in many different tissues, in particular in the brain76.
GIPR (gastric inhibitory polypeptide receptor). GIPR encodes a G-protein coupled receptor for gastric inhibitory polypeptide that is secreted by intestinal K-cells after food ingestion59. GIPR activation stimulates insulin secretion from pancreatic β-cells and mediates fat deposition by increasing lipoprotein lipase activity, lipogenesis, fatty acid and glucose uptake in adipocytes. GIPR is mostly expressed in EBV-transformed lymphocytes, stomach and visceral adipose tissue76.
HIP1R (huntingtin interacting protein 1 related). HIP1R is a multi-domain protein that promotes actin binding and cell survival and interacts with CLTB and HIP1 (GeneCards). HIP1 and HIP1R appear to play central roles in clathrin-coated vesicle formation and intracellular membrane trafficking by promoting transient interaction between actin filaments and the endocytic machinery79,80. HIP1R is most expressed in the stomach tissue, brain (substantia nigra, spinal cord, hippocampus), and sun-exposed skin76.
KSR2 (kinase suppressor of ras 2). KSR2 is an intracellular protein that functions as a molecular scaffold to regulate MAP kinases ERK1/2 and determine cell fates. KSR2 also regulates AMPK activity controlling cellular thermogenesis, fat oxidation, and glucose metabolism18,61,62. Knockout mouse models and human mutations have been linked to obesity risk62. KSR2 is almost exclusively expressed in the brain. It has fewer missense variants than expected and is highly intolerant to LoF mutations52.
MC4R (melanocortin 4 receptor). MC4R is a seven-transmembrane G-protein coupled receptor, predominantly expressed in the brain76. MC4R has been known to play a key role in body weight regulation for more than 20 years. Activation of MC4R by α-MSH, a POMC-derived peptide, suppresses food intake; MC4R antagonists increase food intake and MC4R deficiency in human and rodent models results in hyperphagia and severe and early-onset obesity81. More than 150 MC4R mutations have been identified in individuals with severe, early-onset obesity81, many of which lead to a complete or partial loss of function82,83. Up to 6% of individuals with severe, early-onset obesity carry pathogenic mutations in MC4R, making MC4R deficiency the most common form of monogenic obesity82,84.
PRKAG1 (protein kinase AMP-activated non-catalytic subunit gamma 1). The protein encoded by PRKAG1 is one of the gamma regulatory subunits of the AMP-activated protein kinase (AMPK), which is an important energy-sensing enzyme that monitors cellular energy status34. AMPK and PRKAG1 are ubiquitously expressed76. In the hypothalamus, AMPK influences food intake, energy expenditure and glucose homeostasis36. Muscle-specific overexpression of AMPK γ1 subunit in mice results in increased food intake, but does not affect body weight, presumably through a compensatory increased energy expenditure85.
RAB21 (member RAS oncogene family). RAB21 belongs to the Rab family of monomeric GTPases involved in the control of cellular membrane traffic. The encoded protein is widely expressed76 and plays a role in the targeted trafficking of integrins, and is involved in the regulation of cell adhesion and migration86. RAB21 is thought to be intolerant to LoF mutations52.
RAPGEF3 (rap guanine nucleotide exchange factor 3; also EPAC1). RAPGEF3 encodes the exchange protein directly activated by cAMP isoform 1 (EPAC1), one of two cAMP sensors that are involved in numerous intracellular cAMP-mediated functions87. EPAC1 is ubiquitously expressed76, and insights from mouse knockout models suggest a role in energy homeostasis and the development of obesity and diabetes through the regulation of leptin and insulin signaling31,87.
ZFR2 (zinc finger RNA binding protein 2). The biological function of the gene product is as yet undetermined. GO annotations related to this gene include nucleic acid binding. It may have a role in dendritic branching and axon guidance88,89. ZFR2 is predominantly expressed in the brain76.
ZBTB7B (zinc finger and BTB domain containing 7B, also ThPOK). ZBTB7B is a transcription factor regulating T-cell fate in the thymus, particularly as the master regulator of CD4+ lineage commitment90. It is a repressor of type 1 collagen gene expression91. This gene is mainly expressed in T-cell lineages, skin and gastrointestinal tissues. ZBTB7B is thought to be intolerant to LoF mutations52.
ZFHX3 (zinc finger homeobox 3). ZFHX3 encodes a transcription factor with multiple homeodomains and zinc finger motifs and plays a role in cell-cycle, myogenic and neuronal differentiation. This gene is a tumor suppressor92 that influences circadian rhythms93,94 and sleep94. It may also contribute to the genesis of atrial fibrillation95. ZFHX3 is highly expressed in arterial tissue and also other tissues76. The ZFHX3 gene is highly intolerant to LoF mutations52.
ZNF169 (zinc finger protein 169). The biological function of the gene product is as yet unclear. GO annotations suggest that ZNF169 is involved in nucleic acid binding and transcriptional regulation. This gene is ubiquitously expressed76.
More details and references in Supplementary Table 24.
Next, we performed gene-based association tests (SKAT, VT; broad, strict) in up to 14,541 genes20 to examine whether these aggregated analyses would yield new evidence for multiple R/LF coding SNVs in the same gene affecting BMI (Online Methods). Using broad SNV inclusion criteria, associations for 13 genes reached array-wide significance (P<2.5×10⁻⁶)15,16, four of which had not been highlighted in single-variant analyses (Table 2, Supplementary Table 11). Conditional analyses showed that only for GIPR was the gene-based association driven by multiple SNVs (Table 2, Supplementary Table 12). For all other genes, associations were driven by a single SNV only, but these SNVs had not reached array-wide significance in single-variant analyses.
Table 2.
Genes significantly associated with BMI in a gene-based meta-analyses, aggregating R/LF coding SNVs
| Gene | Location longest coding transcript |
Testd |
N variants |
P-value |
Conditioned P- valuea |
Single variant | |
|---|---|---|---|---|---|---|---|
|
|
|||||||
| Top variant | P-value | ||||||
| All-ancestries sex-combined | |||||||
| SLC6A17 | chr1:110693132–110744823 | SKAT | 13 | 2.73E-07 | 0.13 | rs41313405 | 4.45E-07 |
| RAPGEF3 | chr12:48128453–48152889 | SKAT | 19 | 8.91E-15 | 0.20 | rs145878042 | 5.16E-14 |
| PRKAG1 | chr12:49396055–49412629 | SKAT | 4 | 2.75E-12 | 0.53 | rs1126930 | 2.63E-12 |
| RAB21 | chr12:72148643–72187256 | SKAT | 5 | 4.81E-08 | 0.27 | rs61754230 | 4.96E-08 |
| KSR2 | chr12:117890817–118406028 | SKAT | 7 | 7.15E-09 | 0.19 | rs56214831 | 4.59E-08 |
| MAP1A | chr15:43809806–43823818 | SKAT | 25 | 9.42E-07 | 0.16 | rs55707100 | 1.01E-06 |
| MC4R | chr18:58038564–58040001 | VT | 4 | 3.72E-09 | 0.01 | rs13447325 | 2.97E-11 |
| GIPR | chr19:46171502–46186982 | VT | 10 | 8.24E-09 | 1.12E-04 | rs143430880 | 5.76E-06 |
| All-ancestries sex-specific | |||||||
| ALDH3A1 (men only) | chr17:19641298–19651746 | SKAT | 15 | 3.24E-07 | 0.003 | rs142078447 | 8.62E-06 |
| ZFR2 (women only) | chr19:3804022–3869027 | SKAT | 19 | 1.81E-07 | 0.82 | rs45465594 | 3.64E-07 |
| European sex-combined | |||||||
| ACHE | chr7:100487615–100493592 | SKAT | 6 | 3.30E-10 | 0.12 | rs386545548 | 7.22E-10 |
| European sex-specific | |||||||
| ANGPTL7 (men only) | chr1:11249346–11256038 | VT | 3 | 2.50E-06 | 0.008 | rs202182115 | 2.56E-05 |
| ZNF169 (women only) | chr9:97021548–97064111 | SKAT | 9 | 1.89E-07 | 0.24 | rs12236219 | 1.06E-06 |
Array-wide significant gene-based association is defined as P<2.5×10⁻⁶. P-values are based on the meta-analysis of Discovery Stage studies.
Gene-based analyses were performed with SKAT and VT; results shown are from the test (SKAT or VT) for which the significance exceeded P<2.5×10⁻⁶. Only results using the "broad" SNV inclusion criteria reached array-wide significance.
Transcript positions are reported according to Build 37 for the longest coding transcript supported by RefSeq (as displayed in USCS Genome Browser).
P-value after conditioning on the most significant (top) single variant aggregated in the gene-based test.
Taken together, we identified 14 R/LF coding SNVs in 13 genes that are independently associated with BMI; four rare SNVs in three genes, and 10 LF SNVs in 10 genes. One SNV (ZFR2) showed a sex-specific effect, whereas no ancestry-specific effects were observed (Supplementary Note, Supplementary Tables 6–8, Supplementary Figure 6). Eight (ACHE, ENTPD6, RAB21, RAPGEF3, ZBTB7B, ZFHX3, ZFR2, ZNF169) of these 13 genes have not been previously implicated in body weight regulation (Table 1).
Novel common coding variants associated with BMI
Although the main focus of our study was on R/LF coding SNVs, we also identified 92 common coding variants (P<2.0×10⁻⁷; Supplementary Tables 4; Supplementary Figures 4, 7), of which 41 were novel (Supplementary Table 9, Supplementary Note). These novel common loci had not been identified in previous GWAS efforts, because our current sample size is more than twice as large as the most recent GWAS meta-analysis5, and also because some SNVs were not tested before, as they were not present on the HapMap reference panel and/or were on the X-chromosome, which was not analyzed. Because of the increased samples size, effect sizes of the 41 novel common loci are smaller (on average 0.014 SD/allele, [range: 0.010–0.024]) than of previously established common loci (0.021 SD/allele, [0.010–0.050]) (Supplementary Figure 7).
Impact of R/LF SNVs on BMI and obesity risk
The minor allele for half of the 14 R/LF SNVs is associated with lower BMI (Table 1, Figure 1). The effects of LF SNVs range between 0.024 and 0.066 SD/allele, equivalent to ~0.11 to 0.30 kg/m2 in BMI or ~0.315 to 0.864 kg in body weight for a 1.7m tall person. Effects of rare SNVs range between 0.06 and 0.54 SD per allele, equivalent to 0.26 to 2.44 kg/m2 or 0.74 kg to 7.05 kg per allele (Table 1, Figure 1). By comparison, these rare SNV effect sizes are on average ten times larger than those for previously identified GWAS loci (effectmean=0.019 SD/allele, ~0.086 kg/m2 or ~0.247 kg/allele) of which the largest effect is seen for the FTO locus (0.08 SD/allele, ~0.35 kg/m2 or 1 kg/allele) and those for other GWAS loci range between 0.010 and 0.056 SD/allele (~0.045 to 0.25 kg/m2, or 0.130 to 0.728 kg)5.
Figure 1. Effect sizes (y-axis) of the 14 BMI-associated R/LF coding variants by their minor allele frequency.

Effect sizes are expressed in body weight (kg) per allele, assuming a SD of 4.5 kg and an average-sized person of 1.7m tall. Solid markers indicate that the minor allele is associated with higher BMI, and clear markers indicate that the minor allele is associated with lower BMI. Variants were identified in all-ancestry analyses (light blue diamonds), the European ancestry analyses (dark blue square) and women-only analyses (pink diamond). Effect sizes for previously identified GWAS loci are shown in navy blue diamonds. The dotted line represents 80% power, assuming α = 2×10⁻⁷ and N= 525,000 (discovery sample size).
Effect sizes increase as MAF decreases, in particular for SNVs with a MAF<0.5% (~1 heterozygote carrier in 100 people), consistent with the statistical power of our sample (Figure 1). For example, the nonsense p.Tyr35Ter MC4R SNV (rs13447324, MAF=0.01%) is present in ~1 in 5,000 individuals and results in a ~7 kg higher body weight for a 1.7m tall person. The two GIPR SNVs contribute independently to a lower body weight; carriers (1 in ~455 individuals) of p.Arg190Gln (rs139215588) weigh ~1.92 kg (0.148 SD BMI) less than non-carriers and carriers (1 in ~385 individuals) of p.Glu288Gly (rs143430880) weigh ~1.99 kg (0.153 SD BMI) less. Among 115,611 individuals of the UK Biobank, one apparently healthy 61-year-old woman, with no reported illnesses, carried both rare GIPR alleles and weighed ~11.2 kg less (equivalent to −0.86 SD BMI or 3.87 kg/m2) than the average non-carrier of the same height (Supplementary Figure 8). The possible synergistic effect of the two GIPR alleles needs confirmation by additional individuals that carry both variants.
Even though effect sizes of LF and, in particular, rare SNVs tend to be larger than those of common GWAS-identified loci5, the 14 SNVs combined explain <0.1% of BMI variation, because of their low population frequency (Table 1, Online Methods). Also, although the effects of the four rare SNVs (KSR2, MC4R, 2 in GIPR) are large by GWAS standards, penetrance for obesity is still expected to be low. Indeed, using data from the UK Biobank (Nmax=119,781), we compared the prevalence of normal-weight (18.5 kg/m2 ≤ BMI < 25 kg/m2) and obesity (BMI ≥ 30 kg/m2) between carriers and non-carriers (Supplementary Table 13, Online Methods). For GIPR (p.Arg190Gln, p.Glu288Gly), both BMI-decreasing SNVs, carriers tended (P<0.05) to have a lower obesity prevalence (21.2%, 20.1%, respectively), compared to non-carriers (25.1%, 25%). For MC4R p.Tyr35Ter and KSR2 p.Arg525Gln, the prevalence of obesity between carriers (30%, 25.7%, resp.) and non-carriers (25.1%, 25.3%) was not significantly different.
We examined whether R/LF SNVs affect obesity risk early on in life by combining data from three case-controls studies of childhood obesity (Ncases=4,395; Ncontrols=13,072) (Online Methods, Supplementary Table 14). Associations for 10 of 13 SNVs were directionally consistent with those observed for BMI in adults (77%, Pbinomial=0.046), three of which (ZBTB7B, PRKAG1, RAB21) reached nominal significance (P<0.05). While no carriers of the MC4R mutations were available for analyses, the role of MC4R in body weight regulation in childhood was established almost two decades ago17,19,21.
Impact of R/LF SNVs on cardiometabolic and other traits
To examine whether identified SNVs affect other traits, we obtained results from multiple large-scale genetic consortia (GIANT15, MAGIC, GoT2D/T2D-GENES16, GLGC, ICBP22, REPROGEN23) (Supplementary Table 15, Supplementary Figure 9), and performed phenome-wide association (PheWAS) analyses using electronic medical record (EMR) data from BioVu and UK Biobank (Online Methods, Supplementary Table 16). The BMI-increasing allele of ZBTB7B p.Pro190Ser is associated with greater height, and those of PRKAG1, ACHE, and RAPGEF3 SNVs are associated with shorter height, but association with other traits differ. Specifically, PRKAG1 p.Thr38Ser Ser-allele carriers appear heavier and shorter, have lower HDL-cholesterol levels, earlier age at menarche (reported before23) and higher systolic blood pressure, which is in agreement with PheWAS analyses showing an increased risk of “malignant essential hypertension” and “hypertension” (Supplementary Table 16). While carriers of the RAPGEF3 p.Leu300Pro Pro-allele are also heavier and shorter, they have a lower WHRadjBMI24 and lower fasting insulin levels (Supplementary Table 15), consistent with PheWAS results that show lower odds of “secondary diabetes mellitus” (Supplementary Table 16). Thus, while all SNVs are associated with BMI, their patterns of association with other traits suggest they may affect different physiological pathways.
Gene set enrichment analyses
To test whether the R/LF variants implicate biological pathways, we performed gene set enrichment analyses. Similar to our previous analysis of GWAS for BMI5, we analyzed coding variants that reached P<5×10⁻⁴, using a DEPICT version adapted for exome-array analysis15 (Online Methods, Supplementary Note). We used 50 R/LF coding variants as input (all P<5×10⁻⁴; Online Methods) and observed significant enrichment (Figure 2, Supplementary Table 17, Supplementary Figure 10a). Many of these relate to neuronal processes, such as neurotransmitter release and synaptic function (e.g. glutamate receptor activity, regulation of neurotransmitter levels, synapse part), consistent with previous findings from GWAS5. When we excluded variants near (+/− 1Mb) previously identified GWAS loci, we still observed 29 significantly enriched gene sets (in 12 meta-gene sets) (Supplementary Table 18, Supplementary Figure 10b), thereby providing an independent confirmation of the GWAS gene set enrichment results. In addition to neuronal-related gene sets, the analyses with R/LF coding variants newly identified a cluster of metabolic pathways related to insulin action and adipocyte/lipid metabolism (e.g. enhanced lipolysis, abnormal lipid homeostasis, increased circulating insulin level; Figure 2). Finally, we observed that R/LF BMI-associated coding variants are more effective at identifying enriched gene sets compared to common coding variants. Specifically, adding 192 common coding SNVs (all P<5×10⁻⁴) to the analysis decreased the number of enriched gene sets from 471 (106 meta-gene sets) seen with R/LF coding SNVs to 62 (24 meta-gene sets) (Supplementary Table 19, Supplementary Figure 10c). We observed fewer significant genes sets with the combined common and R/LF analysis, despite including more total coding variants and a higher fraction of array-wide significant coding variants. One possible explanation is that R/LF coding variants may fall in the causal gene more often than do common coding variants, which suggests that the R/LF variants are more likely to be causal, rather than simply in LD with causal variants.
Figure 2. Heatmap showing DEPICT gene set enrichment results for suggestive and significant rare and low-frequency coding SNVs.
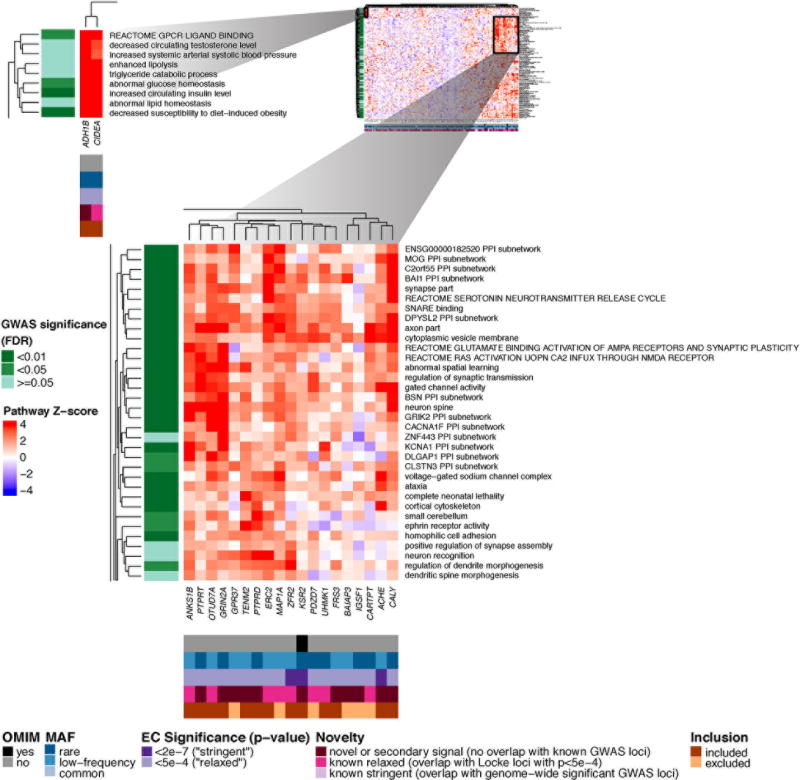
For any given square, the color indicates how strongly the corresponding gene (x-axis) is predicted to belong to the reconstituted gene set (y-axis), based on the gene’s Z-score for gene set inclusion in DEPICT’s reconstituted gene sets (red indicates a higher, blue a lower Z-score). To visually reduce redundancy and increase clarity, we chose one representative "meta-gene set" for each group of highly correlated gene sets based on affinity propagation clustering (Online Methods, Supplementary Note). Heatmap intensity and DEPICT P-values (Supplementary Table 17) correspond to the most significantly enriched gene set within the meta-gene set. Annotations for genes indicate (1) whether it has an OMIM annotation as underlying a monogenic obesity disorder (black/grey), (2) the MAF of the significant ExomeChip (EC) variant (blue), (3) whether the variant’s P-value reached array-wide significance (<2×10⁻⁷) or suggestive significance (<5×10⁻⁴) (purple), (4) whether the variant was novel, overlapping “relaxed” GWAS signals from Locke et al.5 (GWAS P<5×10⁻⁴), or overlapping “stringent” GWAS hits (GWAS P<5×10⁻⁸) (pink), and (5) whether the gene was included in the gene set enrichment analysis or excluded by filters (orange/brown) (Online Methods, Supplementary Note). Annotations for gene sets indicate if the meta-gene set was significant (green; FDR <0.01, <0.05, or not significant) in the DEPICT analysis of GWAS results5. Here, two regions of particularly strong gene set membership are shown (see full heat map in Supplementary Figure 10a).
We also used gene set enrichment analysis to prioritize candidate genes. Among the genes with R/LF coding variants associated with BMI at P<5×10⁻⁴, a subset is prominently represented in the CNS-related enriched gene sets (Figure 2) and is proposed to influence neurotransmission and/or synaptic organization, function and plasticity. These include genes in regions with suggestive evidence of association from GWAS (e.g. CARTPT, MAP1A, ERC2) and genes in regions not previously implicated by GWAS (e.g. CALY, ACHE, PTPRD, GRIN2A). The non-neuronal metabolic gene sets implicate two genes (CIDEA, ADH1B) that are markers of brown or “beige” adipose tissue25,26, providing new supporting evidence for a causal role of this aspect of adipocyte biology.
Drosophila fly results
To test for potential adiposity-driving effects of gene regulation, we performed tissue-specific RNAi-knockdown experiments in Drosophila. We generated adipose-tissue (cg-Gal4) and neuronal (elav-Gal4) specific RNAi-knockdown crosses for nine of the 13 candidate genes for which fly orthologues exist (Supplementary Table 20) and performed whole body triglyceride analysis in young adult male flies. Triglycerides, the major lipid storage form in animals, were chosen as a direct measure of fly adiposity. Both neuronal and fat-body knockdown of zfh2, the orthologue of ZFHX3, resulted in significantly increased triglyceride levels. Adipose-tissue specific, but not neuronal, knockdown of epac (RAPGEF3) was lethal. Tissue-specific loss-of-function of the other seven genes tested did not affect triglyceride levels.
R/LF coding SNVs in monogenic and syndromic genes
We identified 39 genes in the literature that have been convincingly implicated in monogenic obesity or syndromes of which obesity is one of the main features (Supplementary Table 21, 22, Supplementary Figure 11). Of the 652 R/LF SNVs in these 39 monogenic and/or syndromic genes, five R/LF SNVs were significantly associated with BMI (Bonferroni-corrected P-value = 7.7×10⁻⁵ (=0.05/652)). Beside SNVs in MC4R (p.Tyr35Ter, Asp37Val) and KSR2 (Arg525Gln), already highlighted in the single-variant analyses, we identified an additional SNV in MC4R (p.Ile251Leu) and one in BDNF (p.Glu6Lys). MC4R p.Ile251Leu has been previously shown to protect against obesity27, whereas BDNF p.Glu6Lys, independent of previously GWAS-identified SNVs (r2=0.01, D’=1.0)5, has not been implicated in body weight regulation before. We examined whether the 652 R/LF SNVs showed enrichment for association with BMI compared to R/LF coding SNVs in all other genes, but found no evidence to support this.
DISCUSSION
In this meta-analysis of exome-targeted genotyping data, we identified 14 R/LF coding variants in 13 genes associated with BMI. Eight of these genes (ACHE, ENTPD6, RAB21, RAPGEF3, ZBTB7B, ZFHX3, ZFR2, ZNF169) have not been previously implicated in human obesity, but evidence from animal studies provides support for a role in energy metabolism for some of these, such as ACHE28,29, RAPGEF330–33, and PRKAG134–39. Others fall into established BMI GWAS loci (PRKAG1/BCDIN3D, HIP1R/CLIP1, MC4R, GIPR/QPCTL)5 and/or were previously implicated in severe early-onset obesity (MC4R, KSR2)17–19 and using this exome-targeted approach, we pinpoint R/LF variants in these loci that play a role in obesity in the general population. Pathway analyses confirm a key role for neuronal processes, and newly implicate adipocyte and energy expenditure biology.
Consistent with other polygenic traits15,23,40–43, we show that large sample sizes are needed to identify R/LF variants. Observed effect sizes reflect the statistical power of our sample size, and are particularly large for SNVs with a MAF < 0.05%. The existence of rare alleles with larger effects on BMI than have been observed for common alleles might reflect negative or stabilizing selection on the extremes of BMI. However, rare variants with smaller effects almost certainly exist; larger samples will be needed to uncover these. Our study was limited to coding variants on the exome-array; large-scale sequencing studies will be needed to test for variants not covered by exome-arrays.
The strongest association was observed for a stop-codon (p.Tyr35Ter, rs13447324, MAF= 0.01%) in MC4R, with carriers weighing on average 7kg more than non-carriers. MC4R is widely expressed in the CNS and is an established key player in energy balance regulation44,45. Mouse and human studies showed already two decades ago that MC4R-deficiency results in extreme obesity, mainly through increased food intake46–49. p.Tyr35Ter, which results in MC4R-deficiency51, was one of the first MC4R mutations discovered in monogenic cases of obesity17,19, in whom the mutation is >20× more prevalent than in the general population17,50,52,53. Here, we show that p.Tyr35Ter plays a role outside the setting of early-onset and extreme obesity. Despite its large effect, penetrance is low, and does not fit the model of a fully penetrant Mendelian variant.
While significant R/LF coding variants are strong candidates for being causal, the strongest implication of causal genes is provided by association with multiple independent coding variants, as we demonstrate for GIPR. We identified two rare variants in GIPR (p.Arg190Gln, rs139215588, MAF=0.11%; p.Glu288Gly, rs143430880, MAF=0.13%) independently associated with lower BMI; carriers of either variant weigh ~2 kg less than non-carriers. Common variants in/near GIPR have been found to associate with lower BMI55 and delayed glucose and insulin response to an oral glucose challenge54. However, the two rare variants influence BMI independently of these common ones and are not associated with type 2 diabetes or glycemic traits tested. Rodent models have provided strong evidence for a role of GIPR in body weight regulation. Gipr-deficient mice are protected from diet-induced obesity56 and have an increased resting metabolic rate57. Blocking GIP-signaling using a vaccination approach in mice on a high-fat diet reduces weight gain, mainly through reduced fat accumulation, mediated through increased energy expenditure58. Manipulation of incretins (GIP, GLP1) and their receptors has complex effects on obesity and insulin secretion/action that may differ between human and mice59. The human genetic data suggest that inhibition of GIPR-signaling might present a therapeutic target for the treatment of obesity60.
A fourth rare variant, in KSR2, (p.Arg525Gln, rs56214831, MAF=0.82%) increases body weight by ~740g/allele. KSR2 is another gene previously implicated in energy metabolism and obesity18,61,62. In a recent study, mutation carriers were hyperphagic, had a reduced basal metabolic rate and severe insulin resistance18. Consistent with human data, Ksr2−/− mice were obese, hyperphagic, and had a reduced energy expenditure18,61–63. KSR2 is almost exclusively expressed in the brain and interacts with multiple proteins64, including AMP-activated protein kinase (AMPK), a key regulator of energy homeostasis61,62. Interestingly, KSR2 is one of the first genes implicated in severe, early-onset obesity in which mutations not only affect food intake but also basal metabolic rate, and is thought to act via neuronal effects18 (Figure 2).
Despite convincing associations of these four rare variants in MC4R, GIPR and KSR2, their penetrance for obesity is low (Supplementary Table 13). This is consistent with the polygenic and multifactorial nature of obesity, where variants across a range of frequencies and effect sizes contribute to the phenotype in any one person. Despite low predictive power, it remains possible that the identities of particular variants in any one person may contribute to different balances of underlying physiologies and hence, different responses to treatments. This was illustrated in two patients with monogenic obesity due to POMC mutations; these patients lack the main activator of MC4R and were effectively treated with an MC4R-agonist65.
Of the coding variants in newly identified genes, some have well-known connections to obesity. For example, PRKAG1 encodes the γ1-subunit of AMPK, a critical cellular energy sensor34. In the hypothalamus, AMPK integrates hormonal and nutritional signals with neuronal networks to regulate food intake and whole-body energy metabolism35–37. Furthermore, hypothalamic AMPK is a key regulator of brown adipose tissue in mice36,38,39. The BMI-decreasing allele at the associated PRKAG1 variant (p.Thr38Ser, rs1126930, MAF=3.22%) has additional beneficial effects on blood pressure, providing additional genetic support for modulation of AMPK as an ongoing therapeutic avenue for treatment.
ACHE, in which p.His353Asn (rs1799805, MAF=3.9%) is associated with increased BMI, is another candidate gene related to neuronal biology, involved in the signaling of acetylcholine at neuromuscular junction and brain cholinergic synapses67,68. Inhibitors of ACHE, used to treat moderate-to-severe Alzheimer’s Disease69, results in weight loss in humans and Ache-deficient mice have delayed weight gain28,29. However, these may be indirect consequences of adverse gastrointestinal and neuromuscular effects, respectively28,29,70,71.
Another LF coding variant (p.Leu300Pro, rs145878042, MAF=1.1%) is located in RAPGEF3, and has strong effects on multiple other phenotypes. The BMI-increasing 300Pro-allele is associated with shorter height, lower WHRadjBMI and lower insulin levels, suggesting that this variant has multiple physiologic consequences. Data from animal models also suggest complex effects of RAPGEF3 on adipocyte biology, energy balance and glucose metabolism30–33. For example, in one study, global deletion of Rapgef3 in mice on a high-fat diet are resistant to obesity due to reduced food intake and have an increased glucose tolerance31. However, in a similar study, Rapgef3−/− mice develop severe obesity, increased respiratory exchange ratio and impaired glucose tolerance33. Adipose tissue-specific Rapgef3 knockout mice on a high-fat diet are also more prone to obesity, show increased food intake, reduced energy expenditure, impaired glucose tolerance, and reduced circulating leptin levels72. More research is needed to understand the consequences of RAPGEF3 manipulation.
The remaining genes with significant associations, ENTPD6, HIP1R, RAB21, ZFR2, ZBTB7, and ZFHX3, have no clear prior evidence for a role in energy homeostasis, and in-depth functional follow up is needed to gain insight in how they affect body weight. Here, we performed gene set enrichment analyses to better understand the biology implicated by our genetic data, and confirm the importance of neuronal processes, in particular synaptic function and neurotransmitter release, providing an independent validation of previous GWAS findings5. The combination of gene set enrichment and association analyses of coding variants also enables us to highlight candidate genes that are both within these gene sets and show association with BMI at R/LF coding variants. These include genes reaching array-wide significance (e.g. ACHE, ZFR2), and others with clear prior evidence for a role in body weight regulation (e.g. CARTPT73), but that had not been highlighted in our single-variant or gene-based association analyses. Of note, the enrichment signals were stronger with R/LF coding variants only than with all coding variants, suggesting that R/LF variants are more likely to be causal and may more often point directly to relevant genes, whereas common coding variants may more often be proxies for common noncoding variants that affect nearby genes.
In addition, our gene set enrichment analyses now provide supporting evidence for a role of non-neuronal mechanisms as well. Specifically, CIDEA and ADH1B are both strongly predicted to be members of enriched gene sets related to insulin action and adipocyte biology, and both are markers that distinguish brown from white fat depots in mice25 and humans26. CIDEA is predominantly expressed in adipose tissue and known as a key regulator of energy metabolism25. Cidea-deficient mice are resistance to diet-induced obesity with increased lipolysis and mitochondrial uncoupling25. The connection of ADH1B to obesity is less clear, but the gene is highly expressed in human adipocytes, has been implicated by gene expression analyses in obesity and insulin resistance, and functions early in a potentially relevant metabolic pathway (retinoid biosynthesis)25,26,74,75. Similar pathways were implicated by recent work dissecting the signal near FTO13. However, because SNV-association signals at ADH1B and CIDEA did not reache array-wide significance, additional genetic analysis of their role in obesity would be warranted.
In summary, we performed association analyses between R/LF variants and BMI in >700,000 individuals, and identified 14 variants in 13 genes, in 5 known and 8 novel genes. While each variant contributes little to BMI variation in the general population, they may have substantial impact on body weight at an individual level. Furthermore, prior literature for these genes and unbiased gene set enrichment analysis indicate a strong role for neuronal biology and also provide new support for a causal role of aspects of adipocyte biology. The identified genes provide potential targets that may lead to new and more precise approaches for the treatment of obesity, which has seen minimal innovation in the past 30 years1.
ONLINE METHODS
Study design & participants
The discovery cohort consisted of 123 studies (163 datasets) comprising 526,508 adult (≥18yrs) individuals of the following ancestries (Supplementary Figure 1): 1) European (N = 449,889), 2) South Asian (N = 29,398), 3) African (N = 27,610), 4) East Asian (N = 8,839), and 5) Hispanic (N = 10,772). All participating institutions and coordinating centers approved this project and informed consent was obtained from all study participants. Discovery meta-analyses were carried out in each ancestry separately and in the All-ancestries combined group, for both sex-specific and sex-combined analyses. SNVs for which associations reach suggestive significance (P<2.0×10⁻⁶) in the discovery analyses, were taken forward for follow-up in 192,226 individuals of European ancestry from the UK BioBank and deCODE. Conditional analyses were conducted in the All-ancestries and European descent groups. Study-specific design, sample quality control and descriptive statistics are provided in Supplementary Tables 1–3.
Phenotype
Body mass index (BMI: weight [in kilograms] / height [in meters]2) was corrected for age, age2 and genomic principal components (PC, derived from GWAS data, the variants with MAF > 1% on ExomeChip, or ancestry informative markers available on the ExomeChip), as well as any additional study-specific covariates (e.g. recruiting center), in a linear regression model. For studies with non-related individuals, residuals were calculated separately by sex, whereas for family-based studies sex was included as a covariate in the model. Additionally, residuals for case/control studies were calculated separately. Finally, residuals were subject to inverse normal transformation96.
Genotype calling
The majority of studies followed a standardized protocol and performed genotype calling using the designated manufacturer software, which was then followed by zCall97. For 10 studies, participating in the Cohorts for Heart and Aging Research in Genomic Epidemiology (CHARGE) Consortium, the raw intensity data for the samples from seven genotyping centers were assembled into a single project for joint calling98. Study-specific quality control (QC) measures of the genotyped variants were implemented before association analysis (Supplementary Table 2).
Statistical analyses
Study-level association analyses
Individual cohorts were analyzed separately for each ancestry, in sex-combined and sex-specific groups, with either RAREMETALWORKER (see URL links at the end of the Online Methods) or RVTEST99 (Supplementary Table 2), to associate inverse normal transformed BMI with genotype accounting for potential cryptic relatedness (kinship matrix) in a linear mixed model. These software tools are designed to perform score-statistics based rare-variant association analyses, can accommodate both unrelated and related individuals, and provide single-variant results and variance-covariance matrices. The covariance matrix captures linkage disequilibrium (LD) relationships between markers within 1 Mb, which is used for gene-level meta-analyses and conditional analyses100. Single-variant analyses were performed for both additive and recessive models.
Centralized quality-control
A centralized quality-control procedure, implemented in EasyQC101, was applied to individual cohort association summary statistics to identify cohort-specific problems: (1) assessment of possible problems in BMI transformation, (2) comparison of allele frequency alignment against 1000 Genomes Project phase 1 reference data to pinpoint any potential strand issues, and (3) examination of quantile-quantile (QQ) plots per study to identify any problems arising from population stratification, cryptic relatedness and genotype biases.
Meta-analyses
Meta-analyses were carried out by two different analysts at two sites in parallel. We excluded variants with a call rate < 95%, Hardy-Weinberg equilibrium P-value < 1×10⁻⁷, or large allele frequency deviations from reference populations (> 0.6 for all-ancestry analyses and > 0.3 for ancestry-specific population analyses). Significance for single-variant analyses was defined at the array-wide level (a Bonferroni-corrected threshold of P < 2×10⁻⁷ for ~250,000 SNVs). To test for sex-differences of the significant variants (P < 2×10⁻⁷), we calculated the P-diff for each SNP, which tests for differences between women-specific and men-specific beta estimates using EasyStrata102. For gene-based analyses, we applied the sequence kernel association test (SKAT)103 and the Variable Threshold (VT)104 gene-based methods using two different sets of criteria (broad and strict) to select predicted damaging R/LF variants with MAF < 5%, based on coding variant annotation from five prediction algorithms (PolyPhen2 HumDiv and HumVar, LRT, MutationTaster and SIFT)20. Our broad gene-based tests included nonsense, stop-loss, splice site, and missense variants that are annotated as damaging by at least one algorithm mentioned above. Our strict gene-based tests included only nonsense, stop-loss, splice site, and missense variants annotated as damaging by all five algorithms. Statistical significance for gene-based tests was set at a Bonferroni-corrected threshold of P < 2.5×10⁻⁶ for about 20,000 genes16,105. Singe-variant and gene-based meta-analyses were both performed using RareMETALS R-package106. As our secondary analyses are nested and/or highly correlated with our primary analysis, we chose the same, already stringent, Bonferroni-corrected significance threshold for both analyses.
Genomic inflation
Although the overall λGC value is in the normal range for all coding variants (λGC = 1.1, Supplementary Table 23), we observed a marked genomic inflation of the test statistics even after adequate control for population stratification (linear mixed model) arising from common markers (λGC = 1.99, Supplementary Figure 2a and Supplementary Table 23). Such inflation is expected for a highly polygenic trait like BMI, as was previously confirmed for height15, and is consistent with our very large sample size5,107. Furthermore, some of the inflation may be due to the design of the ExomeChip, which besides R/LF coding SNVs also contains (common and non-coding) SNVs that include previously identified GWAS loci for all traits, including for BMI and BMI-related traits, reported in the GWAS catalogue at the time of its design.
After removing established loci (+/− 1Mb), the excess of significant associations is markedly reduced and inflation reduced (Supplementary Figures 2c and 2d).
Furthermore, to exclude the possibility that some of the observed associations between BMI and R/LF SNVs could be due to allele calling problems in the smaller studies, we performed a sensitivity meta-analysis with primarily European ancestry studies totaling >5,000 participants. We found very concordant effect sizes, suggesting that smaller studies do not bias our results (Supplementary Figure 12).
Follow-up Analysis
We sought additional evidence for association of the top signals (P<2.0×10⁻⁶) identified in the discovery meta-analysis using two independent studies from the UK (UK Biobank, interim release, N = 119,613) and Iceland (deCODE, N = 72,613), respectively (Supplementary Tables 1–3). We used the same QC and analytical methodology as described above. We used the inverse-variance weighted fixed effects meta-analysis in METAL108, to combine the discovery and follow-up association results. Significant associations were defined at P < 2×10⁻⁷ in the combined meta-analysis of discovery, UK Biobank and deCODE results.
Effect of study design
To investigate the potential effect of study design of the participating studies, we tested for heterogeneity between population-based, all case-control studies; T2D case-control studies (Supplementary Table 26). None of these comparisons showed significant evidence of heterogeneity (P<7.4×10⁻⁵, correcting for multiple testing).
Conditional analyses
The RareMETALS R-package106 was used to identify independent BMI associated signals across the all-ancestry meta-analysis results in the discovery phase. RareMETALS performs conditional analyses by using covariance matrices from each individual cohort to distinguish true signals from the shadows of adjacent significant variants in LD. The conditional associations of all the variants within 1Mb of each R/LF coding variant were analyzed to identify [1] nearby secondary signals and [2] to determine independence from nearby non-coding variants or previously identified GWAS loci (previously defined as a window of 1Mb surrounding the lead SNP). Gene-based conditional analyses were also performed in RareMETALS.
Due to the selective coverage of variants on the ExomeChip, we also conducted the respective conditional analyses in the UK Biobank dataset that included 847,441 genome-wide genotyped markers, and 72,355,667 variants imputed against UK10k haplotype reference panel, merged with the 1000 Genomes Phase 3 reference panel. Where available, directly genotyped variants where used for conditional analyses. Otherwise, imputed variants with good imputation quality (IMPUTE2 info score > 0.6) were used. We used QCTOOL to extract variants of interest from the original imputed data set. Subsequently, GTOOL was used to convert to PLINK format (genotype calling threshold 0.99) and merged with the directly genotyped variants for conditional analyses in PLINK v1.90b3.35 64-bit (25 Mar 2016).
Conversions of effect size and explained variants
We assumed that 1 SD = 4.5 kg/m2 BMI-units, based on population based data, and 1.7m as the average height of a person to convert effects sizes in SD-units into body weight. The variance explained by each variant was calculated using the effect allele frequency (f) and beta (β) from the meta analyses using the formula109 of explained variance = 2f(1-f)β2.
Penetrance analysis
We examined the penetrance for the four rare SNVs, p.Arg525Gln (rs56214831) in KSR2, p.Tyr35Ter (rs13447324) in MC4R, and p.Arg190Gln (rs139215588) and p.Glu288Gly (rs143430880) in GIPR in European ancestry data from the UKBiobank (N up to 120,000). For each variant, we compared the prevalence of underweight (BMI < 18.5 kg/m2), normal weight (18.5 kg/m2 ≤ BMI < 25 kg/m2), overweight (25 kg/m2 ≤ BMI < 30 kg/m2) and obesity (BMI ≥ 30 kg/m2) of non-carriers with non-carriers. We used a Pearson χ2 test to test for difference between distributions, and a χ2 for linear trend to test whether distributions of carriers were shifted compared to non-carriers. For p.Arg525Gln in KSR2 and p.Tyr35Ter in MC4R, we hypothesized that obesity prevalence was higher in carriers than in non-carriers, whereas for the two GIPR variants, we hypothesized that the prevalence of normal weight was higher in carriers than non-carriers.
Associations with obesity for the coding rare and low-frequency loci in children
For each of the 14 R/LF SNVs, we tested for association with childhood obesity in the CHOP cohort (Childhood Obesity: Early Programming by Infant Nutrition), the Severe Childhood Onset Obesity Project (SCOOP), the UK Household Longitudinal Study (UKHLS) and INTERVAL Study (INTERVAL). Summary statistics across the studies were combined using a fixed effects inverse-variance meta-analysis with METAL108.
In the CHOP study, cases (1,358 boys, 1,060 girls) were defined as having a BMI > 95th percentile at any point in their childhood. Controls (1,412 boys, 1,143 girls) were defined as having < 50th percentile consistently through throughout childhood. The BMI percentiles are based on the CDC 2000 Growth Charts. All children were classified based on their BMI measurements between the ages of 2 and 18. All individuals are of European ancestry and were collected at the Children’s Hospital of Philadelphia. Informed consent was obtained from all study participants and study protocols were approved by the local ethics committees. Genotypes were obtained using the HumanHap550v1, HumanHap550v3, and Human610-Quad high-density SNP arrays from Illumina. The intersection of all SNPs on the arrays was used in all subsequent pre-imputation analyses. Before imputation, we excluded SNPs with a Hardy-Weinberg equilibrium P-value < 1.0×10⁻⁶, call rate of < 95% or MAF of < 1%. The genotypes were then pre-phased using Shapeit2 and imputed using the 1000 Genomes Phase 1 integrated variant set with Impute2. After imputation, SNPs were excluded if the INFO score was < 0.4. Boys and girls were analyzed separately using a logistic regression of case and control status, adjusting for three eigenvectors, and summary statistics were combined using a fixed effects inverse-variance meta-analysis with METAL108.
SCOOP is a sub-cohort of the Genetics Of Obesity Study (GOOS) cohort. It includes >1,500 UK European ancestry individuals with severe, early onset obesity (BMI Standard Deviation Score > 3 and obesity onset before the age of 10 years), in whom known monogenic causes of obesity have been excluded (cases with MC4R mutations were excluded). Two case-control analyses with SCOOP cases were performed: 1) SCOOP vs. UKHLS for which array (Illumina HumanCoreExome) data was available, and 2) SCOOP vs. INTERVAL, for whom whole-exome sequencing data was available.
For the array based analyses, UKHLS controls were genotyped on the Illumina HumanCoreExome-12v1-0 Beadchip. SCOOP cases and 48 UKHLS controls were genotyped on the Illumina HumanCoreExome-12v1-1 Beadchip. The 48 overlapping UKHLS samples were used for quality control to ensure there were no systematic differences and bias between the two versions of the chip. SCOOP and UKHLS samples were phased with SHAPEITv2, and imputed with IMPUTE2 using the combined UK10K-1000G Phase III reference panel. For the WES analyses, SCOOP vs. INTERVAL controls were WES within the UK10K-EXOME project (Agilent v3) and the INTERVAL project (Agilent v5) respectively and were then jointly called and QC-ed on the union of the sequencing baits. Individuals overlapping or related between the array based and WES studies were removed.
After QC, 1,456 SCOOP and 6,460 UKHLS (BMI range 19–30), and 521 SCOOP and 4,057 INTERVAL individuals were available for the two analyses; all were unrelated, of high quality, and of European ancestry. For both analyses (i.e. SCOOP vs. UKHLS and SCOOP vs. INTERVAL), a maximum likelihood frequentist association test with the additive genetic model was implemented in SNPTEST v2.5. In the SCOOP vs. UKHLS analysis, sex and the first six PCs were included as covariates and variants with a SNPTEST INFO score <0.4 and HWE p<10−6 were removed. For the SCOOP vs INTERVAL analysis, we performed an unadjusted analysis (adjustment for PCs did not change sufficiently the results) and variants were limited to those covered at ≥7× in at least 80% of each sequencing cohort, meeting the VQSR threshold of –2.52, missingness <80%, HWE P-value<10−8, and GQ ≥30.
Cross-trait analyses
We evaluated each of the 14 R/LF SNVs for their association with other relevant obesity-related traits and conditions. We performed lookups in ExomeChip meta-analysis results from other consortia, including; our own GIANT consortium (height15, WHR adjusted for BMI24), MAGIC (HbA1c, Fasting Insulin, Fasting Glucose, 2-hour glucose), GLGC (HDL-cholesterol (HDL-C), LDL-cholesterol (LDL-C), triglycerides and total cholesterol)), IBPC40 (systolic and diastolic blood pressure), REPROGEN23 (age at menarche and menopause) and GoT2D/T2D-GENES16 (type 2 Diabetes). Associations were considered significant at P < 2.0×10⁻⁵, accounting for multiple testing.
Phenome-wide association analysis (PheWAS)
To evaluate the potential for pleiotropic effects for SNPs discovered from primary analyses, we performed phenome-wide association studies (PheWASs) using genotype and phenotype data from two independent sources of electronic health records (EHR): Vanderbilt University Medical Center Biorepository (BioVU) and the United Kingdom BioBank (UKBB). Phenotype selection and analysis strategy were synchronized across sites. A total of 1502 hierarchical phenotype codes from EHRs were curated by grouping International Classification of Disease, Ninth Revision (ICD-9) clinical/billing codes as previously described110. Phenotype codes with 20 or more cases and with minor allele count of 5 or greater in cases and controls were eligible for analysis. Series of logistic regression analyses were then performed in individuals of European ancestry for each eligible phenotype-genotype combination while adjusting for 5 genetic ancestry PCs. Odds ratios from genotype-phenotype combinations present in both BioVU and UKBB were then aggregated using inverse-variance weighted fixed-effects meta-analysis. Associations with p-values corresponding to false discovery rate (FDR) cut off of less than 10% were considered statistically significant.
Gene set enrichment analysis
We adapted DEPICT, a gene set enrichment analysis method for GWAS data, for use with the ExomeChip (‘EC-DEPICT’). DEPICT’s primary innovation is the use of “reconstituted” gene sets, where many different types of gene sets (e.g. canonical pathways, protein-protein interaction networks, and mouse phenotypes) were extended through the use of large-scale microarray data (see111 for details). EC-DEPICT computes P-values based on Swedish ExomeChip data (Malmö Diet and Cancer [MDC], All New Diabetics in Scania [ANDIS], and Scania Diabetes Registry [SDR] cohorts, N=11,899) and, unlike DEPICT, takes as input only coding variants and only the genes directly containing those variants, rather than all genes within a specified amount of linkage disequilibrium (Supplementary Note).
Four analyses were performed for the BMI EC variants: [1] all coding variants with P<5×10⁻⁴, [2] all coding variants with P<5×10⁻⁴ independent of known GWAS variants5, [3] all coding R/LF variants with P<5×10⁻⁴, and [4] all coding R/LF variants with P<5×10⁻⁴ independent of known GWAS variants. Affinity propagation clustering3 was used to group highly correlated gene sets into “meta-gene sets”. For each meta-gene set, the member gene set with the best P-value was used as representative for purposes of visualization (Supplementary Note). DEPICT for ExomeChip was written using the Python programming language (See URLs).
Drosophila RNAi knockdown experiments
For each of the 13 genes in which R/LF coding variants were associated with BMI, we searched for its corresponding orthologues in Drosophila in the ENSEMBL orthologue database. Orthologues were available for nine genes, but missing for ZBTB7B, MC4R, GIPR, and ZNF169. For each of the nine genes, we generated adipose-tissue (cg-Gal4) and neuronal (elav-Gal4) specific RNAi-knockdown crosses, leveraging upstream activation sequence (UAS)-inducible short-hairpin knockdown lines, available through the Vienna Drosophila Resource Center (VDRC). We crossed male UAS-RNAi flies and elav-GAL4 or CG-GAL4 virgin female flies. All fly experiments were carried out at 25 °C. Five-to-seven-day-old males were sorted into groups of 20, weighed and homogenated in PBS with 0,05% Tween with Lysing Matrix D in a beadshaker. The homogenate was heat-inactivated for 10 min in a thermocycler at 70 °C. 10µl of the homogenate was subsequently used in triglyceride assay (Sigma, Serum Triglyceride Determination Kit) which was carried out in duplicates according to protocol, with one alteration: the samples were cleared of residual particulate debris by centrifugation before absorbance reading. Resulting triglyceride values were normalized to fly weight and larval/population density. We used the non-parametric Kruskall-Wallis test to compare wild type with knockdown lines.
Enrichment analysis in monogenic genes of obesity
We identified 39 genes with strong evidence that disruption causes monogenic or syndromic forms of obesity (Supplementary Table 21). To test whether these genes are enriched for R/LF coding variant associations with BMI, we conducted simulations by matching each of the 39 genes with other genes based on gene length and number of variants tested, to create a matched set of genes. We generated 1,000 matched gene sets from our data and assessed how often the number of R/LF coding variants that exceeded given significance thresholds was greater in our monogenic/syndromic obesity gene set compared to the matched gene sets.
DATA AVAILABILITY
Summary statistics can be downloaded from http://portals.broadinstitute.org/collaboration/giant/index.php/GIANT_consortium
Supplementary Material
Acknowledgments
Alex Reiners was supported by R01DK089256. Alex Hewitt is supported by an NHMRC Practitioner Fellowship (APP1103329). Alisa Manning received funding from NIH/NIDDK K01 DK107836. Andrew Hattersley is a Wellcome Trust Senior Investigator (WT098395); and a NIH Research Senior Investigator. Andrew Morris is a Wellcome Trust Senior Fellow in Basic Biomedical Science (WT098017). Andrew Wood is supported by the European Research Council (SZ-245 50371-GLUCOSEGENES-FP7-IDEAS-ERC). Anne Jackson is supported by the American Heart Association (13POST16500011) and NIH (R01DK089256, R01DK101855, K99HL130580). Bratati Kahali and Elizabeth Speliotes were supported by the Doris Duke Medical Foundation, NIH (R01DK106621), the University of Michigan Internal Medicine Department, Division of Gastroenterology, the University of Michigan Biological Sciences Scholars Program and The Central Society for Clinical Research. Cristen Willer is supported by NIH (HL094535, HL109946). Daniel Liu is supported by R01HG008983 and R21DA040177. Daniel Witte is supported by the Danish Diabetes Academy, which is funded by the Novo Nordisk Foundation. Veiko Salomaa has been supported by the Finnish Foundation for Cardiovascular Research. Folkert Asselbergs is supported by a Dekker scholarship-Junior Staff Member 2014T001 Netherlands Heart Foundation and UCL Hospitals NIHR Biomedical Research Centre. Fotios Drenos is supported by the UK MRC (MC_UU_12013/1-9). Gabriela Partida received scholarship support from the University of Queensland and QIMR Berghofer. Guillaume Lettre is funded by the Montreal Heart Institute Foundation and the Canada Research Chair program. Hanieh Yaghootkar and Tim Frayling are supported by the European Research Council (323195; SZ-245 50371-GLUCOSEGENES-FP7-IDEAS-ERC). Iris Heid is supported by BMBF (01ER1206) and BMBF (01ER1507m), NIH and Max Planck Society. Jeff Haessler was supported by NHLBI R21HL121422. Joel Hirschhorn is supported by NIH R01DK075787. Kari North was supported by NIH (R01DK089256; R01HD057194; U01HG007416; R01DK101855), and AHA (13GRNT16490017). Manuel Rivas is supported by Nuffield Department of Clinical Medicine Award, Clarendon Scholarship. Mark McCarthy is a Wellcome Trust Senior Investigator (WT098381); and a NIH Research Senior Investigator. Mengmeng Du is supported by the NCI (R25CA94880, P30CA008748). Pal Njolstad is supported by the European Research Council (AdG; 293574), Research Council of Norway, University of Bergen, KG Jebsen Foundation, Helse Vest, Norwegian Diabetes Association. Patrick Ellinor is supported by the NIH (1R01HL092577, R01HL128914, K24HL105780), an Established Investigator Award from the American Heart Association (13EIA14220013) and by the Foundation Leducq (14CVD01). Paul Auer was supported by NHLBI R21HL121422 and R01DK089256. Paul Huang is support by NIH (NS33335, HL57818). Rebecca Fine is supported by NIH (T32GM096911). Ruth loos is supported by the NIH (R01DK110113, U01HG007417, R01DK101855, R01DK107786). Steven Lubitz is supported by NIH (K23HL114724) and a Doris Duke Charitable Foundation Clinical Scientist Development Award. Timothy Spector holds an ERC Advanced Principal Investigator award. Trevor Mori is supported by an Australian National Health and Medical Research Fellowship (APP1042255). Tune Pers received a Lundbeck Foundation and Benzon Foundation support. Valerie Turcot is supported by a postdoctoral fellowship from the Canadian Institutes of Health Research (CIHR). Zoltan Kutalik is supported by the Leenaards Foundation, Swiss National Science Foundation (31003A-143914) and SystemsX.ch (51RTP0_151019). Part of this work was conducted using the UK Biobank resource (Project Numbers 1251, 9072). A full list of acknowledgments appears in the Supplementary Note.
Footnotes
URLs
CDC 2000 Growth Charts: http://www.cdc.gov/growthcharts/cdc_charts.htm
CHOP cohort: http://www.metabolic-programming.org/obesity/
EC-DEPICT code: https://github.com/RebeccaFine/obesity-ec-depict
ENSEMBL: www.ensembl.org
EasyQC: www.genepi-regensburg.de/easyqc
EasyStrata: www.genepi-regensburg.de/easystrata
ExAC: http://exac.broadinstitute.org/
GCTA: http://cnsgenomics.com/software/gcta/
GTEx: http://www.gtexportal.org/home/
GTOOL: http://www.well.ox.ac.uk/~cfreeman/software/gwas/gtool.html
Impute2: https://mathgen.stats.ox.ac.uk/impute/impute_v2.html
INTERVAL Study: http://www.intervalstudy.org.uk/
PLINK v1.90: https://www.cog-genomics.org/plink2
QCTOOL: http://www.well.ox.ac.uk/~gav/qctool/#overview
RAREMETALWORKER: http://genome.sph.umich.edu/wiki/RAREMETALWORKER
RareMETALS: http://genome.sph.umich.edu/wiki/RareMETALS
RVTEST: https://github.com/zhanxw/rvtests
Shapeit2: https://mathgen.stats.ox.ac.uk/genetics_software/shapeit/shapeit.html
UKHLS: https://www.understandingsociety.ac.uk/
UK10K Obesity Sample Sets - SCOOP: http://www.uk10k.org/studies/obesity.html
1000 Genomes Phase 1: http://www.1000genomes.org/category/phase-1/
AUTHOR CONTRIBUTIONS
Writing Group (wrote and edited manuscript)
P.D., M.F.F., T.M.F., M. Graff, H.M.H, J.N.H., A.E.J., G.L., C.M.L, A.E.L., R.J.F.L., Y. Lu, K.E.N, C.S., V.T., K.L.Y.
Data preparation group (program development and quality control of data from contributing cohorts for meta-analyses)
T.A., I.B.B., T.E., S. Feng, M. Graff, H.M.H., A.E.J., T. Karaderi, D.J.L., K.S.L., A.E.L., R.J.F.L., Y. Lu, E. Marouli, N.G.D.M., M.C.M.G., P. Mudgal, M.C.Y.N., M.A.R., S.S., C.S., K. Stirrups, V.T., S.V., S.M.W., T.W.W., K.L.Y., X.Z.
BMI meta-analyses (discovery and follow-up, single-variant and gene-based)
I.B.B., T.M.F., H.M.H., A.E.J., J.N.H., C.T.L., D.J.L., Y. Lu, R.J.F.L., C.S., V.T., K.L.Y.
Childhood data (analyses and interpretation)
I. Barroso, J.P.B., I.S.F., S.F.A.G., H.H., V.M., A.E.H., G.M.
Pleiotropy working group
G.A., M. Boehnke, J.P.C., P.D., F.D., J.C.F., H.M.H., S. Kathiresan, H. Kitajima, C.M.L., D.J.L., R.J.F.L., A.M., E. Marouli, G.M., M.I.M., P.B.M., G.M.P., J.R.B.P., K.S.R., X.S., T.F.V., S.W., J.W., S.M.W., C.J.W.
Phenome-wide association studies
L. Bastarache, J.C.D., T.L.E., A.G., A.M., M.I.M.
Gene-set enrichment analyses
R.S.F., J.N.H., T.H.P., D.L., S.B., Z.K.
Monogenic and syndromic gene enrichment analyses
H.M.H., A.K.M.
Fly Obesity Screen
A. Lempradl, J.A. Pospisilik
Overseeing of contributing studies
(1958 Birth Cohort) P.D.; (Add Health) P.G.L., K.M.H.; (ADDITION-DK) D.R.W., M.E.J.; (AGES) V. Gudnason, T.B.H.; (Airwave) P.E.; (AMC PAS) G.K.H.; (Amish) J.R.O.; (ARIC) E.B.; (ARIC, Add Health) K.E.N.; (ASCOT-UK, ASCOT-UK) H.R.W., P.B.M.; (ATBC) S.M.; (Athero-Express Biobank Study) H.M.d.R., G.P.; (ATVB, Ottawa) S. Kathiresan; (BioVU) T.L.E.; (BRAVE) E.D.A., R.C.; (BRIGHT) P.B.M.; (CARDIA) M.F., P.J.S.; (CCHS) G.B.J.; (Cebu Longitudinal Health and Nutrition Survey) K.L.M.; (CGPS) B.G.N.; (CHD Exome + Consortium) A.S.B., J.M.M.H., D.F.R., J.D.; (CHES) R.V.; (CHOP) S.F.A.G., H.H.; (Clear/eMERGE (Seattle)) G.P.J.; (CROATIA_Korcula) V.V., O. Polasek, I.R.; (deCODE) K. Stefansson, U.T.; (DHS) D.W.B.; (DIABNORD) P.W.F.; (DIACORE) C.A.B.; (DPS) J.T., M.U.; (Duke) S. Kathiresan, Svati H. Shah; (EFSOCH) A.T. Hattersley, T.M.F.; (EGCUT) T.E.; (eMERGE (Seattle)) E.B.L.; (ENDO) A.P.M., K.T.Z.; (EPIC-Potsdam) M.B.S., H.B.; (EpiHealth) E.I., P.W.F.; (EUGENDA) A.I.d.H., S. Fauser; (EXTEND) A.T. Hattersley, T.M.F.; (Family Heart Study) I.B.B.; (Fenland, EPIC) R.A.S.; (Fenland, EPIC, InterAct) N.J.W., C.L.; (EPIC-CVD) J.D.; (FIA3) P.W.F.; (FINCAVAS) M. Kähönen, K.N.; (Finnish Twin Cohort) J. Kaprio; (FIN-D2D 2007) M.V.; (FINRISK) V. Salomaa; (FVG) P.G.; (GECCO) P.T.C., R.E.S.; (GeMEP) G. Tromp, D.J.C., H. Kuivaniemi; (GENDEP) G.B.; (Generation Scotland) C.H., S.P.; (Genetic Epidemiology Network of Arteriopathy (GENOA)) S.L.R.K., P.A.P.; (GLACIER) P.W.F., F. Renström; (GoDARTS) C.N.A.P., A.D.M.; (GRAPHIC) N.J.S.; (GSK-STABILITY) D.M.W., L.W., H.D.W.; (Health) A. Linneberg; (Health ABC) T.B.H., Y. Liu; (HELIC MANOLIS) E.Z., G. Dedoussis; (HELIC Pomak) E.Z., G. Dedoussis; (HUNT-MI) C.J.W.; (ID1000/Spinoza (BBMRI-NL)) S.H. Scholte; (Inter99) T.H., T.J.; (INTERVAL Study) J.D.; (IRASFS) N.D.P., E.K.S., L.E.W.; (Jackson Heart Study (JHS)) J.G.W.; (KORA S4) K. Strauch, A. Peters, I.M.H.; (LASA (BBMRI-NL)) M.d.H.; (LBC1921) J.M.S.; (LBC1921/LBC1936) I.J.D.; (Leipzig-Adults) M. Blüher, P. Kovacs; (LOLIPOP-Exome) J.C.C., J.S.K.; (LOLIPOP-OmniEE) J.C.C., J.S.K.; (Marshfield Clinic Personalized Medicine Research Project) M.H.B., P.L.P.; (Massachusetts General Hospital Cardiology and Metabolic Patient Cohort (CAMP)) P.L.H.; (MESA) J.I.R., X.G.; (Montreal Heart Institute Biobank (MHIBB)) M.P.D., G.L., J.D.R., J.C.T.; (MORGAM Central Laboratory) M.P.; (MORGAM Data Centre) K.K.; (OBB) F. Karpe; (Ophthalamic Western Australia Biobank & Blue Mountains Eye Study) A.W.H.; (PCOS) A.P.M., C.M.L.; (PIVUS) C.M.L., L.L.; (PRIME - Belfast) F. Kee; (PRIME - Lille) P.A.; (PRIME - Strasbourg) M.M.; (PRIME - Toulouse) J.F.; (PROLAPSE (BBMRI-NL)) K.B.K.; (PROMIS) D.S.; (PROSPER) N.S.; (QC) M.A.R.; (QIMR) G.W.M., D.R.N., A.C.H., S.E.M.; (Raine) A.W.H.; (RISC) B.B., E.F., M.W.; (Rotterdam Study I) A.G.U., A.H.F., M.A.I.; (SCOOP) I. Barroso, I.S.F.; (SEARCH) A.M.D.; (SHIP/SHIP-Trend) H.J.G.; (SIBS) D.F.E.; (SOLID TIMI-52) D.M.W.; M.L.O. (SORBS) A.P.M., M.S., A. Tönjes; (Southampton) A.J.L.; (The Hoorn Diabetes Care System Cohort study (BBMRI-NL)) N.v.L.; (The Mother Child Cohort of Norway) P.R.N., S.J.; (The Mount Sinai BioMe Biobank) E.P.B., R.J.F.L.; (The NEO Study) D.O.M.K.; (The NBS and NBCS) K.K.A.; (The NHAPC study, The GBTDS study) X.L.; (The Western Australian Pregnancy Cohort (Raine) Study) C.E.P., T.A.M.; (TUDR) W.H.H.S.; (TwinsUK) T.D.S.; (UCLA-Utrecht) R.A.O.; (UCP (BBMRI-NL)) M.C.H.d.G; (UKHLS) M. Kumari; (ULSAM) A.P.M.; (Utrecht Health Project) F.W.A.; (Vejle Biobank) I. Brandslund, C.C., O. Pedersen; (WGHS) D.I.C., P.M.R.; (Women's Health Initiative) P.L.A., A.P.R.; (WOSCOPS) I.F.; (WTCCC-UKT2D) M.I.M., K.R.O.; (YFS) T.L., O.T.R.
Genotyping of contributing studies
(1958 Birth Cohort) K.E.S., S. Kanoni; (Add Health) P.G.L., E.M.L., L.A. Lange, A.L.M.; (ADDITION-DK) A.P.G.; (Airwave) E.E., M.P.S.L.; (AMC PAS) S.S.; (Amish) L.M.Y.A., J.A. Perry; (ARIC) E.W.D., M.L.G.; (ASCOT-UK, ASCOT-SC) P.B.M.; (Athero-Express Biobank Study) S.W.v.d.L.; (BBMRI-NL) S.H.V.L.B., C.M.v.D., P.I.W.d.B.; (BRAVE) E.D.A.; (Cambridge Cancer Studies) J.G.D.; (CARDIA) M.F.; (CCHS) A. Tybjaerg-Hansen, A.V.; (CGPS) B.G.N., S.F.N.; (CHD Exome + Consortium) A.S.B., J.M.M.H., D.F.R., J.D., R.Y.; (CHOP) S.F.A.G., H.H.; (CIHDS) M. Benn, R.F.S.; (Clear/eMERGE (Seattle)) G.P.J.; (CROATIA_Korcula) V.V.; (DIABNORD) P.W.F.; (DIACORE) C.A.B., M. Gorski; (DPS) J.T.; (DR’s EXTRA) T.A.L., R.R.; (Duke) S. Kathiresan; (EGCUT) T.E., L. Milani; (ENDO) A.P.M.; (EPIC-Potsdam) M.B.S., K.M.; (EpiHealth) E.I., P.W.F.; (EUGENDA) A.I.d.H.; (Family Heart Study) K.D.T.; (Fenland, EPIC) R.A.S.; (Fenland, EPIC, InterAct) N.J.W., C.L.; (FINCAVAS) M. Kähönen; (Finnish Twin Cohort) A. Loukola; (FUSION) M. Boehnke, F.S.C.; (FVG) I.G.; (GECCO) P.T.C., R.E.S.; (GeMEP) G. Tromp, D.J.C., H. Kuivaniemi; (Generation Scotland) C.H.; (Genetic Epidemiology Network of Arteriopathy (GENOA)) S.L.R.K.; (GLACIER) P.W.F.; (GoDARTS) C.N.A.P.; (GRAPHIC) N.J.S.; (GSK-STABILITY) D.M.W., M.L.O.; (Health) J.B.J.; (Health ABC) T.B.H., Y. Liu; (Health and Retirement Study (HRS)) J.D.F., Wei Zhao; (HELIC MANOLIS) L. Southam; (HELIC Pomak) L. Southam; (ID1000/Spinoza (BBMRI-NL)) A.R.H.; (Inter99) T.H., N.G.; (INTERVAL Study) C.M., J.S., W.O., D.J.R., A.B.; (IRASFS) N.D.P.; (KORA) M.M.N.; (KORA S4) K. Strauch; (LBC1921/LBC1936) G. Davies; (Leipzig-Adults) A.M.; (LOLIPOP-Exome) J.C.C., J.S.K.; (LOLIPOP-OmniEE) J.C.C., J.S.K.; (Marshfield Clinic Personalized Medicine Research Project) M.H.B.; (MESA) J.I.R., Y.D.I.C., K.D.T.; (METSIM) J. Kuusisto, M.L.; (Montreal Heart Institute Biobank (MHIBB)) M.P.D.; (The NHAPC study, The GBTDS study) Y.W.; (OBB) F. Karpe; (Ophthalamic Western Australia Biobank & Blue Mountains Eye Study) A.W.H.; (PCOS) A.P.M.; (PIVUS) C.M.L.; (PROLAPSE (BBMRI-NL)) K.B.K.; (QIMR) G.W.M, D.R.N.; (Raine) A.W.H.; (Rotterdam Study I) A.G.U., M.C.M.G., F. Rivadeneira; (SDC) H.V.; (SEARCH) A.M.D.; (SHIP/SHIP-Trend) U.V.; (SOLID TIMI-52) D.M.W., M.L.O.; (SORBS) A.P.M.; (Southampton) A.J.L., H.L.G.; (SR) S.C., A.D.E.; (The Hoorn Diabetes Care System Cohort study (BBMRI-NL)) N.v.L.; (The Mother Child Cohort of Norway) O.H.; (The Mount Sinai BioMe Biobank) E.P.B., R.J.F.L., Y. Lu, C.S.; (The NEO Study) R.L.G.; (The NBS and NBCB) L.A.K.; (The NHAPC study, The GBTDS study) X.L., H. Li, Y.H.; (The Western Australian Pregnancy Cohort (Raine) Study) C.E.P.; (TUDR) E.K.; (TwinsUK) A.P.M.; (UCLA-Utrecht) R.A.O.; (UCP (BBMRI-NL)) M.C.H.d.G.; (UKHLS) M. Kumari; (ULSAM) A.P.M.; (Utrecht Health Project) M.L.B.; (WGHS) D.I.C., A.Y.C.; (Women's Health Initiative) C.K., A.P.R.; (WOSCOPS) C.J.P.; (WTCCC-UKT2D) M.I.M.; (YFS) T.L., L.P.L.
Phenotyping of contributing studies
(Add Health) P.G.L., K.M.H.; (ADDITION-DK) D.R.W.; (Airwave) E.E.; (AMC PAS) S.S.; (Amish) L.M.Y.A.; (ARIC) E.W.D.; (ARIC, Add Health) K.E.N; (ASCOT-SC) M.J.C.; (ATBC) S.M.; (BBMRI-NL) S.H.V.; (BioVU) T.L.E., D.R.V.E.; (Blue Mountains Eye Study) P. Mitchell; (BRAVE) E.D.A.; (BRIGHT) M.J.C.; (CARDIA) C.E.L., (CARL) A. Robino; (CCHS) G.B.J., A. Tybjaerg-Hansen, A.V.; (Cebu Longitudinal Health and Nutrition Survey) N.R.L.; (CGPS) B.G.N., P.R.K.; (CHD Exome + Consortium) A.S.B., J.M.M.H., D.F.R., J.D., R.Y.; (CHES) R.V., R.M.C.; (CHOP) S.F.A.G., H.H., J.P.B.; (CIHDS) R.F.S., L.E.B.; (Clear/eMERGE (Seattle)) G.P.J., A.A.B.; (CROATIA_Korcula) O. Polasek, I.R.; (DIABNORD) O.R.; (DIACORE) C.A.B., M.R.; (DPS) A.U.J., J. Lindström; (DR’s EXTRA) P. Komulainen, T.A.L., R.R.; (Duke) S. H. Shah; (EFSOCH) A.T. Hattersley; (EGCUT) D.E., A.F.; (ENDO) K.T.Z.; (EPIC-Potsdam) H.B.; (EPIC-CVD) A.B.; (EpiHealth) E.I.; (EUGENDA) S. Fauser; (EXTEND) A.T. Hattersley; (Family Heart Study) M.F.F.; (Fenland, EPIC, InterAct) N.J.W.; (FIA3) J.H.J.; (FINCAVAS) M. Kähönen, K.N.; (Finnish Twin Cohort) J. Kaprio; (FINRISK) V. Salomaa; (FUSION) A.J.S., N.N.; (FVG) E.C.; (GECCO) P.T.C., R.E.S.; (GeMEP) G. Tromp; (Generation Scotland) C.H.; (Genetic Epidemiology Network of Arteriopathy (GENOA)) S.L.R.K.; (GLACIER) F. Renström; (GoDARTS) C.N.A.P., A.D.M.; (GRAPHIC) N.J.S.; (GSK-STABILITY) L.W., H.D.W.; (Health) A. Linneberg, B.H.T.; (Health ABC) T.B.H., Y. Liu; (Health and Retirement Study (HRS)) J.D.F.; (HELIC MANOLIS) L. Southam, A.E.F., E.T.; (HELIC Pomak) L. Southam, A.E.F., M. Karaleftheri; (HUNT-MI) O.L.H.; (BBMRI-NL)) S.H. Scholte, A.R.H.; (Inter99) T.J., N.G.; (INTERVAL Study) C.M., J.S., W.O., D.J.R.; (IRASFS) N.D.P., B.K., L.E.W.; (KORA) M.M.N.; (KORA S4) A. Peters; (LBC1921) J.M.S., A. Pattie; (LBC1921/LBC1936) I.J.D.; (LBC1936) J.C.; (Leipzig-Adults) M. Blüher, P. Kovacs; (LOLIPOP-Exome) J.C.C., J.S.K.; (LOLIPOP-OmniEE) J.C.C., J.S.K.; (Marshfield Clinic Personalized Medicine Research Project) P.L.P., T.N.P.; (Massachusetts General Hospital Cardiology and Metabolic Patient Cohort (CAMP)) S.A.L., P.T.E.; (MESA) M.A.; (METSIM) X.S.; (Montreal Heart Institute Biobank (MHIBB)) G.L., K.S.L., V.T.; (MORGAM Data Centre) K.K.; (The NHAPC study, The GBTDS study) X.L.; (NESCOG (BBMRI-NL)) T.J.P.; (OBB) F. Karpe, M.N.; (Ophthalamic Western Australia Biobank & Blue Mountains Eye Study) A.W.H.; (PCOS) C.M.L.; (PIVUS) L.L.; (PRIME - Belfast) F. Kee; (PRIME - Lille) P.A.; (PRIME - Strasbourg) M.M.; (PRIME - Toulouse) J.F.; (PROLAPSE (BBMRI-NL)) K.B.K.; (PROSPER) S.T.; (QIMR) G.W.M., D.R.N., A.C.H., S.E.M.; (Raine) A.W.H.; (RISC) B.B., E.F.; (Rotterdam Study I) O.H.F., M.A.I., M.C.M.G., F. Rivadeneira; (SDC) E.R.B.P.; (SHIP, SHIP-TREND) N.L., (SORBS) M.S., A. Tönjes; (Southampton) A.J.L., H.L.G.; (SR) M. Brumat; (The Mother Child Cohort of Norway) P.R.N., O.H.; (The Mount Sinai BioMe Biobank) E.P.B., Y. Lu, C.S.; (The NEO Study) R.d.M.; (The NBS and NBCS) K.K.A., L.A.K., T.E.G.; (The NHAPC study, The GBTDS study) X.L., H. Li, L. Sun, F.W.; (The Western Australian Pregnancy Cohort (Raine) Study) C.E.P., T.A.M.; (TUDR) W.H.H.S., K.H.L.; (TwinsUK) T.D.S., K.S.S.; (UCLA-Utrecht) R.S.K.; (UCP (BBMRI-NL)) M.C.H.d.G.; (UKGPCS) A. Lophatananon; (UKHLS) M. Kumari; (ULSAM) V. Giedraitis; (Utrecht Health Project) M.L.B.; (WGHS) D.I.C., P.M.R.; (Women's Health Initiative) C.K.; (WOSCOPS) C.J.P.; (WTCCC-UKT2D) M.I.M., K.R.O.; (YFS) T.L., O.T.R.
Data analysis of contributing studies
(1958 Birth Cohort) K.E.S., S.E.A.; (AGES) A.V.S.; (Airwave) E.E., M.P.S.L.; (AMC PAS) S.S.; (Amish) J.R.O., L.M.Y.A., J.A. Perry; (ARIC, Add Health) K.E.N., K.L.Y., M. Graff; (ASCOT-UK, ASCOT-SC) H.R.W.; H.Y.; (Athero-Express Biobank Study) S.W.v.d.L.; (ATVB, Ottawa) H.T.; (BBMRI-NL) L. Broer; (BioVU) T.L.E., A.G.; (BRAVE) R.C., D.S.A.; (BRIGHT) H.R.W.; (Cambridge Cancer Studies) J.G.D., A. Pirie, D.J.T.; (CARDIA) M.F., L.-A. Lin; (CARL) A. Robino, M.C., D.V.; (Cebu Longitudinal Health and Nutrition Survey) Y. Wu; (CHD Exome + Consortium) A.S.B., J.M.M.H., D.F.R., R.Y., P.S.; (CHES) Y.J.; (CHOP) J.P.B.; (CROATIA_Korcula) V.V.; (deCODE) V. Steinthorsdottir, G. Thorleifsson; (DHS) A.J.C., P. Mudgal, M.C.Y.N.; (DIABNORD) T.V.V.; (DIACORE) C.A.B., M. Gorski, M.R.; (Duke) A.P.P.; (EFSOCH) H.Y.; (EGCUT) T.E.; (eMERGE (Seattle)) T.S.C.; (ENDO) A.M., Tugce Karaderi, N.R.R.; (EPIC) J.H.Z.; (EPIC-Potsdam) K.M.; (EPIC-CVD) A.S.B., J.M.M.H., D.F.R., R.Y., P.S.; (EpiHealth) S.G.; (EUGENDA) J.C.G.; (EXTEND) H.Y.; (Family Heart Study) M.F.F.; (Fenland) J. Luan; (Fenland, EPIC) R.A.S.; (Fenland, InterAct) S.M.W.; (FIA3) T.V.V.; (FINCAVAS) J. Hernesniemi; (FIN-D2D 2007) H.P., M.U., M.V.; (Finnish Twin Cohort) L.H.; (FINRISK 2007 (T2D)) T. Korhonen, S.M., L. Moilanen, H.M.S.; (Finrisk Extremes and QC) S.V.; (Framingham Heart Study) C.T.L., N.L.H.C.; (FVG) I.G.; (GECCO) M.D.; (GeMEP) G. Tromp; (GENDEP) K.E.T., R.U.; (Generation Scotland) C.H., J.E.H.; (Genetic Epidemiology Network of Arteriopathy (GENOA)) L.F.B.; (GIANT-Analyst) A.E.J.; (GLACIER) T.V.V.; (GoDARTS) A.M.; (GRAPHIC) N.J.S., N.G.D.M., C.P.N.; (GSK-STABILITY) D.M.W., A.J.S.; (Health) J.B.J.; (Health ABC) M.A.N.; (Health and Retirement Study (HRS)) Wei Zhao, E.B.W.; (HELIC MANOLIS) L. Southam; (HELIC Pomak) L. Southam; (HUNT-MI) W. Zhou; (Inter99) N.G.; (INTERVAL Study) A.S.B.; (IRASFS) N.D.P., B.K.; (Jackson Heart Study (JHS)) L.A. Lange, J. Li; (KORA S4) T.W.W.; (LBC1921/LBC1936) G. Davies; (Leipzig-Adults) A.M.; (LOLIPOP-Exome) J.C.C., J.S.K., W. Zhang; (LOLIPOP-OmniEE) J.C.C., J.S.K., W. Zhang; (Massachusetts General Hospital Cardiology and Metabolic Patient Cohort (CAMP)) S.A.L., H. Lin; (MESA) J.I.R., X.G., J.Y.; (METSIM) J. Kuusisto, M.L., X.S.; (MONICA-Brianza) G.V.; (Montreal Heart Institute Biobank (MHIBB)) G.L., K.S.L., V.T.; (The NHAPC study, The GBTDS study) P.Y.; (OBB) A.M.; (Ophthalamic Western Australia Biobank & Blue Mountains Eye Study) G.C.P.; (PCOS) A.M., T. Karaderi, N.R.R.; (PIVUS) A.M., Tugce Karaderi, N.R.R.; (PROLAPSE (BBMRI-NL)) K.B.K.; (PROMIS) A. Rasheed, Wei Zhao; (PROSPER) J.W.J.; (QC GoT2D/T2D-GENES (FUSION, METSIM, etc)) A.E.L.; (QIMR) Y.S.; (RISC) H.Y.; (Rotterdam Study I) M.C.M.G., F. Rivadeneira; (SCOOP) V.M., A.E.H., G.M.; (SDC) C.T.H.; (SHIP/SHIP-Trend) A. Teumer; (SOLID TIMI-52) D.M.W., A.J.S.; (SORBS) A.P.M.; (Southampton) J.G.; (The Hoorn Diabetes Care System Cohort study (BBMRI-NL)) N.v.L.; (The Mother Child Cohort of Norway) S.J., O.H.; (The Mount Sinai BioMe Biobank) Y. Lu, C.S.; (The NEO Study) R.L.G.; (The NHAPC study, The GBTDS study) X.L., H. Li, Y.H.; (The Western Australian Pregnancy Cohort (Raine) Study) C.A.W.; (UCLA-Utrecht) L.M.O.L.; (UCP (BBMRI-NL)) M.C.H.d.G.; (UK Biobank) A.R.W., T.M.F.; (UKGPCS) A. Lophatananon; (UKHLS) M. Kumari; (UKOPS) J.P.T.; (ULSAM) A.M., T. Karaderi, N.R.R.; (Utrecht Health Project) J.v.S.; (WGHS) D.I.C., A.Y.C.; (Women's Health Initiative) P.L.A., J. Haessler; (WOSCOPS) I.F., S.P.; (WTCCC-UKT2D) W.G.; (YFS) L.P.L.
References
- 1.Bray GA, Ryan DH. Update on obesity pharmacotherapy. Ann N Y Acad Sci. 2014;1311:1–13. doi: 10.1111/nyas.12328. [DOI] [PubMed] [Google Scholar]
- 2.Bray GA, Fruhbeck G, Ryan DH, Wilding JP. Management of obesity. Lancet. 2016;387:1947–56. [Google Scholar]
- 3.Monda KL, et al. A meta-analysis identifies new loci associated with body mass index in individuals of African ancestry. Nat Genet. 2013;45:690–6. doi: 10.1038/ng.2608. [DOI] [PMC free article] [PubMed] [Google Scholar]
- 4.Wen W, et al. Meta-analysis of genome-wide association studies in East Asian-ancestry populations identifies four new loci for body mass index. Hum Mol Genet. 2014;23:5492–504. doi: 10.1093/hmg/ddu248. [DOI] [PMC free article] [PubMed] [Google Scholar]
- 5.Locke AE, et al. Genetic studies of body mass index yield new insights for obesity biology. Nature. 2015;518:197–206. doi: 10.1038/nature14177. [DOI] [PMC free article] [PubMed] [Google Scholar]
- 6.Winkler TW, et al. The Influence of Age and Sex on Genetic Associations with Adult Body Size and Shape: A Large-Scale Genome-Wide Interaction Study. PLoS Genet. 2015;11:e1005378. doi: 10.1371/journal.pgen.1005378. [DOI] [PMC free article] [PubMed] [Google Scholar]
- 7.Akiyama M, et al. Genome-wide association study identifies 112 new loci for body mass index in the Japanese population. Nat Genet. 2017;49:1458–1467. doi: 10.1038/ng.3951. [DOI] [PubMed] [Google Scholar]
- 8.van der Klaauw AA, Farooqi IS. The hunger genes: pathways to obesity. Cell. 2015;161:119–32. doi: 10.1016/j.cell.2015.03.008. [DOI] [PubMed] [Google Scholar]
- 9.Edwards SL, Beesley J, French JD, Dunning AM. Beyond GWASs: illuminating the dark road from association to function. Am J Hum Genet. 2013;93:779–97. doi: 10.1016/j.ajhg.2013.10.012. [DOI] [PMC free article] [PubMed] [Google Scholar]
- 10.Stratigopoulos G, et al. Hypomorphism of Fto and Rpgrip1l causes obesity in mice. J Clin Invest. 2016;126:1897–910. doi: 10.1172/JCI85526. [DOI] [PMC free article] [PubMed] [Google Scholar]
- 11.Stratigopoulos G, LeDuc CA, Cremona ML, Chung WK, Leibel RL. Cut-like homeobox 1 (CUX1) regulates expression of the fat mass and obesity-associated and retinitis pigmentosa GTPase regulator-interacting protein-1-like (RPGRIP1L) genes and coordinates leptin receptor signaling. J Biol Chem. 2011;286:2155–70. doi: 10.1074/jbc.M110.188482. [DOI] [PMC free article] [PubMed] [Google Scholar]
- 12.Stratigopoulos G, et al. Hypomorphism for RPGRIP1L, a ciliary gene vicinal to the FTO locus, causes increased adiposity in mice. Cell Metab. 2014;19:767–79. doi: 10.1016/j.cmet.2014.04.009. [DOI] [PMC free article] [PubMed] [Google Scholar]
- 13.Claussnitzer M, et al. FTO Obesity Variant Circuitry and Adipocyte Browning in Humans. N Engl J Med. 2015;373:895–907. doi: 10.1056/NEJMoa1502214. [DOI] [PMC free article] [PubMed] [Google Scholar]
- 14.Smemo S, et al. Obesity-associated variants within FTO form long-range functional connections with IRX3. Nature. 2014;507:371–5. doi: 10.1038/nature13138. [DOI] [PMC free article] [PubMed] [Google Scholar]
- 15.Marouli E, et al. Rare and low-frequency coding variants alter human adult height. Nature. 2017 doi: 10.1038/nature21039. [DOI] [PMC free article] [PubMed] [Google Scholar]
- 16.Fuchsberger C, et al. The genetic architecture of type 2 diabetes. Nature. 2016;536:41–7. doi: 10.1038/nature18642. [DOI] [PMC free article] [PubMed] [Google Scholar]
- 17.Sina M, et al. Phenotypes in three pedigrees with autosomal dominant obesity caused by haploinsufficiency mutations in the melanocortin-4 receptor gene. Am J Hum Genet. 1999;65:1501–7. doi: 10.1086/302660. [DOI] [PMC free article] [PubMed] [Google Scholar]
- 18.Pearce LR, et al. KSR2 mutations are associated with obesity, insulin resistance, and impaired cellular fuel oxidation. Cell. 2013;155:765–77. doi: 10.1016/j.cell.2013.09.058. [DOI] [PMC free article] [PubMed] [Google Scholar]
- 19.Hinney A, et al. Several mutations in the melanocortin-4 receptor gene including a nonsense and a frameshift mutation associated with dominantly inherited obesity in humans. J Clin Endocrinol Metab. 1999;84:1483–6. doi: 10.1210/jcem.84.4.5728. [DOI] [PubMed] [Google Scholar]
- 20.Purcell SM, et al. A polygenic burden of rare disruptive mutations in schizophrenia. Nature. 2014;506:185–90. doi: 10.1038/nature12975. [DOI] [PMC free article] [PubMed] [Google Scholar]
- 21.van den Berg L, et al. Melanocortin-4 receptor gene mutations in a Dutch cohort of obese children. Obesity (Silver Spring) 2011;19:604–11. doi: 10.1038/oby.2010.259. [DOI] [PubMed] [Google Scholar]
- 22.Surendran P, et al. Trans-ancestry meta-analyses identify rare and common variants associated with blood pressure and hypertension. Nat Genet. 2016;48:1151–1161. doi: 10.1038/ng.3654. [DOI] [PMC free article] [PubMed] [Google Scholar]
- 23.Lunetta KL, et al. Rare coding variants and X-linked loci associated with age at menarche. Nat Commun. 2015;6:7756. doi: 10.1038/ncomms8756. [DOI] [PMC free article] [PubMed] [Google Scholar]
- 24.GIANT. Include reference to GIANT WHR paper.
- 25.Zhou Z, et al. Cidea-deficient mice have lean phenotype and are resistant to obesity. Nat Genet. 2003;35:49–56. doi: 10.1038/ng1225. [DOI] [PubMed] [Google Scholar]
- 26.Tews D, et al. Comparative gene array analysis of progenitor cells from human paired deep neck and subcutaneous adipose tissue. Mol Cell Endocrinol. 2014;395:41–50. doi: 10.1016/j.mce.2014.07.011. [DOI] [PubMed] [Google Scholar]
- 27.Stutzmann F, et al. Non-synonymous polymorphisms in melanocortin-4 receptor protect against obesity: the two facets of a Janus obesity gene. Hum Mol Genet. 2007;16:1837–44. doi: 10.1093/hmg/ddm132. [DOI] [PubMed] [Google Scholar]
- 28.Lin HQ, Wang Y, Chan KL, Ip TM, Wan CC. Differential regulation of lipid metabolism genes in the brain of acetylcholinesterase knockout mice. J Mol Neurosci. 2014;53:397–408. doi: 10.1007/s12031-014-0267-x. [DOI] [PubMed] [Google Scholar]
- 29.Vignaud A, et al. Genetic ablation of acetylcholinesterase alters muscle function in mice. Chem Biol Interact. 2008;175:129–30. doi: 10.1016/j.cbi.2008.04.035. [DOI] [PubMed] [Google Scholar]
- 30.Ji Z, Mei FC, Cheng X. Epac, not PKA catalytic subunit, is required for 3T3-L1 preadipocyte differentiation. Front Biosci (Elite Ed) 2010;2:392–8. doi: 10.2741/e99. [DOI] [PMC free article] [PubMed] [Google Scholar]
- 31.Yan J, et al. Enhanced leptin sensitivity, reduced adiposity, and improved glucose homeostasis in mice lacking exchange protein directly activated by cyclic AMP isoform 1. Mol Cell Biol. 2013;33:918–26. doi: 10.1128/MCB.01227-12. [DOI] [PMC free article] [PubMed] [Google Scholar]
- 32.Almahariq M, Mei FC, Cheng X. Cyclic AMP sensor EPAC proteins and energy homeostasis. Trends Endocrinol Metab. 2014;25:60–71. doi: 10.1016/j.tem.2013.10.004. [DOI] [PMC free article] [PubMed] [Google Scholar]
- 33.Kai AK, et al. Exchange protein activated by cAMP 1 (Epac1)-deficient mice develop beta-cell dysfunction and metabolic syndrome. FASEB J. 2013;27:4122–35. doi: 10.1096/fj.13-230433. [DOI] [PubMed] [Google Scholar]
- 34.Hardie DG, Ross FA, Hawley SA. AMPK: a nutrient and energy sensor that maintains energy homeostasis. Nat Rev Mol Cell Biol. 2012;13:251–62. doi: 10.1038/nrm3311. [DOI] [PMC free article] [PubMed] [Google Scholar]
- 35.Hardie DG, Ashford ML. AMPK: regulating energy balance at the cellular and whole body levels. Physiology (Bethesda) 2014;29:99–107. doi: 10.1152/physiol.00050.2013. [DOI] [PMC free article] [PubMed] [Google Scholar]
- 36.Lopez M, Nogueiras R, Tena-Sempere M, Dieguez C. Hypothalamic AMPK: a canonical regulator of whole-body energy balance. Nat Rev Endocrinol. 2016;12:421–32. doi: 10.1038/nrendo.2016.67. [DOI] [PubMed] [Google Scholar]
- 37.Minokoshi Y, et al. AMP-kinase regulates food intake by responding to hormonal and nutrient signals in the hypothalamus. Nature. 2004;428:569–74. doi: 10.1038/nature02440. [DOI] [PubMed] [Google Scholar]
- 38.Viollet B, et al. The AMP-activated protein kinase alpha2 catalytic subunit controls whole-body insulin sensitivity. J Clin Invest. 2003;111:91–8. doi: 10.1172/JCI16567. [DOI] [PMC free article] [PubMed] [Google Scholar]
- 39.Xue B, et al. Neuronal protein tyrosine phosphatase 1B deficiency results in inhibition of hypothalamic AMPK and isoform-specific activation of AMPK in peripheral tissues. Mol Cell Biol. 2009;29:4563–73. doi: 10.1128/MCB.01914-08. [DOI] [PMC free article] [PubMed] [Google Scholar]
- 40.Warren HR, et al. Genome-wide association analysis identifies novel blood pressure loci and offers biological insights into cardiovascular risk. Nat Genet. 2017 doi: 10.1038/ng.3768. [DOI] [PMC free article] [PubMed] [Google Scholar]
- 41.Chami N, et al. Exome Genotyping Identifies Pleiotropic Variants Associated with Red Blood Cell Traits. Am J Hum Genet. 2016;99:8–21. doi: 10.1016/j.ajhg.2016.05.007. [DOI] [PMC free article] [PubMed] [Google Scholar]
- 42.Li M, et al. SOS2 and ACP1 Loci Identified through Large-Scale Exome Chip Analysis Regulate Kidney Development and Function. J Am Soc Nephrol. 2016 doi: 10.1681/ASN.2016020131. [DOI] [PMC free article] [PubMed] [Google Scholar]
- 43.Liu C, et al. Meta-analysis identifies common and rare variants influencing blood pressure and overlapping with metabolic trait loci. Nat Genet. 2016;48:1162–70. doi: 10.1038/ng.3660. [DOI] [PMC free article] [PubMed] [Google Scholar]
- 44.Schwartz MW, Woods SC, Porte D, Jr, Seeley RJ, Baskin DG. Central nervous system control of food intake. Nature. 2000;404:661–671. doi: 10.1038/35007534. [DOI] [PubMed] [Google Scholar]
- 45.Garfield AS, et al. A neural basis for melanocortin-4 receptor-regulated appetite. Nat Neurosci. 2015;18:863–71. doi: 10.1038/nn.4011. [DOI] [PMC free article] [PubMed] [Google Scholar]
- 46.Huszar D, et al. Targeted disruption of the melanocortin-4 receptor results in obesity in mice. Cell. 1997;88:131–141. doi: 10.1016/s0092-8674(00)81865-6. [DOI] [PubMed] [Google Scholar]
- 47.Fan W, Boston BA, Kesterson RA, Hruby Vj, Cone RD. Role of melanocortinergic neurons in feeding and the agouti obesity syndrome. Nature. 1997;385:165–168. doi: 10.1038/385165a0. [DOI] [PubMed] [Google Scholar]
- 48.Yeo GSH, et al. A frameshift mutation in MC4R associated with dominantly inherited human obesity. Nature Genetics. 1998;20:111–112. doi: 10.1038/2404. [DOI] [PubMed] [Google Scholar]
- 49.Vaisse C, Clement K, Guy-Grand B, Froguel P. A frameshift mutation in human MC4R is associated with a dominant form of obesity. Nature Genetics. 1998;20:113–114. doi: 10.1038/2407. [DOI] [PubMed] [Google Scholar]
- 50.Farooqi IS, et al. Clinical Spectrum of Obesity and Mutations in the Melanocortin 4 Receptor Gene. The New England Journal of Medicine. 2003;348:1085–1095. doi: 10.1056/NEJMoa022050. [DOI] [PubMed] [Google Scholar]
- 51.Lubrano-Berthelier C, et al. Melanocortin 4 receptor mutations in a large cohort of severely obese adults: prevalence, functional classification, genotype-phenotype relationship, and lack of association with binge eating. J Clin Endocrinol Metab. 2006;91:1811–8. doi: 10.1210/jc.2005-1411. [DOI] [PubMed] [Google Scholar]
- 52.Lek M, et al. Analysis of protein-coding genetic variation in 60,706 humans. Nature. 2016;536:285–91. doi: 10.1038/nature19057. [DOI] [PMC free article] [PubMed] [Google Scholar]
- 53.Hinney A, et al. Melanocortin-4 receptor gene: case-control study and transmission disequilibrium test confirm that functionally relevant mutations are compatible with a major gene effect for extreme obesity. J Clin Endocrinol Metab. 2003;88:4258–67. doi: 10.1210/jc.2003-030233. [DOI] [PubMed] [Google Scholar]
- 54.Saxena R, et al. Genetic variation in GIPR influences the glucose and insulin responses to an oral glucose challenge. Nat Genet. 2010;42:142–8. doi: 10.1038/ng.521. [DOI] [PMC free article] [PubMed] [Google Scholar]
- 55.Speliotes EK, et al. Association analyses of 249,796 individuals reveal 18 new loci associated with body mass index. Nat Genet. 2010;42:937–948. doi: 10.1038/ng.686. [DOI] [PMC free article] [PubMed] [Google Scholar]
- 56.Miyawaki K, et al. Inhibition of gastric inhibitory polypeptide signaling prevents obesity. Nat Med. 2002;8:738–742. doi: 10.1038/nm727. [DOI] [PubMed] [Google Scholar]
- 57.Hansotia T, et al. Extrapancreatic incretin receptors modulate glucose homeostasis, body weight, and energy expenditure. J Clin Invest. 2007;117:143–52. doi: 10.1172/JCI25483. [DOI] [PMC free article] [PubMed] [Google Scholar]
- 58.Fulurija A, et al. Vaccination against GIP for the treatment of obesity. PLoS One. 2008;3:e3163. doi: 10.1371/journal.pone.0003163. [DOI] [PMC free article] [PubMed] [Google Scholar]
- 59.Finan B, et al. Reappraisal of GIP Pharmacology for Metabolic Diseases. Trends Mol Med. 2016;22:359–76. doi: 10.1016/j.molmed.2016.03.005. [DOI] [PubMed] [Google Scholar]
- 60.Irwin N, Flatt PR. Evidence for beneficial effects of compromised gastric inhibitory polypeptide action in obesity-related diabetes and possible therapeutic implications. Diabetologia. 2009;52:1724–31. doi: 10.1007/s00125-009-1422-8. [DOI] [PubMed] [Google Scholar]
- 61.Revelli JP, et al. Profound obesity secondary to hyperphagia in mice lacking kinase suppressor of ras 2. Obesity (Silver Spring) 2011;19:1010–8. doi: 10.1038/oby.2010.282. [DOI] [PubMed] [Google Scholar]
- 62.Costanzo-Garvey DL, et al. KSR2 is an essential regulator of AMP kinase, energy expenditure, and insulin sensitivity. Cell Metab. 2009;10:366–78. doi: 10.1016/j.cmet.2009.09.010. [DOI] [PMC free article] [PubMed] [Google Scholar]
- 63.Brommage R, et al. High-throughput screening of mouse knockout lines identifies true lean and obese phenotypes. Obesity (Silver Spring) 2008;16:2362–7. doi: 10.1038/oby.2008.361. [DOI] [PubMed] [Google Scholar]
- 64.Liu L, et al. Proteomic characterization of the dynamic KSR-2 interactome, a signaling scaffold complex in MAPK pathway. Biochim Biophys Acta. 2009;1794:1485–95. doi: 10.1016/j.bbapap.2009.06.016. [DOI] [PubMed] [Google Scholar]
- 65.Kuhnen P, et al. Proopiomelanocortin Deficiency Treated with a Melanocortin-4 Receptor Agonist. N Engl J Med. 2016;375:240–6. doi: 10.1056/NEJMoa1512693. [DOI] [PubMed] [Google Scholar]
- 66.Beiroa D, et al. GLP-1 agonism stimulates brown adipose tissue thermogenesis and browning through hypothalamic AMPK. Diabetes. 2014;63:3346–58. doi: 10.2337/db14-0302. [DOI] [PubMed] [Google Scholar]
- 67.Xiang YY, Dong H, Yang BB, Macdonald JF, Lu WY. Interaction of acetylcholinesterase with neurexin-1beta regulates glutamatergic synaptic stability in hippocampal neurons. Mol Brain. 2014;7:15. doi: 10.1186/1756-6606-7-15. [DOI] [PMC free article] [PubMed] [Google Scholar]
- 68.Bartels CF, Zelinski T, Lockridge O. Mutation at codon 322 in the human acetylcholinesterase (ACHE) gene accounts for YT blood group polymorphism. Am J Hum Genet. 1993;52:928–36. [PMC free article] [PubMed] [Google Scholar]
- 69.Farlow MR, et al. Effectiveness and tolerability of high-dose (23 mg/d) versus standard-dose (10 mg/d) donepezil in moderate to severe Alzheimer's disease: A 24-week, randomized, double-blind study. Clin Ther. 2010;32:1234–51. doi: 10.1016/j.clinthera.2010.06.019. [DOI] [PMC free article] [PubMed] [Google Scholar]
- 70.Farlow M, et al. Safety and tolerability of donepezil 23 mg in moderate to severe Alzheimer's disease. BMC Neurol. 2011;11:57. doi: 10.1186/1471-2377-11-57. [DOI] [PMC free article] [PubMed] [Google Scholar]
- 71.Tariot P, Salloway S, Yardley J, Mackell J, Moline M. Long-term safety and tolerability of donepezil 23 mg in patients with moderate to severe Alzheimer's disease. BMC Res Notes. 2012;5:283. doi: 10.1186/1756-0500-5-283. [DOI] [PMC free article] [PubMed] [Google Scholar]
- 72.Hu Y, et al. Role of Exchange Protein Directly Activated by Cyclic AMP Isoform 1 in Energy Homeostasis: Regulation of Leptin Expression and Secretion in White Adipose Tissue. Mol Cell Biol. 2016;36:2440–50. doi: 10.1128/MCB.01034-15. [DOI] [PMC free article] [PubMed] [Google Scholar]
- 73.Altarejos JY, et al. The Creb1 coactivator Crtc1 is required for energy balance and fertility. Nat Med. 2008;14:1112–7. doi: 10.1038/nm.1866. [DOI] [PMC free article] [PubMed] [Google Scholar]
- 74.Winnier DA, et al. Transcriptomic identification of ADH1B as a novel candidate gene for obesity and insulin resistance in human adipose tissue in Mexican Americans from the Veterans Administration Genetic Epidemiology Study (VAGES) PLoS One. 2015;10:e0119941. doi: 10.1371/journal.pone.0119941. [DOI] [PMC free article] [PubMed] [Google Scholar]
- 75.Molotkov A, Deltour L, Foglio MH, Cuenca AE, Duester G. Distinct retinoid metabolic functions for alcohol dehydrogenase genes Adh1 and Adh4 in protection against vitamin A toxicity or deficiency revealed in double null mutant mice. J Biol Chem. 2002;277:13804–11. doi: 10.1074/jbc.M112039200. [DOI] [PMC free article] [PubMed] [Google Scholar]
- 76.G. TEx Consortium. Human genomics. The Genotype-Tissue Expression (GTEx) pilot analysis: multitissue gene regulation in humans. Science. 2015;348:648–60. doi: 10.1126/science.1262110. [DOI] [PMC free article] [PubMed] [Google Scholar]
- 77.Volpicelli-Daley LA, Duysen EG, Lockridge O, Levey AI. Altered hippocampal muscarinic receptors in acetylcholinesterase-deficient mice. Ann Neurol. 2003;53:788–96. doi: 10.1002/ana.10589. [DOI] [PubMed] [Google Scholar]
- 78.Ivanenkov VV, Murphy-Piedmonte DM, Kirley TL. Bacterial expression, characterization, and disulfide bond determination of soluble human NTPDase6 (CD39L2) nucleotidase: implications for structure and function. Biochemistry. 2003;42:11726–35. doi: 10.1021/bi035137r. [DOI] [PubMed] [Google Scholar]
- 79.Jain RN, et al. Hip1r is expressed in gastric parietal cells and is required for tubulovesicle formation and cell survival in mice. J Clin Invest. 2008;118:2459–70. doi: 10.1172/JCI33569. [DOI] [PMC free article] [PubMed] [Google Scholar]
- 80.Engqvist-Goldstein AE, et al. RNAi-mediated Hip1R silencing results in stable association between the endocytic machinery and the actin assembly machinery. Mol Biol Cell. 2004;15:1666–79. doi: 10.1091/mbc.E03-09-0639. [DOI] [PMC free article] [PubMed] [Google Scholar]
- 81.Tao YX. The melanocortin-4 receptor: physiology, pharmacology, and pathophysiology. Endocr Rev. 2010;31:506–43. doi: 10.1210/er.2009-0037. [DOI] [PMC free article] [PubMed] [Google Scholar]
- 82.Farooqi IS, et al. Clinical spectrum of obesity and mutations in the melanocortin 4 receptor gene. N Engl J Med. 2003;348:1085–95. doi: 10.1056/NEJMoa022050. [DOI] [PubMed] [Google Scholar]
- 83.Stutzmann F, et al. Prevalence of melanocortin-4 receptor deficiency in Europeans and their age-dependent penetrance in multigenerational pedigrees. Diabetes. 2008;57:2511–8. doi: 10.2337/db08-0153. [DOI] [PMC free article] [PubMed] [Google Scholar]
- 84.Vaisse C, et al. Melanocortin-4 receptor mutations are a frequent and heterogeneous cause of morbid obesity. J Clin Invest. 2000;106:253–62. doi: 10.1172/JCI9238. [DOI] [PMC free article] [PubMed] [Google Scholar]
- 85.Schonke M, Myers MG, Jr, Zierath JR, Bjornholm M. Skeletal muscle AMP-activated protein kinase gamma1(H151R) overexpression enhances whole body energy homeostasis and insulin sensitivity. Am J Physiol Endocrinol Metab. 2015;309:E679–90. doi: 10.1152/ajpendo.00195.2015. [DOI] [PMC free article] [PubMed] [Google Scholar]
- 86.Pellinen T, et al. Small GTPase Rab21 regulates cell adhesion and controls endosomal traffic of beta1-integrins. J Cell Biol. 2006;173:767–80. doi: 10.1083/jcb.200509019. [DOI] [PMC free article] [PubMed] [Google Scholar]
- 87.Banerjee U, Cheng X. Exchange protein directly activated by cAMP encoded by the mammalian rapgef3 gene: Structure, function and therapeutics. Gene. 2015;570:157–67. doi: 10.1016/j.gene.2015.06.063. [DOI] [PMC free article] [PubMed] [Google Scholar]
- 88.Rippey C, et al. Formation of chimeric genes by copy-number variation as a mutational mechanism in schizophrenia. Am J Hum Genet. 2013;93:697–710. doi: 10.1016/j.ajhg.2013.09.004. [DOI] [PMC free article] [PubMed] [Google Scholar]
- 89.Schmitz C, Kinge P, Hutter H. Axon guidance genes identified in a large-scale RNAi screen using the RNAi-hypersensitive Caenorhabditis elegans strain nre-1(hd20) lin-15b(hd126) Proc Natl Acad Sci U S A. 2007;104:834–9. doi: 10.1073/pnas.0510527104. [DOI] [PMC free article] [PubMed] [Google Scholar]
- 90.Setoguchi R, et al. Repression of the transcription factor Th-POK by Runx complexes in cytotoxic T cell development. Science. 2008;319:822–5. doi: 10.1126/science.1151844. [DOI] [PubMed] [Google Scholar]
- 91.Widom RL, Culic I, Lee JY, Korn JH. Cloning and characterization of hcKrox, a transcriptional regulator of extracellular matrix gene expression. Gene. 1997;198:407–20. doi: 10.1016/s0378-1119(97)00360-0. [DOI] [PubMed] [Google Scholar]
- 92.Sun X, et al. Deletion of atbf1/zfhx3 in mouse prostate causes neoplastic lesions, likely by attenuation of membrane and secretory proteins and multiple signaling pathways. Neoplasia. 2014;16:377–89. doi: 10.1016/j.neo.2014.05.001. [DOI] [PMC free article] [PubMed] [Google Scholar]
- 93.Parsons MJ, et al. The Regulatory Factor ZFHX3 Modifies Circadian Function in SCN via an AT Motif-Driven Axis. Cell. 2015;162:607–21. doi: 10.1016/j.cell.2015.06.060. [DOI] [PMC free article] [PubMed] [Google Scholar]
- 94.Balzani E, et al. The Zfhx3-Mediated Axis Regulates Sleep and Interval Timing in Mice. Cell Rep. 2016;16:615–21. doi: 10.1016/j.celrep.2016.06.017. [DOI] [PMC free article] [PubMed] [Google Scholar]
- 95.Kao YH, et al. ZFHX3 knockdown increases arrhythmogenesis and dysregulates calcium homeostasis in HL-1 atrial myocytes. Int J Cardiol. 2016;210:85–92. doi: 10.1016/j.ijcard.2016.02.091. [DOI] [PubMed] [Google Scholar]
- 96.Auer PL, Reiner AP, Leal SM. The effect of phenotypic outliers and non-normality on rare-variant association testing. Eur J Hum Genet. 2016;24:1188–94. doi: 10.1038/ejhg.2015.270. [DOI] [PMC free article] [PubMed] [Google Scholar]
- 97.Goldstein JI, et al. zCall: a rare variant caller for array-based genotyping: genetics and population analysis. Bioinformatics. 2012;28:2543–5. doi: 10.1093/bioinformatics/bts479. [DOI] [PMC free article] [PubMed] [Google Scholar]
- 98.Grove ML, et al. Best practices and joint calling of the HumanExome BeadChip: the CHARGE Consortium. PLoS One. 2013;8:e68095. doi: 10.1371/journal.pone.0068095. [DOI] [PMC free article] [PubMed] [Google Scholar]
- 99.Zhan X, Hu Y, Li B, Abecasis GR, Liu DJ. RVTESTS: an efficient and comprehensive tool for rare variant association analysis using sequence data. Bioinformatics. 2016;32:1423–6. doi: 10.1093/bioinformatics/btw079. [DOI] [PMC free article] [PubMed] [Google Scholar]
- 100.Liu DJ, et al. Meta-analysis of gene-level tests for rare variant association. Nat Genet. 2014;46:200–4. doi: 10.1038/ng.2852. [DOI] [PMC free article] [PubMed] [Google Scholar]
- 101.Winkler TW, et al. Quality control and conduct of genome-wide association meta-analyses. Nat Protoc. 2014;9:1192–212. doi: 10.1038/nprot.2014.071. [DOI] [PMC free article] [PubMed] [Google Scholar]
- 102.Winkler TW, et al. EasyStrata: evaluation and visualization of stratified genome-wide association meta-analysis data. Bioinformatics. 2015;31:259–61. doi: 10.1093/bioinformatics/btu621. [DOI] [PMC free article] [PubMed] [Google Scholar]
- 103.Wu MC, et al. Rare-variant association testing for sequencing data with the sequence kernel association test. Am J Hum Genet. 2011;89:82–93. doi: 10.1016/j.ajhg.2011.05.029. [DOI] [PMC free article] [PubMed] [Google Scholar]
- 104.Price AL, et al. Pooled association tests for rare variants in exon-resequencing studies. Am J Hum Genet. 2010;86:832–8. doi: 10.1016/j.ajhg.2010.04.005. [DOI] [PMC free article] [PubMed] [Google Scholar]
- 105.Kiezun A, et al. Exome sequencing and the genetic basis of complex traits. Nat Genet. 2012;44:623–30. doi: 10.1038/ng.2303. [DOI] [PMC free article] [PubMed] [Google Scholar]
- 106.Feng S, Liu D, Zhan X, Wing MK, Abecasis GR. RAREMETAL: fast and powerful meta-analysis for rare variants. Bioinformatics. 2014;30:2828–9. doi: 10.1093/bioinformatics/btu367. [DOI] [PMC free article] [PubMed] [Google Scholar]
- 107.Yang J, et al. Genomic inflation factors under polygenic inheritance. Eur J Hum Genet. 2011;19:807–12. doi: 10.1038/ejhg.2011.39. [DOI] [PMC free article] [PubMed] [Google Scholar]
- 108.Willer CJ, Li Y, Abecasis GR. METAL: fast and efficient meta-analysis of genomewide association scans. Bioinformatics. 2010;26:2190–1. doi: 10.1093/bioinformatics/btq340. [DOI] [PMC free article] [PubMed] [Google Scholar]
- 109.Thorleifsson G, et al. Genome-wide association yields new sequence variants at seven loci that associate with measures of obesity. Nat Genet. 2009;41:18–24. doi: 10.1038/ng.274. [DOI] [PubMed] [Google Scholar]
- 110.Denny JC, et al. PheWAS: demonstrating the feasibility of a phenome-wide scan to discover gene-disease associations. Bioinformatics. 2010;26:1205–10. doi: 10.1093/bioinformatics/btq126. [DOI] [PMC free article] [PubMed] [Google Scholar]
- 111.Pers TH, et al. Biological interpretation of genome-wide association studies using predicted gene functions. Nat Commun. 2015;6:5890. doi: 10.1038/ncomms6890. [DOI] [PMC free article] [PubMed] [Google Scholar]
Associated Data
This section collects any data citations, data availability statements, or supplementary materials included in this article.
Supplementary Materials
Data Availability Statement
Summary statistics can be downloaded from http://portals.broadinstitute.org/collaboration/giant/index.php/GIANT_consortium