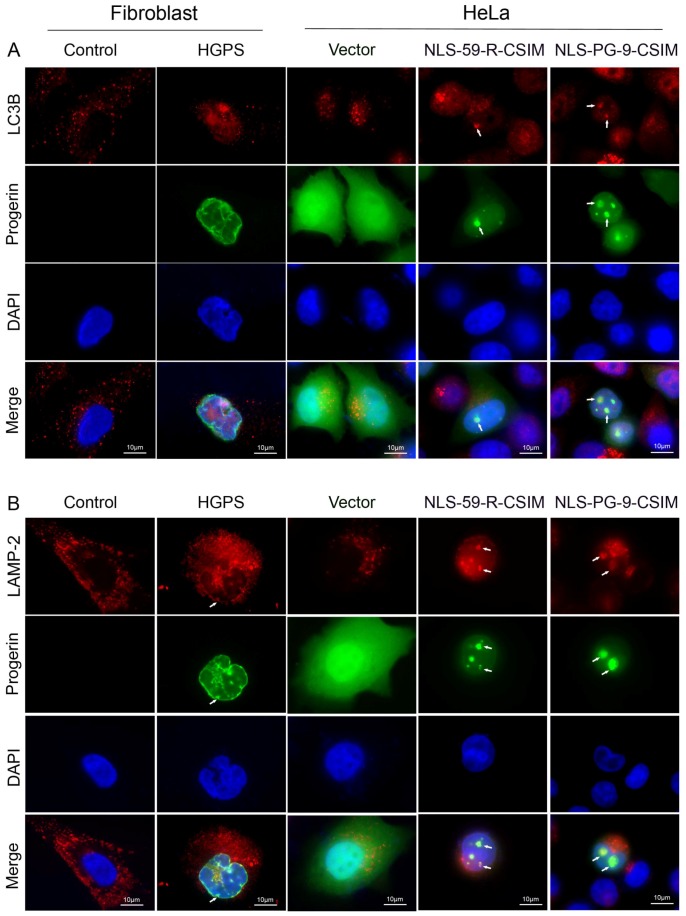
Figure 5.
Detection of autophagosome and lysosome distributions. (A) LC3B and (B) LAMP-2 were used as markers to detect autophagosomes and lysosomes, respectively. Chromatin was stained with DAPI. Representative images of LC3B and LAMP-2 staining in normal and Hutchinson–Gilford progeria syndrome (HGPS) fibroblasts and EGFP vector-, EGFP–NLS-59-R-CSIM-, and EGFP–NLS-PG-9-CSIM-transfected cells. Redistribution and colocalization patterns of LC3B and LAMP-2 in the NE and NE invaginations are shown in HGPS fibroblasts and EGFP–NLS-59-R-CSIM- and EGFP–NLS-PG-9-CSIM-transfected cells, as indicated with arrowheads. Scale bar, 10 µm.

