

Abstract
Introduction
A proliferation‐inducing ligand (APRIL) and B cell activation factor (BAFF) are known to play a significant role in the pathogenesis of several diseases, including BAFF in malaria. The aim of this study was to investigate whether APRIL and BAFF plasma concentrations could be part of inflammatory responses associated with P. vivax and P. falciparum malaria in patients from the Brazilian Amazon.
Methods
Blood samples were obtained from P. vivax and P. falciparum malaria patients (n = 52) resident in Porto Velho before and 15 days after the beginning of treatment and from uninfected individuals (n = 12). We investigated APRIL and BAFF circulating levels and their association with parasitaemia, WBC counts, and cytokine/chemokine plasma levels. The expression levels of transmembrane activator and calcium‐modulating cyclophilin ligand interactor (TACI) on PBMC from a subset of 5 P. vivax‐infected patients were analyzed by flow cytometry.
Results
APRIL plasma levels were transiently increased during acute P. vivax and P. falciparum infections whereas BAFF levels were only increased during acute P. falciparum malaria. Although P. vivax and P. falciparum malaria patients have similar cytokine profiles during infection, in P. vivax acute phase malaria, APRIL but not BAFF levels correlated positively with IL‐1, IL‐2, IL‐4, IL‐6, and IL‐13 levels. We did not find any association between P. vivax parasitaemia and APRIL levels, while an inverse correlation was found between P. falciparum parasitaemia and APRIL levels. The percentage of TACI positive CD4+ and CD8+ T cells were increased in the acute phase P. vivax malaria.
Conclusion
These findings suggest that the APRIL and BAFF inductions reflect different host strategies for controlling infection with each malaria species.
Keywords: APRIL/BAFF, malaria, TACI
Introduction
Malaria is one of the most important human parasitic diseases. Nearly half the world's population is at risk of contracting malaria, with an estimate global annual incidence of about 212 million clinical cases and almost 429,000 deaths 1. Among the five Plasmodium species that infect humans, P. falciparum and P. vivax are responsible for 95% of malaria cases around the world. Although P. falciparum accounts for the vast majority of morbidity and mortality, P. vivax has a wider geographic distribution and causes significant symptomatic disease 2. Currently, there is no available vaccine to prevent malaria. Although sterile immunity against malaria parasite is most likely never achieved, individuals living in malaria‐endemic areas can acquire a state of clinical immunity towards severe illness and death. The mechanisms underlying the development of semi‐immunity are not entirely understood. However, it is well established, that naturally acquired immunity against blood stage parasite involves both CD4+ T cells and antibodies 3. The importance of antibodies was recognized in the studies demonstrating that passive transfer of serum Immunoglobulin G (IgG) from clinically immune individuals into non‐immune recipients substantially reduced parasite burden and the following clinical symptoms 4, 5, 6. Furthermore, many studies showed that the quality, level, and breadth of the antibody response are critical components of malaria clinical immunity 7, 8, 9, 10, 11, 12. However, malaria clinical immunity develops slowly and is ineffectively maintained, suggesting a poor generation of protective immune memory. This happens are attributable to a number of different factors, which include the disturbance of immune homeostasis by Plasmodium spp. 13, 14. At B‐cells level, alterations such as polyclonal B‐cell activation, atypical memory B‐cell expansion, and deletion of specific B‐cell subsets are well described in the context of malaria 13, 15, 16, 17, 18, 19, 20. However, the mechanisms leading to this B‐cell dysregulation are not entirely understood. Studies indicate that the members of the tumor necrosis factors (TNF) superfamily such as B cell activation factor (BAFF; also known as BlyS) and a proliferation‐inducing ligand (APRIL) have an important role in the T‐cell independent antibody production, immunoglobulin isotype switching and in the selection, maturation and survival of B cells 21, 22. In addition, BAFF drives the expansion of Th1 and Th17 pathways which increase Th1‐associated inflammatory responses 23. Both cytokines are produced by a variety of cell types, particularly leukocytes, and share two surface receptors expressed on B cells; transmembrane activator and calcium modulator and cyclophilin ligand interactor (TACI) and B‐cell maturation antigen (BCMA) 24. TACI expression is restricted to B cells and a subset of activated T cells 21.
The mechanisms regulating BAFF and APRIL‐system molecule expression are poorly known. However, it is recognized that cytokines such as interferon (IFN)‐γ, IFN‐α, TNF, and Interleukin (IL)‐10 as well as granulocyte colony‐stimulating factor (G‐CSF), CD40 ligand (CD40‐L), lipopolysaccharides, and peptidoglycans can upregulate BAFF or APRIL expression in different cells 23, 25, 26, 27, 28, 29, 30.
In the recent years, several studies have been shown that BAFF, APRIL, and their receptors play a significant role in the pathogenesis of various noninfectious and infectious diseases 23, 26, 31, 32, 33, 34, 35, including BAFF in malaria 18, 35, 36. In P. falciparum malaria, BAFF levels are increased in plasma samples from infected children in Kenya 36 and in placental tissue from infected pregnant women in Tanzania 37, which correlate with disease pathogenesis and severity. Moreover, in vitro, both the soluble fraction of P. falciparum antigens and hemozoin enhanced BAFF surface expression as well as secretion by human monocytes and increased B cell proliferation and IgG secretion 38. While there is some evidence indicating a pathogenic role of BAFF in P. falciparum malaria, as before mentioned, the role of APRIL in malaria is still unknown.
Brazil has a peculiar malaria epidemiological situation, in which P. vivax accounts for more than 85% of all malaria cases 39. Furthermore, the dynamics of malaria infection and severity differ greatly from malaria endemic regions of Africa and Asia 1. Therefore, the present study investigated whether BAFF and APRIL plasma concentrations could be part of inflammatory response associated with uncomplicated P. falciparum and P. vivax malaria in some adults from the Brazilian Amazon who were followed up during the acute and convalescent phases of infection.
Materials and Methods
Study area and subjects
The study was conducted in 52 patients with non‐complicated P. vivax (n = 33) or P. falciparum (n = 19) malaria who resided in the communities of Porto Velho, the capital of the Rondônia state (8°45′43″ S, 63°54′14″ W), in the Brazilian Amazon malaria endemic region (Fig. 1). Transmission of malaria in Rondônia is present throughout the year with seasonal fluctuations and maximum transmission occurring during the dry season between April and September 40, a period in which our sample and survey data were collected.
Figure 1.
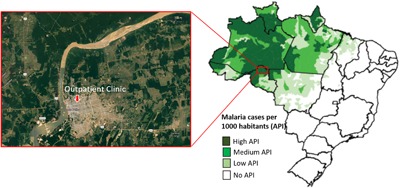
Map showing the malaria endemic area—Porto Velho municipality, Rondônia State, Brazil.
This population is composed of natives and Brazilian migrants inhabiting this area for variable times since the 1970s (average length of residence in malaria endemic area media = 27.5 ± 12 years, median = 26.5, IQR = 20.0–34.5). All malaria patients who were enrolled in this study complied with the following criteria: 1) they presented symptoms; 2) they had thin‐thick blood smears positive for malaria parasites; 3) they were not indigenous; 4) they were not prisoners; 5) they were all over 12 years old; and 6) no females were pregnant or breast‐feeding.
The patients sought health care at the government outpatient clinic in Porto Velho after the onset of malaria symptoms. Blood samples were collected on the day of diagnosis before treatment (in the acute phase = D0) and 15 days later (in the convalescence phase = D15). After giving written informed consent which was reviewed and approved by the Ethical Committee of the Oswaldo Cruz Foundation (354/06), questionnaires were administered inquiring about demographic data, time of residence in the endemic area, personal and family malaria histories, presence of malaria symptoms, and use of malaria prophylaxis for each survey participant. After blood collection, donors positive for P. vivax and/or P. falciparum were subsequently treated according to Brazilian Ministry of Health standards for malaria therapy: for uncomplicated malaria is recommended chloroquine combined to primaquine to P. vivax infection and artemether‐lumefantrine (Coartem®) to P. falciparum infection. Asexual blood forms of P. vivax and P. falciparum were cleared from the peripheral blood of all patients included in the study following therapy and no parasite reappearance was observed during follow‐up. The control group (n = 12) was composed of apparently healthy individuals who lived in the same geographic area, but were negative for malaria parasites as assessed by thick blood films and had not reported any malaria episodes for at least 5 years.
Sample collection, malaria diagnosis, and peripheral blood mononuclear cells isolation
Venipuncture drew venous blood samples (5 mL) in EDTA‐containing tubes. Thin and thick blood smears of all donors were examined for malaria parasites. Parasitological evaluations were done by examination of 200 fields at 1,000‐fold magnification under oil‐immersion. The number of parasites was counted against 200 white blood cells (WBC). The parasite density per microliter of blood was calculated by multiplying the number of parasites counted by number of WBC divided by 200 41. If less than 9 parasites were detected, 300 additional leukocytes were counted to obtain more precise results. To increase the sensitivity of parasites detection, molecular analyses using specific primers for genus (Plasmodium sp.) and species (P. falciparum and P. vivax) were performed in all samples as previously described 42. Subjects were considered to have malaria if they were positive in thick blood smear and/or in Polymerase Chain Reaction (PCR).
WBC count was performed in the acute and during the convalescence phase using an automatic hematology analyzer (Pentra ABX). The cell counters provided data on leukocyte, lymphocyte, eosinophil, neutrophil, band cell, monocyte, and basophil counts. Qualified pathologists examined the smears. Of the subjects who agreed, venous peripheral blood (10 mL) was collected in heparin‐containnig tubes for flow cytometry analysis (five patients and four controls). Peripheral blood mononuclear cells (PBMC) were separated from whole blood by density gradient centrifugation (Ficoll‐Hypaque; density 1.077 g/mL; Sigma Company, USA). Cell viability was determined using the trypan blue dye exclusion assay. Cells were resuspended to a concentration of 2 × 10⁷cells/mL in the freezing medium consisting of 90% heat‐inactivated fetal bovine serum (FBS; Hyclone, USA) and 10% dimethyl sulfoxide (DMSO; Sigma, USA) and placed into Nalgene cryogenic freezing container (Nalgene Labware). The freezing container was then stored at −70°C overnight, and frozen cell samples were transferred to liquid nitrogen container (−196°C).
Multiplex microsphere cytokine and chemokine immunoassay
Cytokine and chemokine concentrations in plasma samples were determined by Luminex technology (Luminex Corporation, Austin, TX, USA). Fourteen cytokines IL‐1β, IL‐2, IL‐4, IL‐5, IL‐6, IL‐7, IL‐10, IL‐12 p70, IL‐13, IL‐17, IFN‐γ, TNF‐α, G‐CSF, granulocyte‐macrophage colony‐stimulating factor (GM‐CSF), and three chemokines (IL‐8, MCP‐1, and MIP‐1β) were analyzed using a BioPlex‐Kit assay (Bio‐Rad Laboratories, Hercules, CA, USA). The assay was performed according to the manufacturer's instructions using a BioPlex‐kit in combination with the Luminex system. Briefly, 50 μL of standard or test sample along with 50 μL of mixed beads were added into the wells of a pre‐wetted 96‐well microtitre plate. After 1 h of incubation and washing, 25 μL of detection antibody mixture was added and the samples were incubated for 30 min and then washed. Finally, 50 μL of streptavidin‐PE was added and after 10 min of incubation and washing, the beads were resuspended in 125 μL assay buffer and analyzed using a BioPlex suspension array system (Bio‐Rad Laboratories) and the Bio‐Plex manager software (v.3.0). A minimum of 100 beads per region were analyzed. A curve fit was applied to each standard curve according to the manufacturer's manual and sample concentrations were interpolated from the standard curves. The limit of cytokine detection using this method was 2 pg/mL for all cytokines and chemokines. The median cytokine and chemokine levels in 12 healthy controls were 2 pg/mL for IL‐2, IL‐4, IL‐5, IL‐6, IL‐7, IL‐10, IL‐12 p70, IL‐13, IL‐17, and GM‐CSF, 5.85 pg/mL for IL‐1β, 17.64 pg/mL for IFN‐γ, 23.23 pg/mL for TNF‐α, 4.40 pg/mL for G‐CSF, 379.13 pg/mL for MCP‐1, and 994.8 pg/mL for MIP‐1β.
APRIL and BAFF ELISA
The plasma concentrations of APRIL and BAFF were measured with Human APRIL platinum ELISA Kit (Bender MedSystems GmbH, Vienna, Austria) and Human BAFF Instant ELISA kit (Bender MedSystems GmbH, Vienna, Austria) according to the manufacturer's instructions. Assays were performed in duplicate on 1/2 diluted samples. Plasma APRIL and BAFF levels were quantified using the in‐Kit standard curves for the respective cytokines. The minimal detectable doses of APRIL and BAFF in ELISA assay were 1.43 and 3.03 ng/mL, respectively. The median APRIL levels in 12 healthy controls were 5.02 ng/mL and the median BAFF were 6.72 ng/mL.
Flow cytometry
Cryopreserved PBMC were thawed at 37°C, and Benzonase‐supplemented complete medium was slowly added (90% RPMI Medium 1640—GIBCO/USA, 10% Fetal bovine serum—HyClone/USA and Benzonase Nuclease—Sigma–Aldrich, USA, to a final concentration of 50 U/mL) 43. The cells were washed and resuspended in medium without Benzonase twice. Viability and recovery were measured using trypan blue exclusion dye. For immunophenotypic analysis, 500,000 to 1,000,000 viable cells were transferred into a 96‐well U‐bottom plate, washed once with 200 μL PBS, and incubated with 100 μL of PBS/milk buffer containing 10% of human AB serum for 15 min. Cells were then washed with PBS/BSA buffer (PBS containing 0,1% BSA), and stained with 50μL of an antibody mixture comprising CD19‐APCCy5 (e‐Bioscience, clone SJ25‐CI), CD5‐FITC (eBioscience, clone L17F12), TACI/TNFRSF13B‐PE (R&D Systems, clone 165604), CD3‐APCCy7 (BioLegend, clone HIT3a), CD4‐PECy7 (e‐Bioscience, clone OKT4), and CD8‐PE Texas Red (Invitrogen, clone 3B5)) in PBS/BSA buffer for 45 min at 4°C. Cells were washed twice in PBS/BSA buffer and fixed with 10% paraformaldehyde. After another wash step, the cells were resuspended in 500 μL of PBS/BSA buffer. All samples were live gated by side and forward scatter on lymphocytes, and 10,000 to 20,000 events were acquired inside the lymphocytes gate in a Cyan ADP flow cytometer (Dako, USA). Flow cytometry data were analyzed later using FlowJo v.10.0.8 software (USA).
Statistical analysis
The survey data were recorded and entered into a database created with EPI Info 2007 (Centers for Disease Control and Prevention, Atlanta, GA, USA). Statistical analysis was carried out with GraphPad Prism 5.0 (GraphPad Software Inc., Chicago, IL, USA) and R software. We previously checked whether the data was normally distributed by performing the D'Agostino's and Pearson omunibus normality test. As the data was not normally distributed we used Wilcoxon matched‐paired test to calculate significance levels between patients (D0 and D15) and Mann–Whitney unpaired T test to calculate significance levels between patients and control group. Spearman‐rank correlation analysis was used to calculate correlations. Reported P values are two‐tailed, and statistical differences were considered significant when P values were less or equal to 0.05.
Results
General features of the study population
General features of the volunteers are displayed in Table 1. The median of age, period living in endemic area and number of previous malaria were similar between the P. vivax and P. falciparum malaria patient groups. Although the median of parasitemia appeared to be higher in P. vivax than in P. falciparum infected patients, this difference was not statistically significant. All patients were symptomatic at the time of enrollment independent of Plasmodium species and the most common symptoms reported by them were fever (91%), headache (89%), myalgia (77%), chills (77%), and vomiting (64%). However, no correlation was found between parasitaemia and axillary temperature (P < 0.05). There was no significant difference among the general features of the patient groups and control group, except for the absence of circulating parasites and the lowest number of previous malaria in the control group. All patients were parasitemia negative by day 15 of follow‐up after receiving effective drug treatment.
Table 1.
General features of the study population
| Parameter | Control (n = 12) | P. vivax (n = 33) | P. falciparum (n = 19) |
|---|---|---|---|
| Gender (%) | |||
| Male | 42 | 73 | 74 |
| Female | 58 | 27 | 26 |
| Age (years) | 29 (24.5–40) | 28 (22–36.5) | 28 (23–42) |
| Parasitaemia (number ofparasites/μL) | – | 3,200 (1,047–7,758) | 1,400 (890–3,338) |
| Years of residence in malaria endemic area | 29 (18.25–32) | 25 (22–34) | 25 (19–38) |
| Previous malaria episodes | 0 (0–2.25) | 4 (1–10)** | 3 (1–10)* |
Data in the table present median (25th and 75th percentile) for each parasitological or epidemiological parameter. The Mann–Whitney test was used to compare groups. (*) P = 0.01 and (**) P = 0.009 between indicated infected group and control.
Increased levels of APRIL and BAFF in the acute phase of malaria
We analyzed APRIL and BAFF plasma levels from 12 healthy controls and 52 patients infected with P. vivax (n = 33) or P. falciparum (n = 19). To investigate changes in APRIL and BAFF levels during the infection, we compared levels in the plasma from the same patient during the acute (D0) and convalescent (D15) phases.
As shown in Figure 2A, APRIL plasma levels were significantly higher in P. vivax (median = 9.93 ng/mL, IQR = 5.73–14.47, P = 0.002) and P. falciparum (median = 9.15 ng/mL, IQR = 6.52–14.04, P < 0.0001 patients during acute phase (D0) than those of the controls (median = 5.02 ng/mL, IQR = 3.48–6.93). To investigate changes in APRIL levels during the infection, we compared APRIL levels in the plasma from the same patient during the acute (D0) and convalescent (D15) phases. During the convalescent phase P. vivax (median = 5.85 ng/mL, IQR = 4.26–9.29, P = 0.012) and P. falciparum (median = 6.93 ng/mL, IQR = 4.39–10.03, P = 0.045) patients had significantly lower levels of APRIL than during the acute phase. The levels of APRIL were similar between P. vivax and P. falciparum patients during both acute and convalescent phases (P > 0.05, for all).
Figure 2.
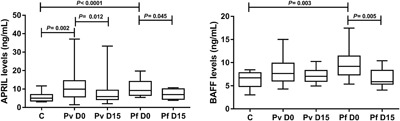
Plasma levels of a proliferating‐inducing ligand (APRIL) and B‐cell activating factor (BAFF) in the control and malaria groups. A: APRIL levels in control (n = 12), P. vivax (n = 33), and P. falciparum (n = 19) patients on the day of diagnosis and 15 days later; B: BAFF levels in control, P. vivax and P. falciparum patients on the day of diagnosis and 15 days later. Each box represents 25th and 75th percentiles. Lines inside the boxes represent median values. Lines outside the boxes represent the minimum and maximum values. C, control; Pv, P. vivax; Pf, P. falciparum; D0, the day of diagnosis; D15, 15 days after diagnosis. Mann– Whitney test and Wilcoxon matched‐paired test were used to calculate significance levels between two groups.
As shown in Figure 2B, BAFF plasma levels were detected at high concentrations in P. falciparum patients (median = 9.20 ng/mL, IQR = 7.36–11.43, P = 0.003) during the acute phase and returned to the levels similar to those of the controls (median = 6.72 ng/mL, IQR = 4.86–7.80). During the convalescent phase, P. falciparum (median = 5.89, IQR = 5.36–8.32, P = 0.005) patients had significantly lower levels of BAFF than during the acute phase. In P. vivax patients, although the median BAFF levels were increased during the acute (median = 7.63 ng/mL, IQR = 6.04–9.87) and convalescent (median = 7.06 ng/mL, IQR = 5.95–8.30) phases, these levels were not statistically different from those of the controls (P > 0.05, for both). The levels of BAFF were similar between P. vivax and P. falciparum patients during both acute and convalescent phases (P > 0.05, for all). Furthermore, no correlation was found between APRIL and BAFF plasma levels during both acute and convalescent phases of P. vivax (r = 0.245, P = 0.296; r = −0.103, P = 0.665, D0 and D15, respectively) and P. falciparum (r = −0.099, P = 0.739; r = 0.013, P = 0.964, D0 and D15, respectively) malaria. The correlation between APRIL plasma levels and parasitaemia was only observed in P. falciparum malaria (r = −0.500, P = 0.031). There was no correlation between BAFF plasma levels and parasitaemia in P. falciparum (r = −0.169, P = 0.562) or P. vivax malaria (r = 0.104, P = 0.663).
No correlation between APRIL/BAFF plasma levels and WBC counts during the acute or convalescent malaria phases
White blood cell counts showed significant changes in P. vivax and P. falciparum‐infected patients (Table 2). As expected, a significant decrease in total white blood cells, lymphocytes, and eosinophils were evident in P. vivax and P. falciparum malaria acute phase in comparison to control group but returned to normal levels in the convalescent phase. Band cell counts, on the other hand, were enhanced in P. vivax and P. falciparum malaria patients during the acute phase and also returned to normal levels in the convalescence. We assessed the relationship between APRIL/BAFF levels and WBC counts in healthy controls and malaria patients. However, no correlation was found between any of the WBC counts evaluated and the APRIL or BAFF plasma levels during the acute or convalescent malaria phases, as well as in the healthy control group.
Table 2.
Leukogram profile of control and malaria patient groups in the acute (D0) and convalescent (D15) phases of infection
| Control (n = 12) | P. vivax (n = 33) | P. falciparum (n = 19) | |||
|---|---|---|---|---|---|
| Leukogram (cell/μL) | D0 | D0 | D15 | D0 | D15 |
| Leukocytes | 6,400 (5,650–7,550) | 5,100 (3,850–6,600)b | 5,400 (4,950–6,625) | 4,700 (3,900–6,400)ae | 6,200 (4,675–7,500) |
| Neutrophils | 3,842 (3,090–4,572) | 3,468 (2,155–4,459) | 2,955 (2,349–3,432) | 3,420 (1,980–4,221) | 3,018 (2,174–3,744) |
| Band cells | 0 (0–0) | 62 (0–399)bef | 0 (0–0) | 152 (47–474)ce | 0 (0–0) |
| Lymphocytes | 2,160 (1,770–2,515) | 1,160 (795–1,463)ce | 2,014 (1,582–2,246) | 1,152 (714–1548)ce | 1,989 (1,581–2,936) |
| Monocytes | 328 (233–525) | 371 (182–512) | 322 (222–468.8) | 363 (325–553) | 308 (225.8–394.5) |
| Eosinophils | 152 (67.5–249) | 62 (36.5–136)ae | 298.5 (122.5–393) | 80 (33–405)e | 246.5 (132.5–766.5) |
| Basophils | 0 (0–0) | 0 (0–0) | 0 (0–0) | 0 (0–0) | 0 (0–0) |
Data in the table present median (25th and 75th percentile) for each WBC evaluated in control and malaria‐infected groups. a) P < 0.05, b) P < 0.01 and c) P < 0.001 between indicated infected group and control, respectively—Mann–Whitney test; d) P < 0.05 and e) P < 0.001 between the acute and the convalescent phases—Wilcoxon matched‐paired test; f) P < 0.05 between P. vivax and P. falciparum infected groups—Mann–Whitney test. D0: day of diagnosis. D15: 15 days after diagnosis.
Correlation between APRIL and inflammatory cytokines plasma levels during the acute phase of P. vivax malaria
Table 3 shows the plasma cytokine and chemokine levels in acute and convalescent phase studied subjects. Patients infected with P. vivax or P. falciparum presented an increase in IFN‐γ, TNF‐α, IL‐6, IL‐8, IL‐10, IL‐13, MIP1β, and G‐CSF levels during the malaria acute phase. P. falciparum infected individuals also presented enhanced concentration of IL‐2 in plasma during the acute stage. To evaluate changes in cytokine concentrations during the infections, we compared patients from the same infected group during the acute (D0) and convalescent (D15) phases. P. vivax and P. falciparum patients presented higher levels of IFN‐γ, TNF‐α, IL‐6, IL‐8, IL‐17, and MIP1β in the convalescent phase than in the acute phase. Although P. vivax and P. falciparum malaria patients have similar cytokine profiles during infection, P. falciparum patients presented higher levels of IFN‐γ and TNF‐α, in acute phase and of IFN‐γ, IL‐6, IL‐8, IL‐17, and G‐CSF in convalescent phase than P. vivax patients. Moreover, the levels of IL‐2, IL‐4, and IL‐12 were increased in the convalescent phase of P. falciparum infection. On the contrary, IL‐10 levels decreased in the P. vivax and P. falciparum malaria convalescent phase and returned to healthy normal levels. The cytokines IL‐5, IL‐7, and GM‐CSF were not detectable in most plasma samples. No differences were observed in MCP‐ 1 levels compared with controls. The lL‐10 and G‐CSF levels were positively correlated with parasitaemia in the P. vivax (r = 0.563, P = 0.0006; r = 0.430, P = 0.01, respectively) and P. falciparum (r = 0.428, P = 0.037; r = 0.657, P = 0.002) malaria acute phase. The same was true for IFN‐γ (r = 0.518, P = 0.02), IL‐2 (r = 0.611, P = 0.005) and IL‐4 (r = 0.655, P = 0.002) in P. falciparum malaria patients.
Table 3.
Cytokine and chemokine profiles of control and malaria patient groups in the acute (D0) and convalescent (D15) phases of infection
| P. vivax (n = 33) | P. falciparum (n = 19) | ||||
|---|---|---|---|---|---|
| Plasma levels pg/mL | Control (n = 12) | D0 | D15 | D0 | D15 |
| IFN‐γ | 17.64 (17.26–18.87) | 58.96 (39.12–243.3)c | 113.4 (63.27–393.2)cd | 142.8 (2–336.2)cg | 440.7 (137.9–527.3)cdg |
| TNF‐α | 23.23 (17.11–36.41) | 60.14 (39.68–148.8)a | 328.4 (178.6–607)cf | 192.7 (51.8–335.1)bg | 404.6 (204.6–749.1)cd |
| IL‐1 | 5.85 (5.59–6.57) | 10.45 (3.84–15.49) | 14.76 (12.16–24.54) | 13.63 (11.09–18.63) | 21.00 (16.31–25.31) |
| IL‐2 | 2 (2–2) | 2 (2–250.4) | 9.05 (2–370.3) | 154.6 (2–337.5)a | 438.7 (83.81–538.3)bd |
| IL‐4 | 2 (2–2) | 2 (2–2) | 2 (2–225.3) | 2 (2–123) | 222.2 (2–364.5)ad |
| IL‐6 | 2 (2–2) | 152.1 (2–827.7)b | 460.7 (117.7–2,197)cd | 335.9 (238.3–1,552)b | 2,974 (1,331–3,563)ceg |
| IL‐8 | 47.01 (6.33–259.5) | 959.2 (249.3–3,367)a | 5,440 (3,528–14,881)cf | 2,457 (819.8–8,042)bg | 16,506 (12,263–22,161)cfh |
| IL‐10 | 2 (2–2) | 1753.51 (461.8–3,763)cf | 2 (2–2)g | 1,627 (795.3–3,613)cf | 2 (2–183.7) |
| IL‐12 | 2 (2–2) | 2 (2–2) | 2 (2–152.7) | 2 (2–112.7) | 219.8 (2–234.1)bdg |
| IL‐13 | 2 (2–2) | 66.79 (2–301)a | 34.21 (2–286) | 301 (270.3–342.8)bg | 301 (203.2–329.3)ag |
| IL‐17 | 2 (2–2) | 2 (2–89.3) | 123.2 (2–239.7)be | 2 (2–154.3) | 279.3 (163.8–362.1)cfg |
| G‐CSF | 4.4 (4.23–4.56) | 11.07 (7.16–48.41)b | 16.89 (12.16–57.41)b | 11.11 (2–67.99)e | 96.45 (33.94–113.1)cg |
| MCP1 | 379.1 (294.8–574.4) | 815.7 (97.24–3,241) | 234.8 (76.14–848.8) | 788.5 (559–1,945) | 720.6 (360.2–957.4) |
| MIP1β | 994.8 (416.4–2008) | 5,641 (3,272–9,833)b | 11,685 (8,370–26,566)cf | 7,506 (5,027–11,697)c | 14,601 (12,435–21,855)cf |
Data in the table present median (25th and 75th percentile) for cytokines and chemokines in control and malaria‐infected groups. a) P < 0.05, b) P < 0.01 and c) P < 0.001 between indicated infected group and control, respectively—Mann–Whitney test; d) P < 0.05, e) P < 0.01 and f) P < 0.001 between the acute and the convalescent phase—Wilcoxon matched‐paired test; g) P< 0.05 and h) P < 0.01 between P. vivax and P. falciparum infected groups—Mann–Whitney test. D0: day of diagnosis. D15: 15 days after diagnosis.
As shown in Table 4, in P. vivax acute phase, APRIL plasma levels were positively correlated with IL‐ 1 (r = 0.409, P = 0.018), IL‐2 (r = 0.386, P = 0.026), IL‐4 (r = 0.396, P = 0.022), IL‐6 (r = 0.365, P = 0.037), and IL‐13 (r = 0.352, P = 0.045) while BAFF plasma levels were not statistically correlated with any of the cytokines/chemokines assayed. No correlation was observed between APRIL, BAFF, and cytokine plasma levels during the P. vivax convalescent phase. No relationship was found between any of the cytokines/chemokines assayed and the APRIL or BAFF plasma levels in P. falciparum acute or convalescent phases and control group (P > 0.05, for all).
Table 4.
Correlations between the plasma levels of APRIL, BAFF, cytokines/chemokines, and parasitaemia in malaria patients in the acute (D0) and convalescent (D15) phases of infection
| Control (n = 12) | P. vivax (n = 33) | P. falciparum (n = 19) | |||
|---|---|---|---|---|---|
| D0 | D15 | D0 | D15 | ||
| Variables | r | r | r | r | R |
| APRIL versus Parasitaemia | na | −0.144 | na | −0.500* | na |
| BAFF versus Parasitaemia | na | 0.104 | na | −0.169 | na |
| APRIL versus IFN‐γ | 0.214 | 0.274 | 0.184 | 0.174 | 0.198 |
| APRIL versus TNF‐α | −0.085 | 0.217 | 0.158 | −0.135 | 0.105 |
| APRIL versus IL‐1 | 0.238 | 0.409* | 0.190 | 0.012 | 0.023 |
| APRIL versus IL‐2 | 0.167 | 0.384* | 0.161 | −0.105 | 0.190 |
| APRIL versus IL‐4 | 0.276 | 0.397* | 0.215 | −0.374 | 0.106 |
| APRIL versus IL‐6 | 0.126 | 0.367* | 0.123 | 0.135 | −0.139 |
| APRIL versus IL‐8 | −0.085 | 0.189 | 0.194 | 0.239 | 0.225 |
| APRIL versus IL‐10 | 0.268 | 0.178 | −0.133 | −0.202 | −0.221 |
| APRIL versus IL‐12 | 0.167 | 0.162 | 0.178 | −0.083 | 0.198 |
| APRIL versus IL‐13 | 0.262 | 0.359* | 0.105 | −0.197 | 0.177 |
| APRIL versus IL‐17 | 0.282 | 0.272 | 0.191 | −0.116 | 0.159 |
| APRIL versus G‐CSF | 0.162 | 0.140 | 0.036 | −0.003 | 0.377 |
| APRIL versus MCP1 | 0.257 | 0.293 | 0.149 | −0.180 | −0.055 |
| APRIL versus MIP1β | −0.200 | 0.326 | 0.019 | 0.106 | −0.053 |
| BAFF versus IFN‐γ | −0.123 | −0.130 | −0.042 | 0.164 | 0.321 |
| BAFF versus TNF‐α | 0.163 | −0.135 | 0.236 | 0.125 | 0.085 |
| BAFF versus IL‐1 | −0.285 | 0.036 | −0.139 | −0.085 | 0.085 |
| BAFF versus IL‐2 | −0.236 | −0.242 | −0.033 | 0.204 | 0.380 |
| BAFF versus IL‐4 | −0.134 | −0.112 | −0.041 | −0.030 | 0.267 |
| BAFF versus IL‐6 | −0.231 | 0.053 | −0.285 | 0.121 | 0.121 |
| BAFF versus IL‐8 | 0.245 | −0.052 | 0.011 | 0.175 | 0.082 |
| BAFF versus IL‐10 | −0.167 | 0.198 | −0.151 | −0.285 | 0.249 |
| BAFF versus IL‐12 | −0.218 | −0.040 | −0.060 | 0.133 | 0.344 |
| BAFF versus IL‐13 | −0.294 | 0.120 | 0.080 | −0.167 | 0.383 |
| BAFF versus IL‐17 | −0.154 | −0.281 | −0.242 | 0.367 | 0.179 |
| BAFF versus G‐CSF | −0.213 | −0.020 | −0.114 | 0.257 | 0.314 |
| BAFF versus MCP1 | 0.156 | −0.012 | 0.176 | −0.070 | 0.364 |
| BAFF versus MIP1β | 0.262 | −0.145 | −0.339 | 0.298 | −0.309 |
r, Spearman's rank correlation; na, non‐applicable; bold type and *P < 0.05.
Increased expression of TACI on T cells during the acute phase of P. vivax malaria
Transmembrane Activator and CAML Interactor (TACI) is a receptor of the APRIL/BAFF system and is expressed on B cells and activated T cells. To determine whether malaria induces increased expression of TACI, phenotypic analysis of PBMC of five P. vivax malaria patients during the acute (D0) and convalescent (D15) phases and four healthy controls was performed (Figs. 3A and 3B). Flow cytometry analysis revealed that the CD4 + TACI+ and CD8 + TACI+ T cells were significantly enhanced in the PBMC of P. vivax malaria patients only during the acute phase (D0) compared to the controls (P = 0.031 and P = 0.015, respectively) (Figs. 3C and 3D). The percentage of the CD19 + CD5 + TACI+ B cell appeared to be enhanced in malaria patients. However, in relation to healthy controls, the differences were not significant in any of the malaria phases (P > 0.05) (Fig. 3E). No significant differences were observed in the percentage of CD19 + CD5 + TACI+ B cells, CD4 + TACI+ and CD8 + TACI+ T cells in the same samples during acute versus convalescent phases of malaria (P > 0.05, for all).
Figure 3.
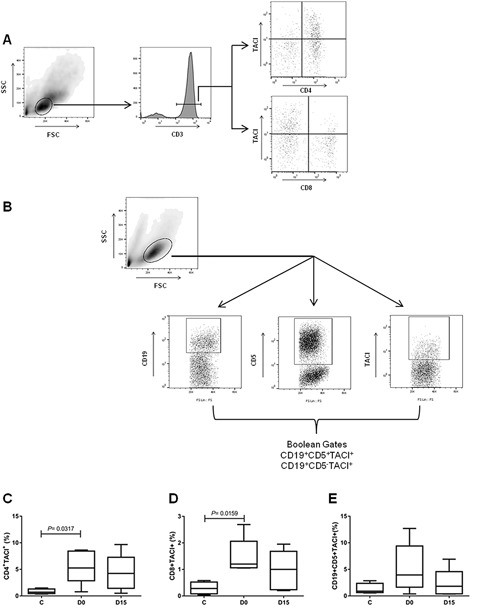
Expression of TACI receptor on T and B cells in malaria patients during acute (D0) and convalescent (D15) phases and in healthy individuals. A: Dot‐plot representing gating strategy of CD4+ and CD8+ T cells. A minimum of 30,000 events per sample were acquired inside the lymphocytes gate, based on size and granularity properties (FSC × SSC); followed by selection for CD3+ T cells inside the lymphocytes gate. CD4+ and CD8+ T cells were identified by CD3 and CD4 expression or CD3 and CD8 expression. B: Representative dot‐plot of CD19 + CD5 + TACI+ cell. A minimum of 30,000 events per sample were acquired inside the lymphocytes gate, based on size and granularity properties (FSC × SSC); followed by selection of cells expressing CD19, CD5, and TACI inside the lymphocytes gate. We used Boolean Combination Gates toll available in FlowJo software, to perform combinations of the three total surface markers (CD19+, CD5+, and TACI +) to uniquely discriminate CD19 + CD5 + TACI+ cells. C: Percentage of CD3 + CD4 + TACI+ cells, D‐CD3 + CD8 + TACI+ cells and E‐CD19 + CD5 + TACI+ cells, observed in the peripheral blood of malarial patients and healthy controls. Wilcoxon matched‐paired test was used to calculate significance levels between the patients (n = 5, D0 and D15) and Mann–Whitney unpaired T‐test was used to calculate significance levels between patients and control group (n = 4).
Discussion
Malaria is characterized by many pathophysiological changes including alterations in the immune system involving myeloid‐cells, T‐cells and B‐cells. Regarding B‐cells, a number of observations clearly demonstrate that B‐cell homeostasis is affected by Plasmodium infection 17, 18, 44, 45. This can be attributed to the complex biology of the parasites 46, 47, their antigenic diversity 46, 47, 48, and their immune‐modulatory molecules 49, 50. The BAFF/APRIL system plays a variety of roles in immunomodulation, mainly by affecting B cell activation, proliferation, and survival. BAFF and APRIL are produced by a range of mononuclear cells such as monocytes, macrophages, neutrophils, dendritic cells, and T‐cells stimulated by cytokines/chemokines often produced during inflammation or infections. Therefore, it is possible that marked changes in cytokine/chemokine levels during malaria 51, 52, 53, as well as Plasmodium immune‐modulatory molecules 38 drive BAFF/APRIL production by these cells. In the recent years, many research articles have reported a role for BAFF/APRIL system in the pathogenesis of autoimmune and infectious diseases 23, 26, 31, 32, 33, 34, 35, including malaria 35, 36, 54. However, while there is some evidence that BAFF plays a role in determining the outcome of P. falciparum malaria, nothing is known about the role of the follows: 1) APRIL in any malaria or 2) BAFF/APRIL system in P. vivax malaria. In this regard, the main objective of this study was to investigate whether BAFF and APRIL plasma concentrations could be part of inflammatory response associated with uncomplicated P. falciparum and P. vivax malaria in some adults from the Brazilian Amazon that were followed up during the acute and convalescent phases of infection.
First, we observed that the APRIL plasma levels were increased during acute P. vivax and P. falciparum infections whereas BAFF levels were only increased during acute P. falciparum malaria. These findings raise a possibility that the regulation of BAFF secretion may differ between the two strain infections. Although a range of myeloid cells produces BAFF and APRIL, the mechanisms regulating production and expression are poorly understood and likely differ from cell type to cell type. Plasmodium spp. infections elicit significant changes including immunological alterations involving myeloid cells and cytokine levels. In line with previous studies 51, 52, 53 we observed marked changes in the cytokine levels during P. vivax and P. falciparum malaria (Table 3). In both infections, we observed an increase in IFN‐γ, TNF‐α, IL‐6, IL‐8, IL‐10, IL‐13, MIP1β, and G‐CSF levels. However, although P. vivax and P. falciparum malaria patients have similar cytokine profiles during infection, P. falciparum patients presented higher levels of IFN‐γ, TNF‐α, and IL‐2 in acute phase than P. vivax. It is known that cytokines such as IFN‐γ, TNF, and IL‐10 as well as G‐CSF, CD40‐L, lipopolysaccharides and peptidoglycans can upregulate BAFF and APRIL expression in different cells types 25, 26, 29, 55, 56, 57. Then, one could speculate that the highest levels of IFN‐γ, TNF‐α, and IL‐2 observed in P. falciparum‐infected patients might result directly or indirectly in the upregulation of BAFF production. The increased BAFF plasma levels that we observed during acute P. falciparum infection is in accordance with previous findings that showed the elevation of BAFF in plasma from acutely malaria‐infected children and during controlled human malaria challenge (CHMI) in malaria‐naive adults 36, 54 as well as in placental tissue from malaria‐infected pregnant women [37) and on various antigen‐presenting cell subsets 54. Moreover, in vitro, both hemozoin and soluble P. falciparum antigens (sPfAg) are capable of inducing BAFF release from monocytes and B‐cell co‐cultures 38. Within this context, it must be evoked that P. falciparum and P. vivax are genetically distant malaria parasites 58. Probably the heterogeneity between the two species, such as in its chemical composition of soluble antigens 58, 59 and hemozoin 60, 61 could differently modulate BAFF and APRIL production as well as cytokines. Indeed, our findings showed that, in P. vivax acute phase malaria, APRIL but not BAFF levels correlated positively with IL‐1, IL‐2, IL‐4, IL‐6, and IL‐13 levels. In addition, we did not find any relationship between P. vivax parasitaemia and APRIL levels, while an inverse correlation was found between P. falciparum parasitaemia and APRIL plasma levels. Although APRIL and BAFF share several biological characteristics and receptor‐specificity, they have distinct functions. While BAFF is fundamental for B‐cell maturation and survival, APRIL is essential for antibody class‐switching and plasma‐cell survival and is involved in the late stage of B‐cell differentiation 26, 62. Thus, the discrepancies between APRIL and BAFF levels and/or correlations found in this study could also be associated with the different biological functions of APRIL and BAFF during malaria. In addition, we cannot rule out the possibility that genetic polymorphism in the human genes encoding APRIL and BAFF molecules and/or receptors 63, 64, 65, can also play a role in the aforementioned discrepancies.
Consistent with our previous findings 51, the levels of all cytokines increased in the acute phase of both malaria infections and continued to increase after treatment, except for IL‐10. The increased levels of IL‐10 were transient and markedly declined after treatment when parasites were no longer detected. A similar profile was observed for APRIL and/or BAFF levels; the last one is in line with previous findings 36, 54. Thus, plasma APRIL and/or BAFF as IL‐10 levels might reflect the acute phase of malaria. Since IL‐10 upregulates APRIL and BAFF production and secretion 28, 66, 67 and IL‐10 levels correlated positively with parasitaemia, one could speculate that malaria parasites induce an increase of IL‐10 production, which might contribute to the upregulation of APRIL and/or BAFF productions in both infections.
The APRIL and/or BAFF plasma levels are upregulated in many noninfectious 26, 68, 69, 70, 71, 72, 73, 74, 75, 76 and infectious diseases 32, 73, 77, 78, including malaria 36, 54 that are often accompanied by polyclonal B‐cell activation, hypergammaglobulinemia, autoimmune disorders and lymphopenia. In malaria, polyclonal B‐cell activation has been shown in the acute phase of P. vivax and P. falciparum malaria 15, which decreases 5–15 days after the beginning of treatment 15, with similar transient kinetics of IL‐10, APRIL and/or BAFF levels, observed in our study. Thus, it seems possible that increased IL‐10 levels may contribute to the polyclonal B‐cell activation, via APRIL and/or BAFF upregulation during the acute phase of P. vivax and P. falciparum malaria.
Consistent with previous findings 51, 79, 80, the lymphocyte counts were significantly decreased during P. vivax and P. falciparum acute phase malaria. However, lymphopenia was a transient finding and 15 days after the beginning of treatment, the lymphocyte counts were similar to those of control subjects, indicating that this period was sufficient for the patients to achieve lymphocyte homeostasis, according to our previous findings 15. Thus, we believe that APRIL, BAFF, and IL‐10 production might be upregulated as a homeostatic response to the lymphopenia observed in the acute phase of malaria.
TACI is a receptor of the APRIL/BAFF system and is predominantly expressed on B cells and in some subsets of activated T cells 27, 66, 81. Although the spectrum of biological functions of TACI is not fully known, it appears that it plays a crucial role in the antibody response to T cell‐independent and T cell‐ dependent antigens 82, in the induction of plasma cells differentiation and survival 82, in determining macrophage phenotype 83 as well as in promoting division, survival, and activation in T cells 66, 81. To our knowledge, nothing has been published about TACI expression on T cells during human infectious diseases. Regarding B cells, a recent study reported 36 a significantly increased of TACI‐positive B cells during acute and convalescence phases of P. falciparum malaria in Kenyan children. We have access to PBMC of five P. vivax malaria patients in acute and convalescence phases. Our results showed a transient and significant increase in the percentage of TACI‐positive CD4+ and CD8+ T cells during the acute phase, as well as a transient but not significant increase in the percentage of TACI‐positive CD19+ B cells in P. vivax infected donors. Aware that our sample size is too small to make inferences, we also can not rule out the possibility that the discrepancies observed between this study and ours with respect to TACI‐positive B cells, could be associated with the fact that patients involved in our study were adults with uncomplicated P. vivax malaria living in different epidemiological scenarios. In relation to T cells, TACI expression presented a transient kinetics similar to IL‐10 and APRIL levels. Thus, the APRIL and IL‐10 plasma levels as well as the proportion of CD4+ and CD8+ T cells expressing TACI might reflect the acute phase of P. vivax malaria, and may contribute to calcium‐dependent constitutive activation of nuclear factor of activated T cells (NF‐AT) 84 as observed in the early stage of many infectious diseases 85, 86.
Taken together, we demonstrate that APRIL plasma levels as well as the percentage of TACI positive CD4+ and CD8+ T cells were increased in the acute phase of uncomplicated P. vivax infection. Moreover, it seems that the APRIL and BAFF inductions reflect different host strategies for controlling infection with different malaria species, P. vivax and P. falciparum. Further larger cohort study is ongoing in the Brazilian Amazon to provide better knowledge of the APRIL/BAFF system as well as the TACI B‐ and T‐cell expression in the immunomodulation of malaria.
Authors' Contributions
RAP performed experiments, statistical analysis and wrote the paper. ACS performed experiments and manuscript review. DSPS performed statistical analysis and manuscript review. RNRS performed experiments. LAS performed experiments. MRA performed statistical analysis. FS did fieldwork support. JCLJ performed collection of blood and epidemiological data and manuscript review. JOF performed collection of blood and epidemiological data. DMVV designed the study and performed manuscript review. PMDL performed the experiments, statistical analysis and manuscript review. CECP designed the study and performed manuscript review. DMB conceived, designed and coordinated the study, performed collection of blood and epidemiological data and wrote the paper. All the authors read and approved the manuscript for publication.
Conflict of Interest
None.
Acknowledgments
We gratefully thank all the participants for their cooperation and blood donation, and the Secretary of Health of Rondônia State and LACEN/Rondônia for infrastructure support. This work was financially supported by IOC/Fiocruz. RAP and DSPS are recipients of CAPES Doctoral Fellowships.
[Correction added on 9 February 2018, after first online publication: The name of the author Rodrigo Nunes Rodrigues da Silva has been correctly detailed on this version.]
Funding information This work was financially supported by IOC/Fiocruz. RAP and DSPS are recipients of CAPES Doctoral Fellowships.
References
- 1.World Health Organization. 2016. World Malaria Report 2016. (Geneva: World Health Organization, 2016; ) Report No.: Contract No.: ISBN 978‐92‐4‐151171‐1. [Google Scholar]
- 2. Battle, K. E. , Karhunen M. S., Bhatt S., Gething P. W., Howes R. E., Golding N., Van Boeckel T. P., Messina J. P., Shanks G. D., and Smith D. L.. 2014. Geographical variation in Plasmodium vivax relapse. Malar. J. 13:144. [DOI] [PMC free article] [PubMed] [Google Scholar]
- 3. Perez‐Mazliah, D. , and Langhorne J.. 2014. CD4 T‐cell subsets in malaria: TH1/TH2 revisited. Front. Immunol. 5:671. [DOI] [PMC free article] [PubMed] [Google Scholar]
- 4. Cohen, S. , Mc G. I., and Carrington S.. 1961. Gamma‐globulin and acquired immunity to human malaria. Nature. 192:733–737. [DOI] [PubMed] [Google Scholar]
- 5. McGregor, I. A. 1964. The passive transfer of human malarial immunity. Am. J. Trop. Med. Hyg. 13(SUPPL):237–239. [DOI] [PubMed] [Google Scholar]
- 6. Boyle, M. J. , Reiling L., Feng G., Langer C., Osier F. H., Aspeling‐Jones H., Cheng Y. S., Stubbs J., Tetteh K. K., and Conway D. J.. 2015. Human antibodies fix complement to inhibit Plasmodium falciparum invasion of erythrocytes and are associated with protection against malaria. Immunity. 42(3):580–590. [DOI] [PMC free article] [PubMed] [Google Scholar]
- 7. Banic, D. M. , de Oliveira‐Ferreira J., Pratt‐Riccio L. R., Conseil V., Goncalves D., Fialho R. R., Gras‐Masse H., Daniel‐Ribeiro C. T., and Camus D.. 1998. Immune response and lack of immune response to Plasmodium falciparum P126 antigen and its amino‐terminal repeat in malaria‐infected humans. Am. J. Trop. Med. Hyg. 58(6):768–774. [DOI] [PubMed] [Google Scholar]
- 8. Druilhe, P. , Spertini F., Soesoe D., Corradin G., Mejia P., Singh S., Audran R., Bouzidi A., Oeuvray C., and Roussilhon C.. 2005. A malaria vaccine that elicits in humans antibodies able to kill Plasmodium falciparum. PLoS Med. 2(11):344. [DOI] [PMC free article] [PubMed] [Google Scholar]
- 9. Pratt‐Riccio, L. R. , Lima‐Junior J. C., Carvalho L. J., Theisen M., Espindola‐Mendes E. C., Santos F., Oliveira‐Ferreira J., Goldberg A. C., Daniel‐Ribeiro C. T., and Banic D. M.. 2005. Antibody response profiles induced by Plasmodium falciparum glutamate‐rich protein in naturally exposed individuals from a Brazilian area endemic for malaria. Am. J. Trop. Med. Hyg. 73(6):1096–1103. [PubMed] [Google Scholar]
- 10. Roussilhon, C. , Oeuvray C., Muller‐Graf C., Tall A., Rogier C., Trape J. F., Theisen M., Balde A., Perignon J. L., and Druilhe P.. 2007. Long‐term clinical protection from falciparum malaria is strongly associated with IgG3 antibodies to merozoite surface protein 3. PLoS Med. 4(11):e320. [DOI] [PMC free article] [PubMed] [Google Scholar]
- 11. Pratt‐Riccio, L. R. , C. Bianco, Jr. , Totino P. R., Perce‐Da‐Silva Dde S., Silva L. A., Riccio E. K., Ennes‐Vidal V., Neves‐Ferreira A. G., Perales J., and Da Rocha S. L.. 2011. Antibodies against the Plasmodium falciparum glutamate‐rich protein from naturally exposed individuals living in a Brazilian malaria‐endemic area can inhibit in vitro parasite growth. Mem. Inst. Oswaldo Cruz. 106(Suppl 1):34–43. [DOI] [PubMed] [Google Scholar]
- 12. Osier, F. H. , Feng G., Boyle M. J., Langer C., Zhou J., Richards J. S., McCallum F. J., Reiling L., Jaworowski A., and Anders R. F.. 2014. Opsonic phagocytosis of Plasmodium falciparum merozoites: mechanism in human immunity and a correlate of protection against malaria. BMC. Med. 12:108. [DOI] [PMC free article] [PubMed] [Google Scholar]
- 13. Portugal, S. , Pierce S. K., and Crompton P. D.. 2013. Young lives lost as B cells falter: what we are learning about antibody responses in malaria. J. Immunol. 190(7):3039–3046. [DOI] [PMC free article] [PubMed] [Google Scholar]
- 14. Wyler, D. J. 1979. Cellular aspects of immunoregulation in malaria. Bull. World Health Organ. 57(Suppl 1):239–243. [PMC free article] [PubMed] [Google Scholar]
- 15. Banic, D. M. , Viana‐Martins F. S., De Souza J. M., Peixoto T. D., and Daniel‐Ribeiro C.. 1991. Polyclonal B‐lymphocyte stimulation in human malaria and its association with ongoing parasitemia. Am. J. Trop. Med. Hyg. 44(5):571–577. [DOI] [PubMed] [Google Scholar]
- 16. Daniel‐Ribeiro, C. T. , and Zanini G.. 2000. Autoimmunity and malaria: what are they doing together? Acta Trop. 76(3):205–221. [DOI] [PubMed] [Google Scholar]
- 17. Asito, A. S. , Moormann A. M., Kiprotich C., Ng'ang'a Z. W., Ploutz‐Snyder R., and Rochford R.. 2008. Alterations on peripheral B cell subsets following an acute uncomplicated clinical malaria infection in children. Malar. J. 7:238. [DOI] [PMC free article] [PubMed] [Google Scholar]
- 18. Scholzen, A. , and Sauerwein R. W.. 2013. How malaria modulates memory: activation and dysregulation of B cells in Plasmodium infection. Trends Parasitol. 29(5):252–262. [DOI] [PubMed] [Google Scholar]
- 19. Zander, R. A. , and Butler N. S.. 2013. Dysfunctional adaptive immunity during parasitic infections. Curr. Immunol. Rev. 9(3):179–189. [DOI] [PMC free article] [PubMed] [Google Scholar]
- 20. Ampomah, P. , Stevenson L., Ofori M. F., Barfod L., and Hviid L.. 2014. Kinetics of B cell responses to Plasmodium falciparum erythrocyte membrane protein 1 in Ghanaian women naturally exposed to malaria parasites. J. Immunol. 192(11):5236–5244. [DOI] [PMC free article] [PubMed] [Google Scholar]
- 21. Treml, J. F. , Hao Y., Stadanlick J. E., and Cancro M. P.. 2009. The BLyS family: toward a molecular understanding of B cell homeostasis. Cell Biochem. Biophys. 53(1):1–16. [DOI] [PMC free article] [PubMed] [Google Scholar]
- 22. Naradikian, M. S. , Perate A. R., and Cancro M. P.. 2015. BAFF receptors and ligands create independent homeostatic niches for B cell subsets. Curr. Opin. Immunol. 34:126–129. [DOI] [PubMed] [Google Scholar]
- 23. Lied, G. A. , and Berstad A.. 2011. Functional and clinical aspects of the B‐cell‐activating factor (BAFF): a narrative review. Scand. J. Immunol. 73(1):1–7. [DOI] [PubMed] [Google Scholar]
- 24. Bossen, C. , and Schneider P.. 2006. BAFF, APRIL and their receptors: structure, function and signaling. Semin. Immunol. 18(5):263–275. [DOI] [PubMed] [Google Scholar]
- 25. Manfroi, B. , McKee T., Mayol J. F., Tabruyn S., Moret S., Villiers C., Righini C., Dyer M., Callanan M., and Schneider P.. 2017. CXCL‐8/IL8 produced by diffuse large B‐cell lymphomas recruits neutrophils expressing a proliferation‐inducing ligand APRIL. Cancer Res. 77(5):1097–1107. [DOI] [PubMed] [Google Scholar]
- 26. Vincent, F. B. , Morand E. F., Schneider P., and Mackay F.. 2014. The BAFF/APRIL system in SLE pathogenesis. Nat. Rev. Rheumatol. 10(6):365–373. [DOI] [PubMed] [Google Scholar]
- 27. Mackay, F. , Silveira P. A., and Brink R.. 2007. B cells and the BAFF/APRIL axis: fast‐forward on autoimmunity and signaling. Curr. Opin. Immunol. 19(3):327–336. [DOI] [PubMed] [Google Scholar]
- 28. Nardelli, B. , Belvedere O., Roschke V., Moore P. A., Olsen H. S., Migone T. S., Sosnovtseva S., Carrell J. A., Feng P., and Giri J. G.. 2001. Synthesis and release of B‐lymphocyte stimulator from myeloid cells. Blood. 97(1):198–204. [DOI] [PubMed] [Google Scholar]
- 29. Moon, E. Y. , Lee J. H., Oh S. Y., Ryu S. K., Kim H. M., Kwak H. S., and Yoon W. K.. 2006. Reactive oxygen species augment B‐cell‐activating factor expression. Free Radic. Biol. Med. 40(12):2103–2111. [DOI] [PubMed] [Google Scholar]
- 30. Scapini, P. , Nardelli B., Nadali G., Calzetti F., Pizzolo G., Montecucco C., and Cassatella M. A.. 2003. G‐CSF‐stimulated neutrophils are a prominent source of functional BLyS. J. Exp. Med. 197(3):297–302. [DOI] [PMC free article] [PubMed] [Google Scholar]
- 31. Gomez, A. M. , Ouellet M., and Tremblay M. J.. 2015. HIV‐1‐triggered release of type I IFN by plasmacytoid dendritic cells induces BAFF production in monocytes. J. Immunol. 194(5):2300–2308. [DOI] [PubMed] [Google Scholar]
- 32. Goto, Y. , Omachi S., Sanjoba C., and Matsumoto Y.. 2014. Elevation of serum B‐cell activating factor levels during visceral leishmaniasis. Am. J. Trop. Med. Hyg. 91(5):912–914. [DOI] [PMC free article] [PubMed] [Google Scholar]
- 33. Yang, C. , Li N., Wang Y., Zhang P., Zhu Q., Li F., Han Q., Lv Y., Yu L., and Wei P.. 2014. Serum levels of B‐cell activating factor in chronic hepatitis B virus infection: association with clinical diseases. J. Interferon Cytokine Res. 34(10):787–794. [DOI] [PMC free article] [PubMed] [Google Scholar]
- 34. Bermejo, D. A. , Amezcua‐Vesely M. C., Montes C. L., Merino M. C., Gehrau R. C., Cejas H., Acosta‐Rodriguez E. V., and Gruppi A.. 2010. BAFF mediates splenic B cell response and antibody production in experimental Chagas disease. PLoS Negl. Trop. Dis. 4(5):e679. [DOI] [PMC free article] [PubMed] [Google Scholar]
- 35. Liu, X. Q. , Stacey K. J., Horne‐Debets J. M., Cridland J. A., Fischer K., Narum D., Mackay F., Pierce S. K., and Wykes M. N.. 2012. Malaria infection alters the expression of B‐cell activating factor resulting in diminished memory antibody responses and survival. Eur. J. Immunol. 42(12):3291–3301. [DOI] [PMC free article] [PubMed] [Google Scholar]
- 36. Nduati, E. , Gwela A., Karanja H., Mugyenyi C., Langhorne J., Marsh K., and Urban B. C.. 2011. The plasma concentration of the B cell activating factor is increased in children with acute malaria. J. Infect. Dis. 204(6):962–970. [DOI] [PMC free article] [PubMed] [Google Scholar]
- 37. Muehlenbachs, A. , Fried M., Lachowitzer J., Mutabingwa T. K., and Duffy P. E.. 2007. Genome‐wide expression analysis of placental malaria reveals features of lymphoid neogenesis during chronic infection. J. Immunol. 179(1):557–565. [DOI] [PubMed] [Google Scholar]
- 38. Kumsiri, R. , Potup P., Chotivanich K., Petmitr S., Kalambaheti T., and Maneerat Y.. 2010. Blood stage Plasmodium falciparum antigens induce T cell independent immunoglobulin production via B cell activation factor of the TNF family (BAFF) pathway. Acta Trop. 116(3):217–226. [DOI] [PubMed] [Google Scholar]
- 39. Barbosa, S. , Gozze A. B., Lima N. F., Batista C. L., Bastos Mda S., Nicolete V. C., Fontoura P. S., Gonçalves R. M., Viana S. A., and Menezes M. J.. 2014. Epidemiology of disappearing Plasmodium vivax malaria: a case study in rural Amazonia. PLoS Negl. Trop. Dis. 8(8):e3109. [DOI] [PMC free article] [PubMed] [Google Scholar]
- 40. Oliveira‐Ferreira, J. , Lacerda M. V., Brasil P., Ladislau J. L., Tauil P. L., and Daniel‐Ribeiro C. T.. 2010. Malaria in Brazil: an overview. Malar. J. 9:115. [DOI] [PMC free article] [PubMed] [Google Scholar]
- 41. Trape, J. F. 1985. Rapid evaluation of malaria parasite density and standardization of thick smear examination for epidemiological investigations. Trans. R. Soc. Trop. Med. Hyg. 79(2):181–184. [DOI] [PubMed] [Google Scholar]
- 42. Snounou, G. , Viriyakosol S., Jarra W., Thaithong S., and Brown K. N.. 1993. Identification of the four human malaria parasite species in field samples by the polymerase chain reaction and detection of a high prevalence of mixed infections. Mol. Biochem. Parasitol. 58(2):283–292. [DOI] [PubMed] [Google Scholar]
- 43. Smith, J. G. , Liu X., Kaufhold R. M., Clair J., and Caulfield M. J.. 2001. Development and validation of a gamma interferon ELISPOT assay for quantitation of cellular immune responses to varicella‐zoster virus. Clin. Diagn. Lab. Immunol. 8(5):871–879. [DOI] [PMC free article] [PubMed] [Google Scholar]
- 44. Ryg‐Cornejo, V. , Ly A., and Hansen D. S.. 2016. Immunological processes underlying the slow acquisition of humoral immunity to malaria. Parasitology. 143(2):199–207. [DOI] [PubMed] [Google Scholar]
- 45. Sullivan, R. T. , Ssewanyana I., Wamala S., Nankya F., Jagannathan P., Tappero J. W., Mayanja‐Kizza H., Muhindo M. K., Arinaitwe E., and Kamya M.. 2016. B cell sub‐types following acute malaria and associations with clinical immunity. Malar. J. 15:139. [DOI] [PMC free article] [PubMed] [Google Scholar]
- 46. Renia, L. , and Goh Y. S.. 2016. Malaria parasites: the great escape. Front. Immunol. 7:463. [DOI] [PMC free article] [PubMed] [Google Scholar]
- 47. Gomes, P. S. , Bhardwaj J., Rivera‐Correa J., Freire‐De‐Lima C. G., and Morrot A.. 2016. Immune escape strategies of malaria parasites. Front. Microbiol. 7:1617. [DOI] [PMC free article] [PubMed] [Google Scholar]
- 48. Duffy, M. F. , Noviyanti R., Tsuboi T., Feng Z. P., Trianty L., Sebayang B. F., Takashima E., Sumardy F., Lampah D. A., and Turner L.. 2016. Differences in PfEMP1s recognized by antibodies from patients with uncomplicated or severe malaria. Malar. J. 15(1):258. [DOI] [PMC free article] [PubMed] [Google Scholar]
- 49. Bujila, I. , Schwarzer E., Skorokhod O., Weidner J. M., Troye‐Blomberg M., and Ostlund Farrants A. K.. 2016. Malaria‐derived hemozoin exerts early modulatory effects on the phenotype and maturation of human dendritic cells. Cell Microbiol. 18(3):413–423. [DOI] [PubMed] [Google Scholar]
- 50. Soni, R. , Sharma D., and Bhatt T. K.. 2016. Plasmodium falciparum Secretome in Erythrocyte and Beyond. Front. Microbiol. 7:194. [DOI] [PMC free article] [PubMed] [Google Scholar]
- 51. Rodrigues‐da‐Silva, R. N. , Lima‐Junior Jda C., Fonseca Bde P., Antas P. R., Baldez A., Storer F. L., Santos F., Banic D. M., and Oliveira‐Ferreira J.. 2014. Alterations in cytokines and haematological parameters during the acute and convalescent phases of Plasmodium falciparum and Plasmodium vivax infections. Mem. Inst. Oswaldo Cruz. 109(2):154–162. [DOI] [PMC free article] [PubMed] [Google Scholar]
- 52. Dieye, Y. , Mbengue B., Dagamajalu S., Fall M. M., Loke M. F., Nguer C. M., Thiam A., Vadivelu J., and Dieye A.. 2016. Cytokine response during non‐cerebral and cerebral malaria: evidence of a failure to control inflammation as a cause of death in African adults. PeerJ. 4:e1965. [DOI] [PMC free article] [PubMed] [Google Scholar]
- 53. Halsey, E. S. , Baldeviano G. C., Edgel K. A., Vilcarromero S., Sihuincha M., and Lescano A. G.. 2016. Symptoms and immune markers in plasmodium/dengue virus co‐infection compared with mono‐infection with either in Peru. PLoS Negl. Trop. Dis. 10(4):e0004646. [DOI] [PMC free article] [PubMed] [Google Scholar]
- 54. Scholzen, A. , Teirlinck A. C., Bijker E. M., Roestenberg M., Hermsen C. C., Hoffman S. L., and Sauerwein R. W.. 2014. BAFF and BAFF receptor levels correlate with B cell subset activation and redistribution in controlled human malaria infection. J. Immunol. 192(8):3719–3729. [DOI] [PMC free article] [PubMed] [Google Scholar]
- 55. Litinskiy, M. B. , Nardelli B., Hilbert D. M., He B., Schaffer A., Casali P., and Cerutti A.. 2002. DCs induce CD40‐independent immunoglobulin class switching through BLyS and APRIL. Nat. Immunol. 3(9):822–829. [DOI] [PMC free article] [PubMed] [Google Scholar]
- 56. Scapini, P. , Bazzoni F., and Cassatella M. A.. 2008. Regulation of B‐cell‐activating factor (BAFF)/B lymphocyte stimulator (BLyS) expression in human neutrophils. Immunol. Lett. 116(1):1–6. [DOI] [PubMed] [Google Scholar]
- 57. Chu, V. T. , Enghard P., Riemekasten G., and Berek C.. 2007. In vitro and in vivo activation induces BAFF and APRIL expression in B cells. J. Immunol. 179(9):5947–5957. [DOI] [PubMed] [Google Scholar]
- 58. Yadav, M. K. , and Swati D.. 2016. In silico study of variable surface proteins in plasmodium species: perspectives in drug design. Interdiscip. Sci. 8(3):294–302. [DOI] [PubMed] [Google Scholar]
- 59. Carlton, J. M. , Adams J. H., Silva J. C., Bidwell S. L., Lorenzi H., Caler E., Crabtree J., Angiuoli S. V., Merino E. F., and Amedeo P.. 2008. Comparative genomics of the neglected human malaria parasite Plasmodium vivax. Nature. 455(7214):757–763. [DOI] [PMC free article] [PubMed] [Google Scholar]
- 60. Lin, J. W. , Spaccapelo R., Schwarzer E., Sajid M., Annoura T., Deroost K., Ravelli R. B., Aime E., Capuccini B., and Mommaas‐Kienhuis A. M.. 2015. Replication of Plasmodium in reticulocytes can occur without hemozoin formation, resulting in chloroquine resistance. J. Exp. Med. 212(6):893–903. [DOI] [PMC free article] [PubMed] [Google Scholar]
- 61. Noland, G. S. , Briones N., and D. J. Sullivan, Jr . 2003. The shape and size of hemozoin crystals distinguishes diverse Plasmodium species. Mol. Biochem. Parasitol. 130(2):91–99. [DOI] [PubMed] [Google Scholar]
- 62. Benson, M. J. , Dillon S. R., Castigli E., Geha R. S., Xu S., Lam K. P., and Noelle R. J.. 2008. Cutting edge: the dependence of plasma cells and independence of memory B cells on BAFF and APRIL. J. Immunol. 180(6):3655–3659. [DOI] [PubMed] [Google Scholar]
- 63. Jasek, M. , Wagner M., Sobczynski M., Wolowiec D., Kuliczkowski K., Woszczyk D., Kielbinski M., Kusnierczyk P., Frydecka I., and Karabon L.. 2015. Polymorphisms in genes of the BAFF/APRIL system may constitute risk factors of B‐CLL‐a preliminary study on a Polish population. Tissue Antigens. 86(4):279–284. [DOI] [PubMed] [Google Scholar]
- 64. Capobianco, M. P. , Cassiano G. C., Furini A. A., Storti‐Melo L. M., Pavarino E. C., Galbiatti A. L., Fraga V. D., Conceição L. M., Couto V. S., and Couto A. A.. 2013. No evidence for association of the CD40, CD40L and BLYS polymorphisms, B‐cell co‐stimulatory molecules, with Brazilian endemic Plasmodium vivax malaria. Trans. R. Soc. Trop. Med. Hyg. 107(6):377–383. [DOI] [PubMed] [Google Scholar]
- 65. Furuya, T. , Koga M., Hikami K., Kawasaki A., and Tsuchiya N.. 2012. Effects of APRIL (TNFSF13) polymorphisms and splicing isoforms on the secretion of soluble APRIL. Mod. Rheumatol. 22(4):541–549. [DOI] [PubMed] [Google Scholar]
- 66. Mackay, F. , and Leung H.. 2006. The role of the BAFF/APRIL system on T cell function. Semin. Immunol. 18(5):284–289. [DOI] [PubMed] [Google Scholar]
- 67. Zhou, L. , Zhong R., Hao W., Wang H., Fan X., Zhang L., and Mi Q.. 2009. Interleukin‐10 and interferon‐gamma up‐regulate the expression of B‐cell activating factor in cultured human promyelocytic leukemia cells. Exp. Mol. Pathol. 87(1):54–58. [DOI] [PubMed] [Google Scholar]
- 68. Ueda‐Hayakawa, I. , Tanimura H., Osawa M., Iwasaka H., Ohe S., Yamazaki F., Mizuno K., and Okamoto H.. 2013. Elevated serum BAFF levels in patients with sarcoidosis: association with disease activity. Rheumatology (Oxford). 52(9):1658–1666. [DOI] [PubMed] [Google Scholar]
- 69. Saussine, A. , Tazi A., Feuillet S., Rybojad M., Juillard C., Bergeron A., Dessirier V., Bouhidel F., Janin A., and Bensussan A.. 2012. Active chronic sarcoidosis is characterized by increased transitional blood B cells, increased IL‐10‐producing regulatory B cells and high BAFF levels. PLoS ONE. 7(8):e43588. [DOI] [PMC free article] [PubMed] [Google Scholar]
- 70. Mercado, U. , and Diaz‐Molina R.. 2016. [B lymphocyte stimulator (BLyS/BAFF) level in sera of patients with lupus]. Rev. Med. Inst. Mex. Seguro Soc. 54(3):334–337. [PubMed] [Google Scholar]
- 71. Wei, F. , Chang Y., and Wei W.. 2015. The role of BAFF in the progression of rheumatoid arthritis. Cytokine. 76(2):537–544. [DOI] [PubMed] [Google Scholar]
- 72. Deng, F. , Chen J., Zheng J., Chen Y., Huang R., Yin J., Gao X., Lin Q., Huang C., and Gao Y.. 2016. Association of BAFF and IL‐17A with subphenotypes of primary Sjogren's syndrome. Int. J. Rheum. Dis. 19(7):715–720. [DOI] [PubMed] [Google Scholar]
- 73. Vincent, F. B. , Saulep‐Easton D., Figgett W. A., Fairfax K. A., and Mackay F.. 2013. The BAFF/APRIL system: emerging functions beyond B cell biology and autoimmunity. Cytokine Growth Factor Rev. 24(3):203–215. [DOI] [PMC free article] [PubMed] [Google Scholar]
- 74. Bolkun, L. , Grubczak K., Schneider G., Zembko P., Radzikowska U., Singh P., Kloczko J., Ratajczak M. Z., Moniuszko M., and Eljaszewicz A.. 2016. Involvement of BAFF and APRIL in resistance to apoptosis of Acute Myeloid Leukemia. J. Cancer. 7(14):1979–1983. [DOI] [PMC free article] [PubMed] [Google Scholar]
- 75. Sun, B. , Li L., Xu M., Wang X., Wang F., and Ni H.. 2016. Significance of BAFF/APRIL expression and their receptors in pediatric patients with Acute Lymphoblastic Leukemia. J. Pediatr. Hematol. Oncol. 38(3):167–172. [DOI] [PubMed] [Google Scholar]
- 76. Jablonska, E. , Dakowicz L., Ratajczak‐Wrona W., Garley M., Sawicka‐Powierza J., and Krawczuk‐Rybak M.. 2014. TNF superfamily proteins in the serum of patients with B‐ALL‐preliminary study. Clin. Lab. 60(10):1757–1764. [DOI] [PubMed] [Google Scholar]
- 77. Liu, K. , Zhang Y., Hu S., Yu Y., Yang Q., Jin D., Chen X., Jin Q., and Liu H.. 2012. Increased levels of BAFF and APRIL related to human active pulmonary tuberculosis. PLoS ONE. 7(6):e38429. [DOI] [PMC free article] [PubMed] [Google Scholar]
- 78. Tarantino, G. , Marco V. D., Petta S., Almasio P. L., Barbaria F., Licata A., Bosco G. L., Tripodo C., Stefano R. D., and Craxi A.. 2009. Serum BLyS/BAFF predicts the outcome of acute hepatitis C virus infection. J. Viral Hepat. 16(6):397–405. [DOI] [PubMed] [Google Scholar]
- 79. Kotepui, M. , Phunphuech B., Phiwklam N., Chupeerach C., and Duangmano S.. 2014. Effect of malarial infection on haematological parameters in population near Thailand‐Myanmar border. Malar. J. 13:218. [DOI] [PMC free article] [PubMed] [Google Scholar]
- 80. Wickramasinghe, S. N. , and Abdalla S. H.. 2000. Blood and bone marrow changes in malaria. Baillieres Best Pract. Res. Clin. Haematol. 13(2):277–299. [DOI] [PubMed] [Google Scholar]
- 81. Croft, M. 2014. The TNF family in T cell differentiation and function‐unanswered questions and future directions. Semin. Immunol. 26(3):183–190. [DOI] [PMC free article] [PubMed] [Google Scholar]
- 82. Zhang, Y. , Li J., Zhang Y. M., Zhang X. M., and Tao J.. 2015. Effect of TACI signaling on humoral immunity and autoimmune diseases. J Immunol Res. 2015:247426. [DOI] [PMC free article] [PubMed] [Google Scholar]
- 83. Allman, W. R. , Dey R., Liu L., Siddiqui S., Coleman A. S., Bhattacharya P., Yano M., Uslu K., Takeda K., and Nakhasi H. L.. 2015. TACI deficiency leads to alternatively activated macrophage phenotype and susceptibility to Leishmania infection. Proc. Natl. Acad. Sci. U. S. A. 112(30):E4094–E4103. [DOI] [PMC free article] [PubMed] [Google Scholar]
- 84. von Bulow, G. U. , and Bram R. J.. 1997. NF‐AT activation induced by a CAML‐interacting member of the tumor necrosis factor receptor superfamily. Science. 278(5335):138–141. [DOI] [PubMed] [Google Scholar]
- 85. Fric, J. , Zelante T., Wong A. Y., Mertes A., Yu H. B., and Ricciardi‐Castagnoli P.. 2012. NFAT control of innate immunity. Blood. 120(7):1380–1389. [DOI] [PubMed] [Google Scholar]
- 86. Gigley, J. P. , Bhadra R., Moretto M. M., and Khan I. A.. 2012. T cell exhaustion in protozoan disease. Trends Parasitol. 28(9):377–384. [DOI] [PMC free article] [PubMed] [Google Scholar]