Abstract
In this study, gravity waves (GWs) in the high-resolution GEOS-5 Nature Run are first evaluated with respect to satellite and other model results. Southern Hemisphere winter sources of non-orographic GWs in the model are then investigated by linking measures of tropospheric non-orographic gravity wave generation tied to precipitation and frontogenesis with absolute gravity wave momentum flux in the lower stratosphere. Finally, non-orographic GW momentum flux is compared to orographic gravity wave momentum flux and compared to previous estimates. The results show that the global patterns in GW amplitude, horizontal wavelength, and propagation direction are realistic compared to observations. However, as in other global models, the amplitudes are weaker and horizontal wavelengths longer than observed. The global patterns in absolute GW momentum flux also agree well with previous model and observational estimates. The evaluation of model non-orographic GW sources in the Southern Hemisphere winter shows that strong intermittent precipitation (greater than 10 mm h−1) is associated with GW momentum flux over the South Pacific, whereas frontogenesis and less intermittent, lower precipitation rates (less than 10 mm h−1) are associated with GW momentum flux near 60°S. In the model, orographic GWs contribute almost exclusively to a peak in zonal mean momentum flux between 70 and 75°S, while non-orographic waves dominate at 60°S, and non-orographic GWs contribute a third to a peak in zonal mean momentum flux between 25 and 30°S.
Keywords: gravity waves, gravity wave sources, non-orographic gravity waves, Southern Hemisphere, gravity wave momentum flux, high-resolution climate simulation
1. Introduction
Gravity waves (GWs) are important drivers of circulation and transport in the middle atmosphere. They are currently included in most climate models via parametrizations due to computational limitations on resolution. The resolution required to resolve the full GW spectrum is orders of magnitude higher than is employed by current climate models, which means that climate models will need to rely on gravy wave parametrizations for the foreseeable future. However, at this time GW parametrizations remain poorly constrained by observations (Alexander et al., 2010). This contributes to large model biases in middle atmosphere temperatures and winds, especially in the Southern Hemisphere stratosphere (Butchart et al., 2011; McLandress et al., 2012).
Some studies show improvements in model biases when GW parametrizations are tied to tropospheric sources of GW generation (Charron and Manzini, 2002; Beres et al., 2005; Song and Chun, 2005; Richter et al., 2010). For example, Choi and Chun (2013) showed that wind biases in the Southern Hemisphere winter stratosphere were reduced in a global climate model when they included a convective GW parametrization in addition to the existing GW drag parametrization. Other studies have shown better model realism when the GW parametrization is based on an intermittent source function (de la Cámara and Lott, 2015). This is based on several papers that have shown the highly intermittent nature of GW generation, both in observations and models (e.g. Hertzog et al., 2008, 2012; Plougonven et al., 2013; Jewtoukoff et al., 2015).
The main sources of GWs are orography, jets/fronts, and convection. It is generally thought that the distributions of these sources vary with latitude, with convection dominating in the Tropics and jets, fronts, and orography dominating in the midlatitudes (Plougonven and Zhang, 2014). Orographic GW momentum fluxes are typically several times larger than non-orographic GW momentum flux and are concentrated over orographic features (e.g. Vincent et al., 2007; Hertzog et al., 2008; Jewtoukoff et al., 2015). Even though orographic GW momentum fluxes are much larger than non-orographic GW momentum fluxes locally, non-orographic GWs have been shown to contribute substantially to the total GW momentum flux since they are generated over a much larger area (Hertzog et al., 2008). Convection is an important generation mechanism of non-orographic GWs in the troposphere (e.g. Alexander et al., 1995), and the importance of moisture has been highlighted in idealized models (Wei and Zhang, 2014) and in case-studies comparing simulations with a regional model to observations (Plougonven et al., 2015). Fronts are also known to be a major source of non-orographic GWs (Eckermann and Vincent, 1993; Plougonven and Snyder, 2007). However, the relative importance of different non-orographic GW sources is still not completely understood.
This study examines GWs and their sources, with an emphasis on the Southern Hemisphere winter, in a 7 km horizontal resolution global climate model. Global models in general, and the model used in this study in particular, are good tools for this investigation because they have complete wind and temperature output on a regular grid and a high resolution that resolves much of the GW spectrum. We first validate the GW properties and global distributions with respect to observations and other models. Then we examine the relationship between non-orographic GWs and sources. Finally we compare orographic and non-orographic GW momentum flux.
The paper is organized as follows. In section 2 we describe the model. In section 3 we validate the model's GWs by first comparing them to those observed by the Atmospheric Infrared Sounder (AIRS) and then computing the January and July absolute GW momentum flux and comparing it to previous model estimates. In section 4 we relate the absolute GW momentum flux in the lower stratosphere to proxies of tropospheric wave generation. In section 5 we compare the momentum fluxes generated by orographic GWs to those generated by non-orographic GWs. Finally, we provide a summary and closing remarks in section 6.
2. GEOS-5 Nature Run
The Nature Run (NR) is a global non-hydrostatic, 7 km horizontal resolution mesoscale simulation produced by the Goddard Earth Observing System (GEOS-5) atmospheric general circulation model (Putman et al., 2014; Gelaro et al., 2015) with finite-volume (FV) dynamics (based on Lin, 2004) on a cubed-sphere horizontal grid (Putman and Lin, 2007). The main purpose of the NR is conducting observation system simulation experiments (OSSEs) to test proposed observing system designs, but here we take advantage of the existing high-resolution simulation to study GWs. The NR simulation was run for roughly 2 years, from May 2005 to June 2007, with 72 vertical levels from the surface up to ∼0.01 hPa (∼85 km). The vertical resolution is ∼200 m or less below 800 hPa, ∼500 m near 600 hPa, ∼1 km near the tropopause, and ∼2 km near the stratopause. The physics, remapping, and dynamics time steps were 300, 75, and 5 s, respectively. The NR was forced with prescribed sea-surface temperature and sea-ice at 0.25° resolution, biomass burning emissions (organic and black carbon aerosols, SO2, CO, and CO2) at 0.1° resolution, and anthropogenic emissions (aerosols, CO, CO2, SO2, SO4) at 0.1° resolution (Putman et al., 2014, give details).
The NR is in the ‘grey zone’ of atmospheric model resolution, where the resolution is high enough to start resolving smaller-scale processes like convection but not high enough to resolve them completely. Models in the grey zone still need to rely on parametrizations to some degree, but these parametrizations can be relaxed compared to coarser resolution models. Convection in GEOS-5 is parametrized using the Relaxed Arakawa–Schubert (RAS) scheme of Moorthi and Suarez (1992). As resolution increases, the RAS is controlled by a stochastic limit on deep convection (Tokioka et al., 1988), which basically confines the RAS to function as a shallow convection scheme. Another resolution-aware parametrization in GEOS-5 is the orographic GW parametrization (McFarlane, 1987). Parametrized orographic waves are forced by subgrid-scale variance, which is scaled down with increasing resolution to account for the increase in resolved waves produced by the dynamics of the model.
Even with a very high horizontal resolution, the NR still required a non-orographic GW parametrization (based on Garcia and Boville, 1994) to achieve realistic GW drag and circulation in the middle atmosphere. Holt et al. (2016) discussed this issue in depth for the Tropics and concluded that non-orographic GW generation was realistic in the NR but that the non-orographic GW parametrization was necessary because the resolved waves were too heavily dissipated by the model. The NR included explicit diffusion from second-order divergence damping, which provided a strong damping on the resolved GWs. Parametrized non-orographic GWs were specified with an equatorial peak in momentum flux (figure 3 in Molod et al, 2015), and the phase speed spectrum was launched from 400 hPa with a range of ±40 m s−1 in increments of 10 m s−1.
Figure 3.
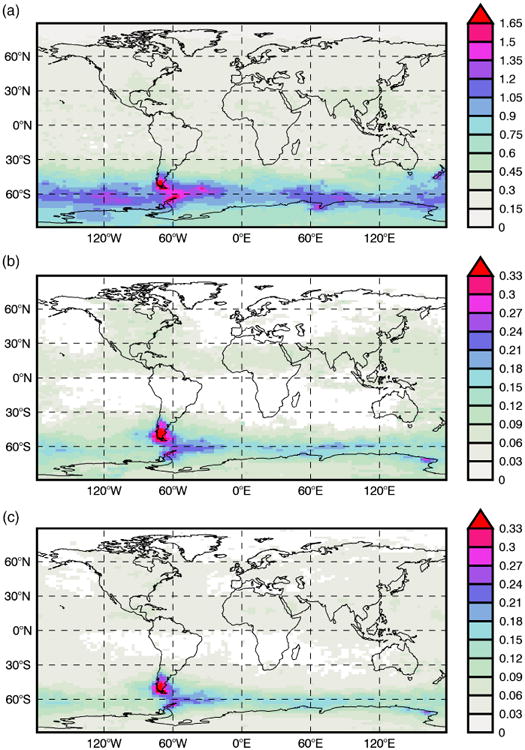
July average wave amplitude (K) near ∼35 km for (a) AIRS and (b, c) the NR with detection thresholds (b) 0.05 K and (c) 0.03 K. White boxes indicate where not enough data were above the given threshold. Note the different ranges on the colour bars; the NR range is five times smaller than the AIRS range. [Colour figure can be viewed at wileyonlinelibrary.com].
For the analysis of the NR in this paper, we used 30 min instantaneous output which was interpolated from the cubed-sphere grid to a 0.0625° × 0.0625° (lon×lat) grid while maintaining the full model vertical grid. We also used hourly instantaneous output interpolated to 0.5° × 0.5° (lon×lat) horizontal resolution also maintaining the full model vertical grid.
3. Validation of the gravity waves in the NR
3.1. Comparison to AIRS
The AIRS instrument on NASA's Aqua satellite provides global coverage of infrared radiance spectra in three spectral bands between 3.74 and 15.4 μm. The 4.3 and 15μm CO2 bands have been used extensively to study GWs in the stratosphere (e.g. Alexander and Teitelbaum, 2007; Gong et al., 2012; Hoffmann et al., 2013, 2014, 2016). Here we use the AIRS 4.3 μm channel average brightness temperatures described in Hoffmann and Alexander (2010). AIRS uses cross-track scanning, where each scan consists of 90 footprints over 1780 km (at the ground) and is separated by 18 km along-track distance. The footprint size varies with the scanning angle between 14×14 km2 and 21×42 km2 (figure 2 in Hoffmann et al., 2014).
Figure 2.
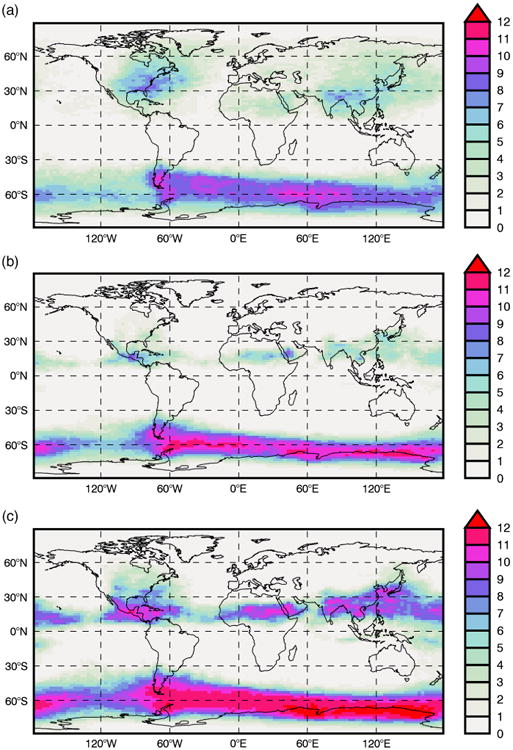
July average number (thousands) of detected wave events near ∼35 km for (a) AIRS and (b, c) the NR with detection thresholds (b) 0.05 K and (c) 0.03 K. [Colour figure can be viewed at wileyonlinelibrary.com].
To obtain AIRS brightness temperature anomalies, background variations first need to be removed. Additionally, AIRS raw radiances have a limb-brightening in the cross-track direction that needs to be removed before studying the small-scale waves. As is traditionally done with AIRS, a fourth-order polynomial fit in the x-direction was used to remove the background at each y-location, where the x-direction refers to cross-track scanning and the y-direction refers to along-track scanning. In addition to removing the limb-brightening effect, this method removes larger-scale wave perturbations with horizontal wavelengths longer than ∼500 km. Figure 1 shows an example of the AIRS brightness temperature anomalies on 26 July 2005 in the Southern Hemisphere.
Figure 1.
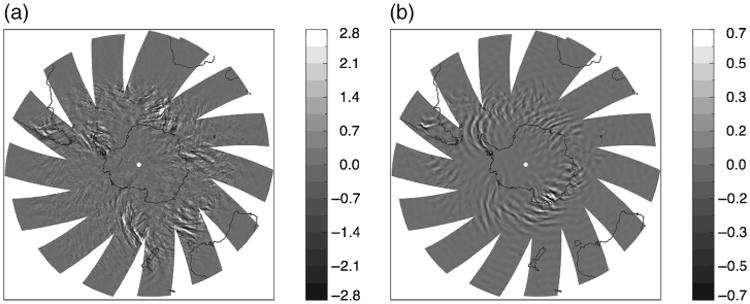
Southern Hemisphere brightness temperature anomalies on 26 July 2005 for (a) AIRS and (b) the NR near ∼35 km. Note the different colour bar ranges. The NR is a climate model, so individual wave features differ because of different meteorological conditions.
Figure 1 also shows NR brightness temperature anomalies sampled at the AIRS measurement locations for the same day. For the NR, brightness temperatures were estimated as the vertical average temperature weighted by the AIRS kernel function, which has a broad peak between 30 and 40 km altitude (figure 3 in Hoffmann and Alexander, 2010). Brightness temperature anomalies were then obtained by subtracting the large-scale background (>500 km). The background was approximated using a spherical harmonic series truncated at horizontal wavenumber n=80 with an exponential taper (Sardeshmukh and Hoskins, 1984). Finally, the NR brightness temperature anomalies were sampled at AIRS footprints. The dates for the NR and AIRS are the same, but since the NR is a climate model, the individual wave features are not expected to be exactly the same. However, qualitatively the two fields have a similar overall pattern around Antarctica, with especially notable agreement over South America and the Antarctic Peninsula. The amplitudes of the NR anomalies are about a factor of 4 smaller than the amplitudes of the AIRS anomalies. This is attributed to excessive model dissipation and will be discussed in more detail below. Another difference between AIRS and the NR is in the latitude of the waves south of Australia which are farther north in the observations. Also note that the NR plot is smoother than the AIRS plot, most likely because of the noise inherent in observations. This date is typical of the similarity found between the AIRS observations and the NR simulation.
To evaluate and compare NR and AIRS GW occurrence frequencies, amplitudes, horizontal wavelengths, and horizontal propagation directions, we analyzed waves with the basic method described in Alexander and Barnet (2007). We applied this analysis to both the AIRS and the AIRS-sampled-NR brightness temperature anomalies for July 2005. The brightness temperature anomalies were interpolated to give constant 13.4 km spacing in x. Then the S-transform was applied to the brightness temperature anomalies to give the complex transform τ(λx, x), and the covariance spectrum between the two rows adjacent in y was computed. This covariance spectrum was integrated in x, excluding signals within the ‘cone of influence’ that are affected by the edges of the observation swath (e.g. Woods and Smith, 2010).
To identify dominant waves for further analysis, the covariance spectra were averaged ±5 rows ahead and behind in the y -direction, and up to eight peaks in the covariance λx spectrum were identified. This averaging was done to ensure that the identified signals (λxi, i ≤ 8) were coherent waves occurring across multiple rows of data, thus helping to eliminate the effects of noise. Now returning to the individual two-row-covariance spectrum, we focused only on these identified signals and computed the phase shift Δϕi in the y-direction, where Δϕi is the angle whose tangent is the ratio of imaginary to real components of the complex covariance. The y-wavelength is given by λyi = Δy/Δϕi, where Δy is the spacing between rows. The net wave amplitude at each point along the swath was then computed by summing the identified signal amplitudes . Wavelengths at each point were computed as weighted sums, and . The values of λy were also smoothed with a triangular three-point smoothing in the y-direction. The horizontal wavenumber, k, and orientation of phase lines, θ, relative to the x-direction were computed via
| (1) |
and
| (2) |
Finally, with the known angle of the measurement swath relative to the cardinal directions, the wave orientation direction was computed relative to east with 180-degree ambiguity. Positive angles represent waves propagating northeast/southwest, while negative angles represent waves propagating southeast/northwest. We can break the ambiguity with the assumption that waves observed by AIRS must have long vertical wavelengths, and are thus propagating upstream against the local wind. Since stratospheric winds are eastward in winter and westward in summer, waves seen in AIRS data generally propagate westward in winter and eastward in summer (Ern et al., 2017).
To create a map of average wave properties, the local amplitude-weighted means were computed. All of the AIRS results were filtered to include only signals with covariance greater than 3σN, where σN is the standard deviation of the noise covariance amplitude and is a function of temperature (figure 6 in Hoffmann et al., 2014). We chose 3σN because it excludes unwanted noise and retains a good signal. For the NR the results were filtered with a constant threshold value since the model obviously does not have the instrument noise.
Figure 6.

Monthly mean absolute gravity wave momentum fluxes at 20 km for (a) January 2006 of the CAM5 run presented in Geller et al. (2013) with global mean value 0.6 mPa, and (b) January 2006 of the NR with global mean value 1.3 mPa. [Colour figure can be viewed at wileyonlinelibrary.com].
Figure 2 shows the July average number of detected wave events for AIRS and the NR. Since the AIRS weighting function peaks between 30 and 40 km, Figures 1–5 can be taken to be near ∼35 km. For the NR, two threshold values (0.03 and 0.05 K) are plotted to illustrate the sensitivity of the results to the choice of threshold value. Since the number of events is dependent on the somewhat arbitrary choice of threshold value, the most important information that this plot reveals is that the July average number of wave events detected in the NR and AIRS have similar global patterns in the winter hemisphere. In the summer hemisphere, the differences are most likely due to time differences between the NR and AIRS sampling. As noted above, the NR brightness temperatures were interpolated spatially to the AIRS measurement locations. However, we chose not to interpolate in time to the AIRS measurements so as not to wash out the waves in the NR brightness temperatures. Since the timing of convection is so important for generating waves, the time differences between the NR and AIRS sampling most likely explain the differences in the summer hemisphere. The convective parametrization could also be important (Kim et al., 2007).
Figure 5.
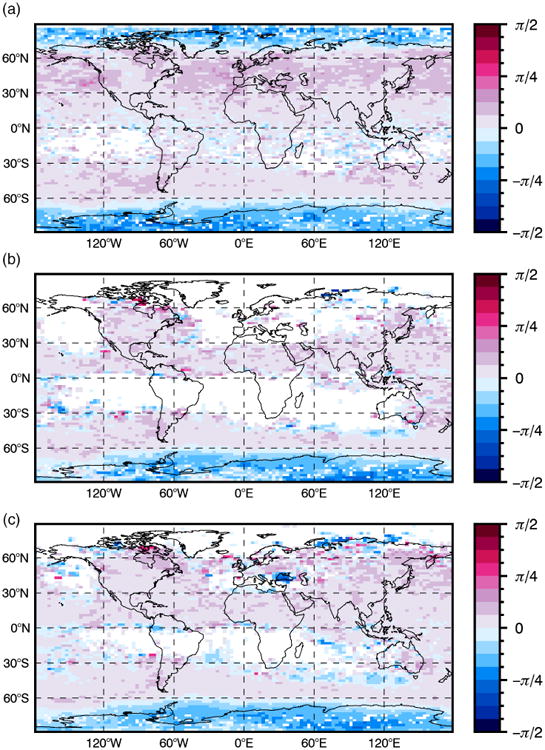
July average azimuth (rad) near ∼35 km for (a) AIRS and (b, c) the NR with detection thresholds (b) 0.05 K and (c) 0.03 K. White boxes indicate where not enough data were above the given threshold. Positive angles represent waves propagating northeast/southwest, while negative angles represent waves propagating southeast/northwest. [Colour figure can be viewed at wileyonlinelibrary.com].
Figure 3 shows the July average amplitudes near ∼35 km for AIRS and the NR. In general the global patterns agree well, with a band of larger-amplitude waves around 60°S and the largest-amplitude waves over the southern tip of South America and the Antarctic peninsula. However, the AIRS amplitudes are more evenly distributed over all longitudes whereas the NR amplitudes are more concentrated over the southern tip of South America and the Antarctic peninsula. Another significant difference between AIRS and the NR is that the average amplitudes in the NR are between ∼4 and 5 times smaller than the average amplitudes in the AIRS data. The average amplitude is not very sensitive to the NR threshold value in the Southern Hemisphere winter where the wave amplitudes are typically large.
The underestimation of observed GW amplitudes, and therefore momentum flux, is common in global climate simulations and has been shown previously for the high horizontal resolution NR (Holt et al., 2016) and other models. Holt et al. (2016) showed that NR-resolved GW drag in the Tropics in the quasi-biennial oscillation (QBO) region was too low compared to the zonal force required to drive the observed QBO (inferred from the MERRA-2 reanalysis). They attributed this to a combination of low vertical resolution and dissipation in the NR. Jewtoukoff et al. (2015) found a large discrepancy between the magnitude of momentum fluxes at 70 hPa derived from Concordiasi balloon observations and in the European Centre for Medium-range Weather Forecasts (ECMWF) model. The momentum fluxes in ECMWF were on average a factor of 5 smaller than the momentum fluxes derived from the balloon observations. They discussed the spectral truncation of ECMWF and numerical diffusion as possible reasons for the underestimate. The ECMWF analyses used by Jewtoukoff et al. (2015) had a horizontal resolution of about 16 km and vertical resolution of about 500 m, whereas the NR horizontal resolution is about 7 km and vertical resolution is between about 1 and 2 km in the stratosphere. Note also the different altitudes for the NR and ECMWF in this paragraph. The NR amplitudes are about a factor of 4–5 (a factor of 16–25 in momentum flux) lower than the AIRS amplitudes near 35 km, and ECMWF momentum fluxes are about a factor of 5 lower than the Concordiasi momentum fluxes near ∼19–20 km. In the next section, we will show that at ∼20 km, the NR is actually very similar to ECMWF in terms of the mean GW momentum flux.
Figure 4 shows the July average wavelengths for AIRS and the NR. AIRS wavelengths are on average about half the NR wavelengths. The global patterns are again similar, with smaller wavelengths over the southern tip of South America and the mountainous regions of Antarctica. As with amplitude, the average wavelength is also not very sensitive to the NR threshold, especially in the Southern Hemisphere. The larger average horizontal wavelengths in the NR than in AIRS reinforces the conclusions of Holt et al. (2016) that the smaller-scale GWs in the NR are under-represented due to either excess dissipation or low vertical resolution. Again, this problem is not unique to the NR and has been demonstrated in previous studies. For example, Preusse et al. (2014) showed that GW horizontal wavelengths in ECMWF were at least three times greater than those estimated from the High Resolution Dynamics Limb Sounder (HIRDLS) observations for convective GWs between 40°S and 40°N.
Figure 4.
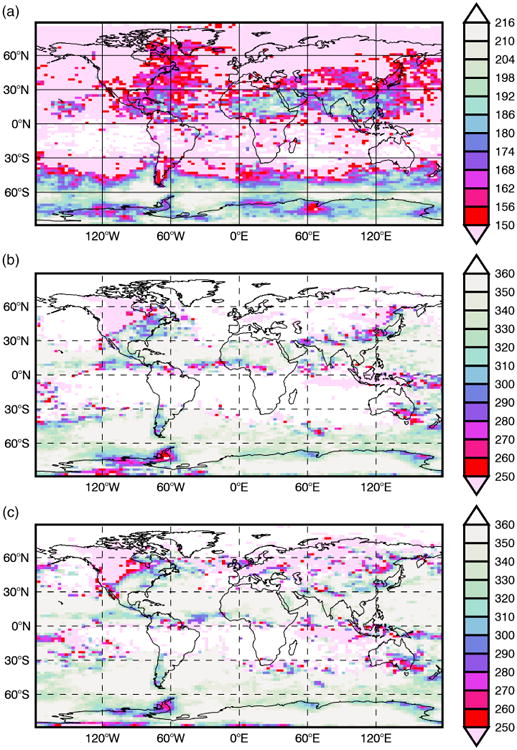
July average wavelength (km) near ∼35 km for (a) AIRS and (b, c) the NR with detection thresholds (b) 0.05 K and (c) 0.03 K. White boxes indicate where not enough data were above the given threshold. Note the different ranges on the colour bars; the NR range is 1.7 times the AIRS range. [Colour figure can be viewed at wileyonlinelibrary.com].
Figure 5 shows the July average propagation direction (azimuth) for AIRS and the NR. As mentioned above, the wave propagation direction has a 180-degree ambiguity. The waves in Figure 5 are propagating southwest/northeast for positive angles (0 < θ ≤ π/2) and northwest/southeast for negative angles (−π/2 ≤ θ < 0). In the Southern Hemisphere, the background winds are eastward in winter so we assume that the waves are propagating westward against the background wind. This means that waves with positive angles are propagating southwest and waves with negative angles are propagating northwest. Previous studies have shown that waves have a tendency to propagate into the winter jet (e.g. Sato et al, 2009), and both AIRS and the NR show waves propagating into the winter jet. Furthermore, NR propagation directions agree very well with AIRS.
3.2. Evaluation of NR absolute GW momentum flux
To further validate the NR GWs we calculated absolute GW momentum fluxes for comparison to Geller et al. (2013), which was the first international collaborative effort at direct comparisons of global GW momentum fluxes in observations and models. Because satellite methods only permitted estimates of the absolute values of momentum flux with no knowledge of direction, similar estimates of absolute momentum flux were computed and compared. Some of the models were high resolution, permitting an analysis of the resolved GWs. Others were coarse resolution, so the GW fluxes were obtained from the model parametrizations of GW drag.
We estimated the absolute GW momentum flux for resolved waves in the NR using wind and temperature quadratics (u′2, v′2, w′2, T′2) as in eq. (1) of Geller et al. (2013):
| (3) |
where
| (4) |
T0 and ρ0 are large-scale temperature and density, respectively. N is the Brunt–Väisälä frequency, f is the Coriolis parameter, ω̂ is the GW intrinsic frequency, and g is Earth's gravity. Primes denote variations smaller than this large scale, which is taken to be 1000 km. The large scale was approximated by a spherical harmonic series truncated at horizontal wavenumber n=40 with an exponential taper. The overbars denote averages over 10° lon×5° lat geographical bins. The terms in brackets on the right-hand side of Eq. (3) represent a low-frequency correction. However, the correction only changed the global mean absolute GW momentum flux by less than 3%.
Figure 6 shows the absolute GW momentum flux at ∼20 km for January 2006 of the NR and also for January 2006 of the CAM5 run presented in Geller et al. (2013) for comparison. Two CAM5 experiments were initialized on 1 June 2005 and run at ∼0.25° horizontal resolution with observed sea-surface temperatures for 18 months. Figure 6 shows the average of the two CAM5 runs. The absolute GW momentum fluxes for CAM5 were also calculated with Eq. (3). The NR and CAM5 have very similar global patterns of absolute GW momentum flux. In particular, both models have maxima over topographic features in the winter hemisphere. In the NR the largest maximum is over the Rocky Mountains, whereas the largest maximum in CAM5 is over the Tibetan Plateau. The NR global mean value is double the CAM5 global mean value. For comparison, the NR has roughly four times the number of horizontal grid points than the CAM5 simulation. The global mean momentum fluxes in the NR are between 2.4 and 3 times weaker than parametrized GWs in the coarse resolution models in the Geller et al. (2013) comparison.
Figure 7 shows the absolute GW momentum flux at ∼20km for July 2006 of the NR and also for July 2006 of the CAM5 run presented in Geller et al. (2013) for comparison. As for January, the NR and CAM5 have very similar global patterns of absolute GW momentum flux. In the winter hemisphere, both the NR and CAM5 have orographic maxima over the Antarctic Peninsula and the southern tip of South America. Both also show a large area of non-orographic flux over the Southern Ocean and into the Indian, South Atlantic, and South Pacific Oceans. In the summer hemisphere, the patterns of secondary maxima agree remarkably well.
Figure 7.

Monthly mean absolute gravity wave momentum fluxes at 20 km for (a) July 2006 of the CAM5 run presented in Geller et al. (2013) with global mean value 0.5 mPa, and (b) July 2006 of the NR with global mean value 1.3 mPa. [Colour figure can be viewed at wileyonlinelibrary.com].
The Geller et al. (2013) results showed large disparities among different observational estimates of the flux, and large differences between observations and models, which spoke to the remaining large uncertainty in the observational estimates. However, one surprising result was how three different climate models with six (two each, orographic and non-orographic) different GW parametrization methods all showed rather similar GW momentum fluxes. Since the different parametrization methods had all been tuned to give realistic simulations of the general circulation, perhaps in hindsight this result should not have been surprising. On the other hand, the resolved waves in two high-resolution models, while showing very similar global patterns both to each other and to the observations, had very different flux magnitudes. The CAM5, shown in our Figures 6 and 7, had the weakest fluxes among the models, and this is likely due to the very poor vertical resolution and higher dissipation. The other high-resolution model was Kanto (Watanabe et al., 2008), a spectral model with very high vertical resolution and minimal dissipation, and it showed the largest momentum fluxes among all of the models.
Table 1 lists the fluxes from the different models and observations in Geller et al. (2013) and the NR fluxes for January and July. The NR is between Kanto and CAM5 in terms of magnitude. While the NR has almost an order of magnitude higher horizontal grid-spacing than Kanto, Kanto has a much higher vertical grid-spacing and also very low dissipation at the smallest model scales (Watanabe et al., 2008). This most likely explains why the Kanto GW momentum flux is almost five times larger than the NR. The observational estimates are between 1.4 and 3.1 times larger than the NR. However, as noted above, the uncertainty in the satellite estimates is large, and previous studies have shown that satellite estimates tend to have a low bias (e.g. Ern et al., 2004). Therefore, the NR is most likely several factors too low compared to reality.
Table 1.
Global mean absolute gravity wave momentum fluxes (mPa) at 20 km for the NR and results from the different models (Kanto, CAM, GISS, ECHAM, HadGEM) and observations (HIRDLS1, HIRDLS2) in Geller et al. (2013).
| NR | Kanto | CAM | GISS | ECHAM | HadGEM | HIRDLS1 | HIRDLS2 | |
|---|---|---|---|---|---|---|---|---|
| January | 1.3 | 6.29 | 0.6 | 3.15 | 3.54 | 3.99 | 1.82 | 2.17 |
| July | 1.3 | 6.29 | 0.5 | 3.29 | 3.39 | 4.02 | 4.06 | 2.19 |
As mentioned above, Jewtoukoff et al. (2015, their Figure 1) compared gravity momentum fluxes from Concordiasi to those from ECMWF at ∼19–20 km for the Southern Hemisphere (poleward of ∼45°S), averaged over September 2010–January 2011. The mean momentum flux was 9 mPa for Concordiasi and 1.8 mPa for ECMWF. The NR mean momentum flux poleward of ∼45°S in July is 1.7 mPa, which is comparable to ECMWF. It is worth noting that for the NR we removed scales larger than ∼ 1000 km to obtain estimates of GW momentum flux, while Jewtoukoff et al. (2015) removed scales larger than ∼2667 km. So while the comparison here is not exact, since there are differences in time of year, slight differences in altitude, and differences in the background removal, it shows that the NR is similar to other global models.
The results of the comparison to AIRS in the previous section and the comparison to other models in this section show that the global patterns in GW properties are very realistic compared to observations, although like other global models the amplitudes are weaker and horizontal wavelengths longer than observed. However, the realism of the geographic variations in wave properties gives confidence that the wave sources and propagation are realistic in the NR.
3.3. Comparison of NR precipitation to GPM
Precipitating systems are a major source of GWs at mid to high latitudes (e.g. Choi and Chun, 2013). To evaluate NR precipitation in the Southern Hemisphere winter, Figure 8 compares NR precipitation to precipitation retrievals from the Global Precipitation Measurement (GPM; Hou et al., 2014) Core Observatory. GPM Core Observatory extends the coverage of precipitation measurements to higher latitudes (∼ 65°S–65°N). We have used precipitation rates derived from the 13.6 GHz Ku-band precipitation radar reflectivity at pixel level with ∼5km resolution (Seto et al., 2013) for this comparison. Figure 8 shows the precipitation PDFs for both orographic and non-orographic regions between 66° and 15°S for precipitation rates between 10 and 100 mm h−1. Here we have used precipitation rate squared on the x-axis since precipitation is proportional to latent heating, and latent heating squared is proportional to momentum flux (e.g. Beres et al., 2004). Orographic and non-orographic regions are defined in Figure 9. In general, the NR decently reproduces occurrences of precipitation rates below 20 mm h−1 (Figure 8(a)). However, it significantly underestimates precipitation rates above 30 mm h−1 over orographic regions (Figure 8(b)). Over non-orographic regions, the NR shows good agreement with GPM over both the low and high precipitation rates. This is especially relevant as we explore non-orographic GW sources in the next section.
Figure 8.
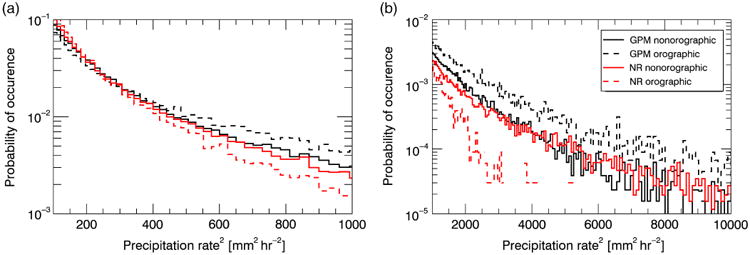
July precipitation PDFs for the NR and GPM for both orographic and non-orographic regions between ∼ 65° S and 15°S for precipitation rates (a) between 10 and ∼31.6 mm h−1 and (b) between ∼31.6 and 100 mm h−1. GPM Ku near-surface precipitation rates for July 2014 and 2015 were used to calculate the GPM PDFs. NR July 2015 surface precipitation rates were used to calculate the NR PDFs. Orographic and non-orographic are defined in Figure 9. [Colour figure can be viewed at wileyonlinelibrary.com].
Figure 9.
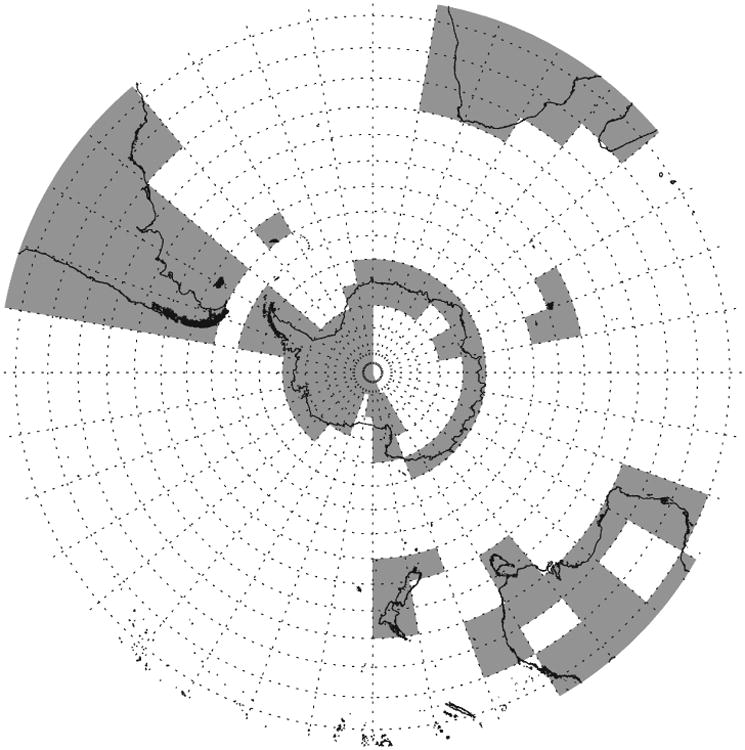
Orographic (grey) and non-orographic (white) bins based on the GLOBE dataset.
Figure 9 shows the geographical bins flagged as orographic (grey) based on the Global Land One-kilometre Base Elevation (GLOBE) dataset (Hastings and Dunbar, 1999). We followed the method for flagging orographic bins used by Vincent et al. (2007): we first computed the gradient of the GLOBE elevation dataset at the 1 km resolution. Then the mean of the 10% largest gradients were calculated for each 10° lon×5° lat bin. Finally, bins were flagged as orographic when this value exceeded 15 m km−1. Additionally, some bins that are located in the lee of major orography (e.g. east of the Antarctic peninsula) were also flagged as orographic. This categorization of geographical bins into orographic and non-orographic is of course a simplification. In reality, non-orographic waves can be generated anywhere. For example, Argentina has the most intense thunderstorms on Earth (Zipser et al., 2006), and their wave contribution is misclassified here. Many of the non-orographic bins also contain small islands. However, even with these caveats, we chose to use the classification of orographic and non-orographic in Figure 9 because it allows us to compare the NR to previous work (Vincent et al., 2007; Hertzog et al., 2008; Jewtoukoff et al., 2015).
4. Non-orographic GW sources in the Southern Hemisphere in the NR
The results of section 3 suggest that the global variations in GWs are quite realistic compared to observations and that non-orographic precipitation is also realistic compared to observations. To understand how non-orographic sources of GWs (convection and fronts in the troposphere) are contributing to the absolute GW momentum flux in the lower stratosphere, in this section we investigate the relationship between precipitation and frontogenesis in the troposphere and absolute GW momentum flux in the lower stratosphere in the NR for the Southern Hemisphere winter. The Southern Hemisphere winter stratosphere is the locus of larger than average climate model biases in wind and temperature (Butchart et al., 2011; McLandress et al., 2012) with important implications for modelling ozone chemistry. Because of limited land areas, the Southern Hemisphere is also a region of particular interest in understanding non-orographic GW sources (Hertzog et al., 2008; de la Cámara et al., 2014; Plougonven et al., 2017).
Although the validation in section 3 showed the total fluxes in the NR are likely weaker than in nature, the realism of a model like the NR with resolved sources and waves permits an examination of the relative contributions of different sources. Figure 10 shows absolute GW momentum flux in the lower stratosphere (∼15 km) for two Southern Hemisphere winter days in 2005 with proxies for non-orographic wave generation in the troposphere by convection and fronts. We chose precipitation rate and the frontogenesis function as our indicators of tropospheric wave generation. Precipitation rates are related to the strength and depth of moist convection, which is an important generation mechanism of GWs in the troposphere (e.g. Alexander et al., 1995). Fronts are also known to be a major source of GWs (Eckermann and Vincent, 1993; Plougonven and Snyder, 2007).
Figure 10.
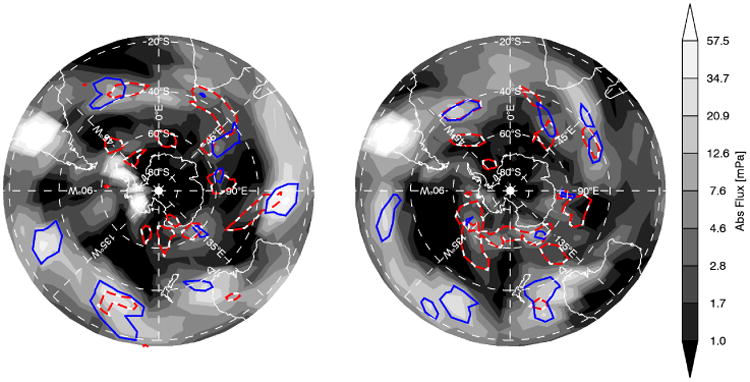
Absolute gravity wave momentum fluxes (grey shading) for two days from JJA 2005 at ∼15 km: (a) 0000 UTC on 17 June and (b) 0000 UTC on 14 July 2005. The solid line is the 0.4 mm h−1 precipitation rate contour, and the dashed line is the 0.05 K2(100 km)−2h−1 frontogenesis function contour. [Colour figure can be viewed at wileyonlinelibrary.com].
The absolute GW momentum flux near 15 km was computed as before with Eq. (3) and binned to 10° lon×5° lat. We chose 15 km for the GW momentum flux because it is above the level of GW sources yet low enough that a significant portion of the waves will still be present. For the precipitation rate, we averaged the 0.0625° surface precipitation in each 10° lon×5° lat bin. The precipitation threshold shown in Figure 10 (the thick solid contour) is 0.4 mm h−1. The threshold is shown only for non-orographic regions (as defined in Figure 9). The frontogenesis function at ∼800 hPa was computed via eq. 2.1 in Charron and Manzini (2002):
| (5) |
where θ is potential temperature, u is the zonal wind, v is the meridional wind, λ is longitude, ϕ is latitude, and θ, u, and v are the large-scale fields (> 1000 km here). The large-scale θ, u, and v were approximated by a spherical harmonic series truncated at horizontal wavenumber n=40 with an exponential taper. Since only coarse resolution fields were needed to compute the frontogenesis function, we used the 0.5° variables for this calculation. After the frontogenesis function was computed, it was binned to 10° lon × 5° lat. Several of the GW parametrizations that tie GWs to sources via frontogenesis use a threshold value (e.g. Charron and Manzini, 2002; Richter et al, 2010), although some do not (de la Cámara and Lott, 2015). For the ones that do rely on a threshold, GWs are launched when the frontogenesis function exceeds the threshold. The value is typically somewhere between 0.045 and 0.1 K2(100 km)−2h−1 (Griffiths and Reeder, 1996; Charron and Manzini, 2002; Richter et al., 2010). We chose a conservative value of 0.05 K2 (100 km)−2 h−1, which is shown in Figure 10 with the dashed contours for non-orographic regions.
In general the GW momentum flux maxima (where the value for a bin is larger than all surrounding bins) are located inside the precipitation and frontogenesis contours (areas with high precipitation and frontogenesis). Sometimes the precipitation and frontogenesis maxima coincide, but this is not always the case. The precipitation maxima are located predominantly between 20° and 40° S, and the frontogenesis maxima are mostly located at the higher latitudes. To evaluate the relationship between absolute GW momentum flux in the lower stratosphere and precipitation and frontogenesis in the troposphere, we computed Spearman's rank correlation coefficient between precipitation and absolute GW momentum flux and between the frontogenesis function and absolute GW momentum flux for each geographical bin for JJA 2005. Spearman's rank correlation coefficient essentially measures the degree of monotonic relationship between two variables. We chose this method of correlation over Pearson's correlation coefficient because it does not require a linear relationship between the two variables. Visual inspection of the data revealed that a clear relationship between precipitation and GW momentum flux emerges beyond precipitation values of ∼0.1 mm h−1. However, the relationship between the frontogenesis function and absolute GW momentum flux is not nearly as robust as the relationship between precipitation rate and absolute GW momentum flux. There is only a weak relationship between absolute GW momentum flux and the frontogenesis function and only beyond values of ∼0.05 K2(100 km)−2h−1. Unfortunately, this excluded a large proportion of the data from the calculation of the correlation between the frontogenesis function and absolute GW momentum flux.
Figure 11 shows Spearman's rank correlation coefficient (for each non-orographic geographical bin) between absolute GW momentum flux and precipitation for precipitation rates higher than 0.1 mm h−1. The higher correlations are located between 20° and 50°S, with the highest values located between 20° and 40°S in the South Pacific. This region is also the region with the most incidences of precipitation rates exceeding 10 mm h−1. These larger and more intermittent precipitation rates are associated with more intense latent heating which generates larger-amplitude GWs.
Figure 11.
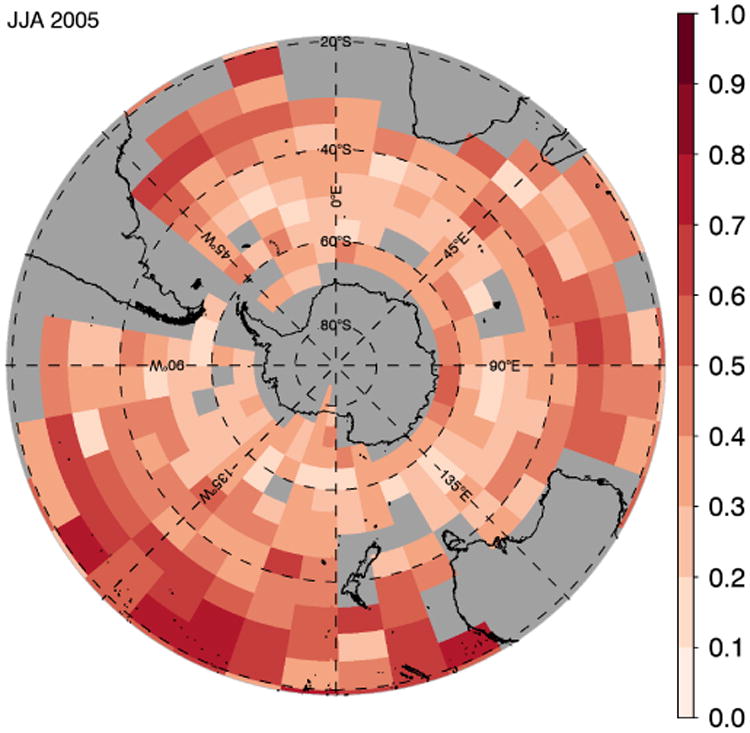
Spearman's rank correlation coefficient between precipitation and absolute gravity wave momentum flux for values of precipitation higher than 0.1 mm h−1. Grey areas are either bins flagged as orographic, bins for which the correlation was not significant, or bins for which there were less than 10 data points. [Colour figure can be viewed at wileyonlinelibrary.com].
Figure 12 shows Spearman's rank correlation coefficient (for each non-orographic geographical bin) between absolute GW momentum flux and the frontogenesis function for frontogenesis function values higher than 0.05K2(100 km)−2h−1. There are a large number of grey geographical bins in Figure 12 because there are not many bins with more than 10 data points with a frontogenesis function value higher than 0.05 K2(100 km)−2h−1. Again, this threshold was chosen based on a visual inspection of the data. The correlation coefficients in Figure 12 are much lower than the values in Figure 11, except for a few bins in the South Pacific where there is a band of higher correlations between 20° and 40°S and between 95°W and 135°W. In general, the relationship between absolute GW momentum flux and the frontogenesis function is less straightforward than the relationship between absolute GW momentum flux and precipitation, which is reflected in Figure 12.
Figure 12.
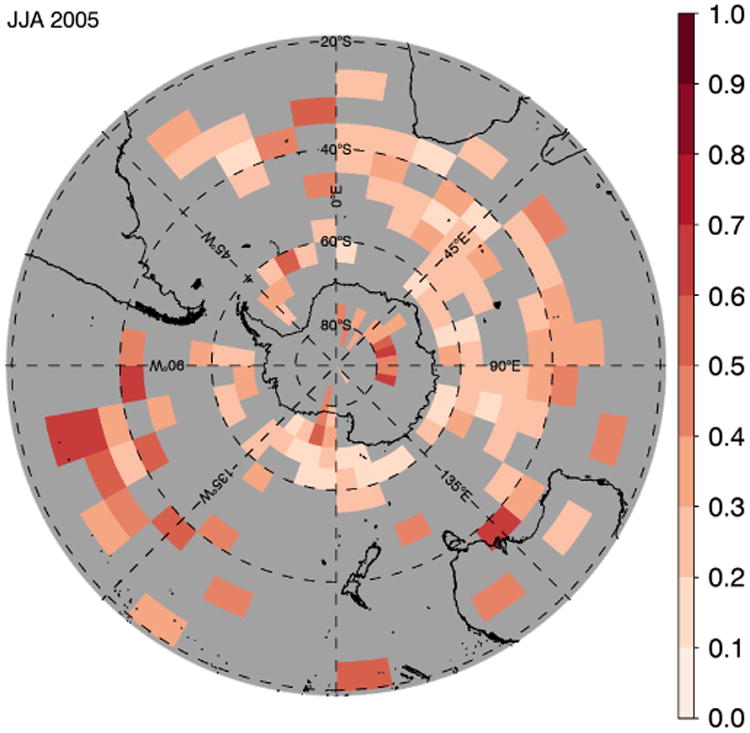
Spearman's rank correlation coefficient between the frontogenesis function and absolute gravity wave momentum flux for values of the frontogenesis function higher than 0.05 K2(100 km)−2h−1. Grey areas are either bins flagged as orographic, bins for which the correlation was not significant, or bins for which there were less than 10 data points. [Colour figure can be viewed at wileyonlinelibrary.com].
Figure 13 shows the NR JJA 2005 average absolute GW momentum flux in the lower stratosphere (∼15 km), with the JJA averages of the proxies for non-orographic wave generation in the troposphere by convection, and fronts also shown by the thick solid (precipitation) and dashed (frontogenesis) lines. Frontogenesis and precipitation are shown for non-orographic regions only. The colour bar range was chosen to highlight the non-orographic GW momentum flux, which is why the plot is saturated over orographic regions. Note that, since these are JJA averages, the values highlighted by the precipitation and frontogenesis contours are lower than the threshold values in Figure 10. Also shown in Figure 13 is where the highest precipitation rates are most common. This is highlighted by the dotted-dashed line, which indicates where the precipitation rate exceeds 10 mm h−1 most frequently. Precipitation rates above 10 mm h−1 are rare, but they are associated with strong latent heating that generates large-amplitude GWs.
Figure 13.
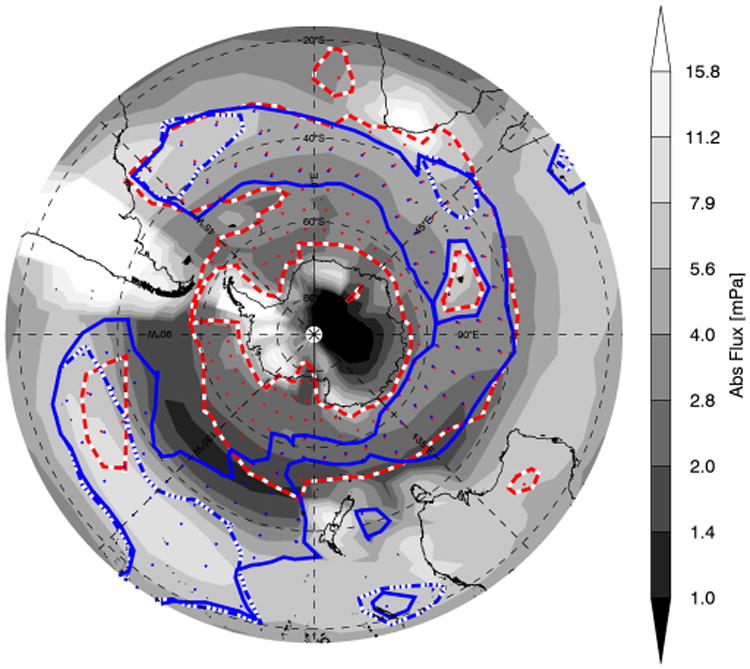
NR JJA average absolute momentum flux at ∼15km. The solid line is the 0.13 mm h−1 precipitation rate contour, and the dashed line is the 0.015 K2 (100, km)−2h−1 frontogenesis function contour. The dotted-dashed contour indicates where the precipitation rate exceeds 10 mm h−1 for 0.2% of the time. Stippling is on the inside of the contours. [Colour figure can be viewed at wileyonlinelibrary.com].
In general Figure 13 reflects the patterns shown in Figures 11 and 12. Precipitation especially and fronts to some extent are relevant for GW momentum flux in the South Pacific between 20° and 40°S. This coincides with the region where the non-orographic absolute GW momentum flux is the highest. This area also contains a larger proportion of higher precipitation rates. In other words, the highest correlations in Figure 11 are located where the precipitation rate most frequently exceeds 10 mm h−1. Both fronts and precipitation are also correlated with GW momentum flux at higher latitudes between 30 and 80°S and at most longitudes, but the correlations and absolute GW momentum flux are both lower than for the South Pacific region. Additionally, Figure 13 shows that on average fronts and precipitation are fairly well correlated, especially for the areas where the precipitation rates are not likely to exceed 10 mm h−1.
The overall shape of the average precipitation rate and frontogenesis function are similar to other average measures of tropospheric wave generation. For example, Hendricks et al. (2014; their Figure 3) shows the maximum Eady growth rate at 525 hPa averaged over 20 years of ERA-Interim data. It shows two prominent zonally elongated strips: one centred around 30°S that extends from approximately 90°W westward to 90°E and one starting at around 50°S near the eastern coast of South America that spirals poleward and eastward, almost reaching the Antarctic Peninsula in August. The main difference compared to the proxies used here is that the lower-latitude maxima in the proxies in Figure 13 have a much smaller zonal extent, i.e. the proxies in Figure 13 around 30°S are not above the chosen threshold levels between 90° and 180°E.
Figure 14 shows the non-orographic zonal mean variables in Figure 13 as a function of latitude. The non-orographic GW momentum flux has a maximum peak near 30°S. This peak is highly associated with the peak in intermittent precipitation (the dashed line in (b)). The GWs associated with this peak have large amplitudes and break in the lower stratosphere. Supporting this is that at ∼20 km the GW momentum flux peak near 30°S is greatly diminished (shown in grey), indicating that these GWs have already deposited their momentum. A smaller peak in GW momentum flux is located around 60°S and is more clearly associated with the peak in frontogenesis and average precipitation rate. The GWs associated with the 60°S peak are smaller in amplitude than those associated with the peak at 30°S, inferred by the fact that the 60° S peak is only diminished by about a factor of 2 at ∼20 km.
Figure 14.
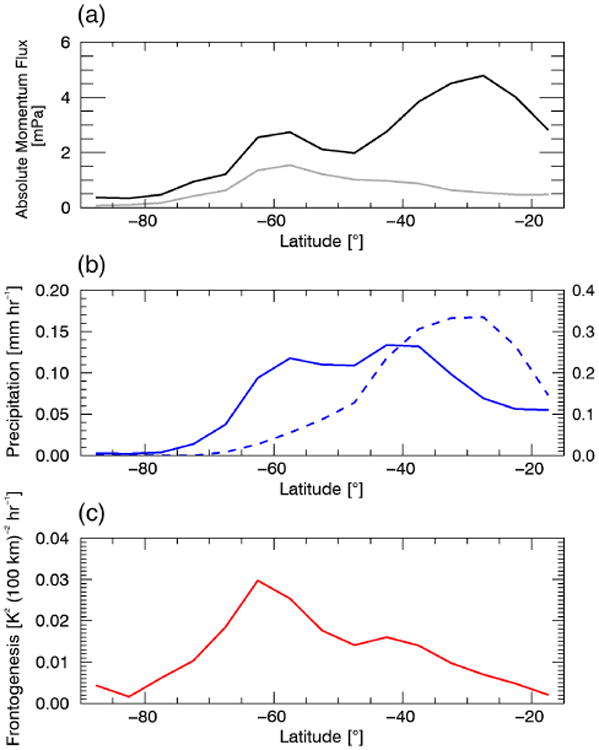
NR JJA average, zonal mean (a) non-orographic absolute gravity wave momentum flux at ∼15 km (black) and ∼20 km (grey), (b) precipitation rate, and (c) the frontogenesis function. The dashed contour in (b) indicates the percentage of time that the precipitation rate exceeds 10 mm h−1, using the axis on the right. [Colour figure can be viewed at wileyonlinelibrary.com].
5. Non-orographic versus orographic GWs
In Figure 13, the largest momentum fluxes are located over the Andes and the Antarctic Peninsula. However there are also large regions of elevated flux over the Southern Pacific between 20° and 40°S and near 40°S between 45°W and 90°E. These absolute values of momentum flux are not nearly as high as the orographic fluxes, but they extend over much larger geographical areas. In this section we examine the contribution to the zonal mean absolute GW momentum flux over both orographic and non-orographic regions (defined in Figure 9).
Figure 15 shows the NR zonal mean of the absolute momentum flux as a function of latitude for all GWs, as well as the orographic and non-orographic GW contribution to the total. The zonal mean absolute GW momentum flux has two peaks: a high-latitude peak between 70 and 75° S and a lower-latitude peak between 25 and 30°S. The high-latitude peak is dominated by orographic GWs, while the lower-latitude peak is split between orographic and non-orographic GWs. Although absolute momentum fluxes from orographic GWs greatly exceed those of non-orographic GWs locally, the total area of the orographic GW generation is much smaller than that of non-orographic waves so that the non-orographic GWs contribute a third of the total absolute GW momentum flux for the lower latitude peak.
Figure 15.
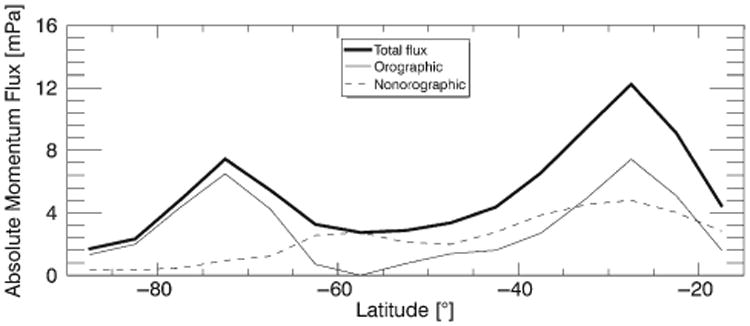
NR zonal mean absolute momentum flux near 15 km as a function of southern latitude for all waves < 1000 km (thick solid line), orographic waves (thin solid line), and non-orographic waves (dashed line).
The shapes of the lines agree well with Concordiasi observations at latitudes poleward of 50°S at 70 hPa (∼20 km) (figure 11(a) of Jewtoukoff et al., 2015), but the magnitude of the NR peak near 20 km is a factor of 3 too small for the orographic contribution and between a factor of 6 and 10 too small for the non-orographic contribution (again, related to excessive dissipation). ECMWF is also shown in figure 11 of Jewtoukoff et al. (2015) and also has a very similar shape, but the orographic contribution is about a factor of 7 smaller and the non-orographic contribution about a factor of 5 smaller than Concordiasi. As mentioned in section 3.2, Jewtoukoff et al. (2015) removed scales larger than ∼2667 km, whereas we removed scales larger than ∼1000 km. This should be taken into consideration when comparing the values of momentum flux. If waves between 1000 and 2667 km were included in the NR GW momentum flux, the values would be closer to the Concordiasi values than they currently are. We estimated this difference by including scales up to ∼2667 km (horizontal wavenumber 15) for one NR sample from JJA (0000 UTC on 01 August), and the peak in momentum flux near 60°S increased from ∼1.7 to ∼8.1 mPa. This is an increase by a factor of about 4.7 and suggests that the NR would be closer to a factor of 2 less than Concordiasi instead of 6–10. The shapes of the lines and magnitudes in Figure 15 also agree well with the July zonal mean GW (≲ 1900 km) momentum flux in Kanto (figure 8(d) of Alexander et al., 2016), for both orographic and non-orographic waves.
Figure 16 shows the PDFs of the JJA absolute momentum flux for orographic and non-orographic waves, where orographic and non-orographic areas are defined in Figure 9. The thin solid lines show the theoretical log-normal distribution with the mean and standard deviation of the absolute GW momentum fluxes. The shapes of both orographic and non-orographic PDFs agree well with those shown previously for both balloons and models (e.g. Hertzog et al., 2012; Wright et al., 2013; Jewtoukoff et al., 2015). The PDFs are very similar to those from high-resolution (0.125° × 0.125°) ECMWF operational analyses (figure 2(b) of Jewtoukoff et al., 2015).
Figure 16.
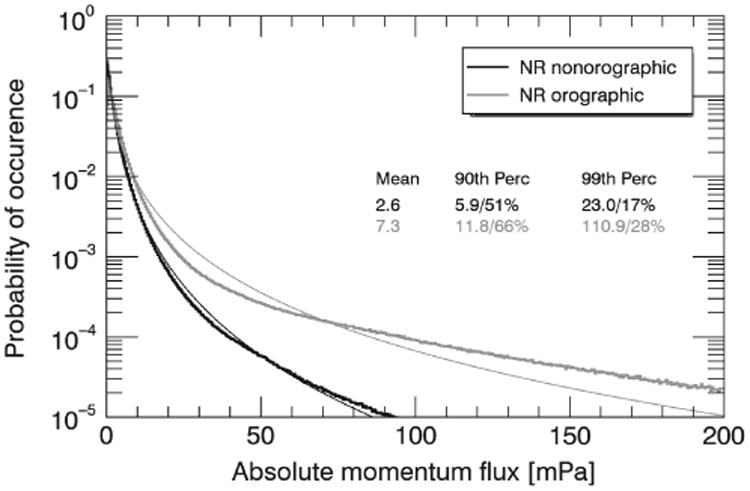
NR JJA PDFs of absolute momentum flux for nonorographic regions (black) and orographic regions (grey). The thin solid lines show the theoretical log-normal distributions with the same mean and standard deviation as the modelled PDFs. Also shown on the plot are the mean and the 90th and 99th percentile values for each region.
Both orographic and non-orographic GW momentum flux PDFs have long tails, and the orographic PDF has a particularly long tail. The lower absolute momentum fluxes are due to smaller-amplitude GWs that occur frequently, and the higher absolute GW momentum fluxes are due to larger-amplitude GWs that occur intermittently. The long tails of the distributions are reflected in the proportion of the total absolute momentum flux that is above 90th and 99th percentiles. For non-orographic GWs, 51% and 17% of the total absolute GW momentum flux is attributed to fluxes above the 90th and 99th percentiles, respectively. For orographic GWs an even larger proportion is concentrated in the tail of the distribution, and values above the 90th and 99th percentiles account for 66% and 28% of the total absolute GW momentum flux, respectively. Table 2 compares previous estimates of intermittency from various model and observational studies at various altitudes to those for the NR. All of the estimates have long tails, and the NR falls within the range of previous estimates for the 90th percentile for both orographic and non-orographic regions. For the 99th percentile, the NR has a slightly longer tail than previous estimates for both orographic and non-orographic regions. This could be because the NR estimates are at a slightly lower altitude than the other estimates.
Table 2.
Estimates of intermittency from previous studies compared to the NR. Percentage of data above the 90th and 99th percentiles–a measure of how long the tails of the distributions are.
| 90th percentile | 99th percentile | |||
|---|---|---|---|---|
|
|
|
|||
| O (%) | NO (%) | O (%) | NO (%) | |
| NR (15 km) | 66 | 51 | 28 | 17 |
| Concordiasi (70 hPa; Jewtoukoff et al., 2015) | 64 | 29 | – | – |
| ECMWF (70hPa; Jewtoukoff et al., 2015) | 72 | 43 | – | – |
| Vorcore (17–19 km; Hertzog et al., 2012) | 55 | 35 | 26 | 8 |
| WRF (17 km; Hertzog et al., 2012) | 58 | 46 | 21 | 13 |
| HIRDLS (25 km; Wright et al., 2013) | 63 | 56 | 22 | 15 |
O=Orographic; NO=Non-orographic
6. Summary and conclusions
In this paper we have evaluated GWs in the Southern Hemisphere winter in the high-resolution GEOS-5 NR by comparing brightness temperature anomalies in the NR to those in AIRS. Qualitatively the brightness temperature anomalies in the NR and AIRS have very similar global patterns, although the NR amplitudes are smaller than AIRS amplitudes. With the brightness temperature anomalies we then computed amplitudes, wavelengths, and propagation direction for both the NR and AIRS. Like other global models, the NR GW amplitudes are smaller and horizontal wavelengths are longer than observed, which we attributed to excessive model dissipation. The propagation direction in the NR looks quite good compared to AIRS: both the NR and AIRS show propagation into the Southern Hemisphere winter jet.
Next we computed the absolute GW momentum flux for the NR, and compared the absolute GW momentum flux at 20 km to CAM5 for January and July. The NR and CAM5 have very similar global patterns of absolute GW momentum flux, and the NR has a global mean value that is roughly double the CAM5 global mean. As a third evaluation of the NR, we compared precipitation rate occurrence frequencies to those from GPM. The NR non-orographic precipitation PDF compares very well with that from GPM, while the NR orographic precipitation rate occurrence frequency is considerably lower than GPM, especially at the highest precipitation rates. Taken together, these comparisons suggest that while the GWs in the NR have weaker amplitudes and longer horizontal scales than observed, the geographic variations in GWs are quite realistic, and the non-orographic GW sources are also realistically represented.
We further tied the absolute GW momentum flux in the lower stratosphere to proxies of tropospheric non-orographic GW generation: precipitation and frontogenesis. We found that intermittent precipitation is associated with absolute GW momentum flux, especially in the South Pacific between 20° and 40° S. This area has the largest percentage of high precipitation rates (exceeding 10 mm h−1). The GWs associated with this momentum flux peak have larger amplitudes and break below 20 km. Frontogenesis and less intermittent precipitation rates are associated with GW momentum flux, especially at higher latitudes near ∼60°S and with smaller amplitude waves that deposit their momentum mostly above 20 km.
Finally, we compared the orographic and non-orographic contributions to the absolute GW momentum flux in the NR. We found that orographic GWs dominate a peak in zonal mean GW momentum flux at high latitudes, and non-orographic waves contribute a third to the lower-latitude peak in zonal mean momentum flux. The PDFs of absolute momentum flux and precipitation both have long tails characteristic of the highly intermittent nature of large-amplitude GWs. These large-amplitude GWs break in the lower stratosphere, and are very important for the momentum budget there.
Acknowledgments
This work is funded by the NASA Global Modeling and Assimilation Office, grant NNX14O76G and the National Science Foundation, award 1519271. This work was also supported by NASA's Modeling, Analysis and Prediction (MAP) program.
References
- Alexander MJ, Barnet C. Using satellite observations to constrain parameterizations of gravity wave effects for global models. J Atmos Sci. 2007;64:1652–1665. https://doi.org/10.1175/JAS3897.1. [Google Scholar]
- Alexander MJ, Teitelbaum H. Observation and analysis of a large amplitude mountain wave event over the Antarctic Peninsula. J Geophys Res. 2007;112:D21103. https://doi.org/10.1029/2006JD008368. [Google Scholar]
- Alexander MJ, Holton JR, Durran DR. The gravity wave response above deep convection in a squall line simulation. J Atmos Sci. 1995;52:2212–2226. [Google Scholar]
- Alexander MJ, Geller M, McLandress C, Polavarapu S, Preusse P, Sassi F, Sato K, Eckermann SD, Ern M, Hertzog A, Kawatani Y, Pulido M, Shaw TA, Sigmond M, Vincent R, Watanabe S. Recent developments in gravity-wave effects in climate models and the global distribution of gravity-wave momentum flux from observations and models. Q J R Meteorol Soc. 2010;136:1103–1124. https://doi.org/10.1002/qj.637. [Google Scholar]
- Alexander SP, Sato K, Watanabe S, Kawatani Y, Murphy DJ. Southern Hemisphere extratropical gravity wave sources and intermittency revealed by a middle-atmosphere general circulation model. J Atmos Sci. 2016;73:1335–1349. https://doi.org/10.1175/JAS-D-15-0149.1. [Google Scholar]
- Beres JH, Alexander MJ, Holton JR. A method of specifying the gravity wave spectrum above convection based on latent heating properties and background wind. J Atmos Sci. 2004;61:324–337. [Google Scholar]
- Beres JH, Garcia RR, Boville BA, Sassi F. Implementation of a gravity wave source spectrum parameterization dependent on the properties of convection in the Whole Atmosphere Community Climate Model. J Geophys Res. 2005;110:D10108. https://doi.org/10.1029/2004JD005504. [Google Scholar]
- Butchart N, Charlton-Perez AJ, Cionni I, Hardiman SC, Haynes PH, Krüger K, Kushner PJ, Newman PA, Osprey SM, Perlwitz J, Sigmond M, Wang L, Akiyoshi H, Austin J, Bekki S, Baumgaertner A, Braesicke P, Brühl C, Chipperfield M, Dameris M, Dhomse S, Eyring V, Garcia R, Garny H, Jöckel P, Lararque JF, Marchand M, Michou M, Morgenstern O, Nakamura T, Pawson S, Plummer D, Pyle J, Rozanov E, Scinocca J, Shepherd TG, Shibata K, Smale D, Teyssèdre H, Tian W, Waugh D, Yamashita Y. Multimodel climate and variability of the stratosphere. J Geophys Res. 2011;116:D05102. https://doi.org/10.1029/2010JD014995. [Google Scholar]
- Charron M, Manzini E. Gravity waves from fronts: Parameterization and middle atmosphere response in a general circulation model. J Atmos Sci. 2002;59:923–941. https://doi.org/10.1175/1520-0469(2002)0590923:GWFFPA2.0.CO;2. [Google Scholar]
- Choi HJ, Chun HY. Effects of convective gravity wave drag in the Southern Hemisphere winter stratosphere. J Atmos Sci. 2013;70:2120–2136. https://doi.org/10.1175/JAS-D-12-0238.1. [Google Scholar]
- de la Cámara A, Lott F, Hertzog A. Intermittency in a stochastic parameterization of non-orographic gravity waves. J Geophys Res Atmos. 2014;119:11905–11919. https://doi.org/10.1002/2014JD022002. [Google Scholar]
- de la Cámara A, Lott F. A parameterization of gravity waves emitted by fronts and jets. Geophys Res Lett. 2015;42:2071–2078. https://doi.org/10.1002/2015GL063298. [Google Scholar]
- Eckermann SD, Vincent RA. VHF radar observations of gravity-wave production by cold fronts over Southern Australia. J Atmos Sci. 1993;50:785–806. [Google Scholar]
- Ern M, Preusse P, Alexander MJ, Warner CD. Absolute values of gravity wave momentum flux derived from satellite data. J Geophys Res. 2004;109:D20103. https://doi.org/10.1029/2004JD004752. [Google Scholar]
- Ern M, Hoffmann L, Preusse P. Directional gravity wave momentum fluxes in the stratosphere derived from high-resolution AIRS temperature data. Geophys Res Lett. 2017;44:475–485. https://doi.org/10.1002/2016GL072007. [Google Scholar]
- Garcia RR, Boville BA. Downward control of the mean meridional circulation and temperature distribution of the polar winter stratosphere. J Atmos Sci. 1994;51:2238–2245. [Google Scholar]
- Gelaro R, Putman WM, Pawson S, Draper C, Molod A, Norris PM, Ott L, Privé N, Reale O, Achuthavavier D, Bosilovich M, Buchard V, Chao W, Coy L, Cullather R, da Silva A, Darmenov A, Errico RM, Fuentes M, Kim MJ, Koster R, McCarty W, Nattala J, Partyka G, Schubert S, Vernieres G, Vikhliaev Y, Wargan K. Technical Report Series on Global Modeling and Data Assimilation. Vol. 36. NASA, Goddard Space Flight Center; Greenbelt, MD: 2015. Evaluation of the 7 km GEOS-5 nature run. NASA/TM-2014-104606. [Google Scholar]
- Geller MA, Alexander MJ, Love PT, Bacmeister J, Ern M, Hertzog A, Manzini E, Preusse P, Sato K, Scaife AA, Zhou T. A comparison between gravity wave momentum fluxes in observations and climate models. J Clim. 2013;26:6383–6405. https://doi.org/10.1175/JCLI-D-12-00545.1. [Google Scholar]
- Gong J, Wu DL, Eckermann SD. Gravity wave variances and propagation derived from AIRS radiances. Atmos Chem Phys. 2012;12:1701–1720. [Google Scholar]
- Griffiths M, Reeder MJ. Stratospheric inertia-gravity waves generated in a numerical model of frontogenesis. I: Model solutions Q J R Meteorol Soc. 1996;122:1153–1174. [Google Scholar]
- Hastings DA, Dunbar PK. Global Land One-kilometer Base Elevation (Globe) Digital Elevation Model, Documentation, Volume 1.0. Key to Geophysical Records Documentation (KGRD) 34. National Oceanic and Atmospheric Administration, National Geophysical Data Center; Boulder, CO: 1999. [Google Scholar]
- Hendricks EA, Doyle JD, Eckermann SD, Jiang Q, Reinecke PA. What is the source of the stratospheric gravity wave belt in Austral winter? J Atmos Sci. 2014;71:1583–1592. https://doi.org/10.1175/JAS-D-13-0332.1. [Google Scholar]
- Hertzog A, Boccara G, Vincent RA, Vial F, Cocquerez P. Estimation of gravity wave momentum flux and phase speeds from quasi-Lagrangian stratospheric balloon flights Part II: Results from the Vorcore campaign in Antarctica. J Atmos Sci. 2008;65:3056–3070. https://doi.org/10.1175/2008JAS2710.1. [Google Scholar]
- Hertzog A, Alexander MJ, Plougonven R. On the intermittency of gravity wave momentum flux in the stratosphere. J Atmos Sci. 2012;69:3433–3448. https://doi.org/10.1175/JAS-D-12-09.1. [Google Scholar]
- Hoffmann L, Alexander MJ. Occurrence frequency of convective gravity waves during the North American thunderstorm season. J Geophys Res. 2010;115:D20111. https://doi.org/10.1029/2010JD014401. [Google Scholar]
- Hoffmann L, Xue X, Alexander MJ. A global view of stratospheric gravity wave hotspots located with Atmospheric Infrared Sounder observations. J Geophys Res. 2013;118:416–434. https://doi.org/10.1029/2012JD018658. [Google Scholar]
- Hoffmann L, Alexander MJ, Clerbaux C, Grimsdell AW, Meyer CI, Rössler T, Tournier B. Intercomparison of stratospheric gravity wave observations with AIRS and IASI. Atmos Meas Tech. 2014;7:4517–4537. [Google Scholar]
- Hoffmann L, Spang R, Orr A, Alexander MJ, Holt LA, Stein O. A decadal satellite record of gravity wave activity in the lower stratosphere to study polar stratospheric cloud formation. Atmos Chem Phys Discuss. 2016;17:2901–2920. https://doi.org/10.5194/acp-2016-757. [Google Scholar]
- Holt LA, Alexander MJ, Coy L, Molod A, Putman WM, Pawson S. Tropical waves and the quasi-biennial oscillation in a 7 km global climate simulation. J Atmos Sci. 2016;73:3771–3783. https://doi.org/10.1175/JAS-D-15-0350.1. [Google Scholar]
- Hou AY, Kakar RK, Neeck S, Azarbarzin AA, Kummerow CD, Kojima M, Oki R, Nakamura K, Iguchi T. The global precipitation measurement mission. Bull Am Meteorol Soc. 2014;95:701–722. https://doi.org/10.1175/BAMS-D-13-00164.1. [Google Scholar]
- Jewtoukoff V, Hertzog A, Pougonven R. Comparison of gravity waves in the Southern Hemisphere derived from balloon observations and the ECMWF analyses. J Atmos Sci. 2015;72:3449–3468. https://doi.org/10.1175/JAS-D-14-0324.1. [Google Scholar]
- Kim SY, Chun HY, Baik JJ. Sensitivity of typhoon-induced gravity waves to cumulus parameterizations. Geophys Res Lett. 2007;34:L15814. https://doi.org/10.1029/2007GL030592. [Google Scholar]
- Lin SJ. A ‘vertically Lagrangian’ finite-volume dynamical core for global models. Mon Weather Rev. 2004;132:2293–2307. [Google Scholar]
- McFarlane NA. The effect of orographically excited gravity wave drag on the general circulation of the lower stratosphere and troposphere. J Atmos Sci. 1987;44:1775–1800. [Google Scholar]
- McLandress C, Shepherd TG, Polavarapu S, Beagley SR. Is missing orographic gravity wave drag near 60°S the cause of the stratospheric zonal wind biases in chemistry-climate models? J Atmos Sci. 2012;69:802–818. https://doi.org/10.1175/JAS-D-11-0159.1. [Google Scholar]
- Molod A, Takacs L, Suarez M, Bacmeister J. Development of the GEOS-5 atmospheric general circulation model: Evolution from MERRA to MERRA2. Geosci Model Dev. 2015;8:1339–1356. https://doi.org/10.5194/gmd-8-1339-2015. [Google Scholar]
- Moorthi S, Suarez MJ. A parameterization of moist convection for general circulation models. Mon Weather Rev. 1992;120:3877–3886. https://doi.org/10. 1029/1998JD200092. [Google Scholar]
- Plougonven R, Snyder C. Inertia-gravity waves spontaneously generated by jets and fronts Part I: Different baroclinic life cycles. J Atmos Sci. 2007;64:2502–2520. [Google Scholar]
- Plougonven R, Zhang F. Internal gravity waves from atmospheric jets and fronts. Rev Geophys. 2014;52:33–76. https://doi.org/10.1002/2012RG000419. [Google Scholar]
- Plougonven R, Hertzog A, Guez L. Gravity waves over Antarctica and the Southern Ocean: Consistent momentum fluxes in mesoscale simulations and stratospheric balloon observations. Q J R Meteorol Soc. 2013;139:101–118. https://doi.org/10.1002/qj.1965. [Google Scholar]
- Plougonven R, Hertzog A, Alexander MJ. Case studies of non-orographic gravity waves over the Southern Ocean emphasize the role of moisture. J Geophys Res. 2015;120:1278–1299. https://doi.org/10.1002/2014JD022332. [Google Scholar]
- Plougonven R, de la Cämara A, Jewtoukoff V, Hertzog A, Lott F. On the relation between gravity waves and wind speed in the lower stratosphere over the Southern Ocean. J Atmos Sci. 2017;74:1075–1093. https://doi.org/10.1175/JAS-D-16-0096.1. [Google Scholar]
- Preusse P, Ern M, Bechtold P, Eckermann SD, Kalisch S, Trinh QT, Riese M. Characteristics of gravity waves resolved by ECMWF. Atmos Chem Phys. 2014;14:10483–10508. https://doi.org/10.5194/acp-14-10483-2014. [Google Scholar]
- Putman WM, Lin SJ. Finite-volume transport on various cubed-sphere grids. J Comput Phys. 2007;227:55–78. [Google Scholar]
- Putman WM, da Silva AM, Ott L, Darmenov A. Office Note No. 5.0 (Version 1.0) GMAO. Greenbelt, MD.: 2014. [accessed 8 July 2017]. Model configuration for the 7 km GEOS-5.12 Nature Run, Ganymed Release (Non-hydrostatic 7 km Global Mesoscale Simulation) http://gmao.gsfc.nasa.gov/pubs/office_notes. [Google Scholar]
- Richter JH, Sassi F, Garcia RR. Toward a physically based gravity wave source parameterization in a general circulation model. J Atmos Sci. 2010;67:136–156. https://doi.org/10.1175/2009JAS3112.1. [Google Scholar]
- Sardeshmukh PD, Hoskins BJ. Spatial smoothing on the sphere. Mon Weather Rev. 1984;112:2524–2529. [Google Scholar]
- Sato K, Watanabe S, Kawatani Y, Tomikawa Y, Miyazaki K, Takahashi M. On the origins of mesospheric gravity waves. Geophys Res Lett. 2009;36:L19801. https://doi.org/10.1029/2009GL039908. [Google Scholar]
- Seto S, Iguchi T, Oki T. The basic performance of a precipitation retrieval algorithm for the global precipitation measurement mission's single/dual-frequency radar measurements. IEEE Trans Geosci Remote Sens. 2013;51:5239–5251. https://doi.org/10.1109/TGRS.2012.2231686. [Google Scholar]
- Song IS, Chun HY. Momentum flux spectrum of convectively forced internal gravity waves and its application to gravity wave drag parameterization. Part I: Theory J Atmos Sci. 2005;62:107–124. https://doi.org/10.1175/JAS-3363.1. [Google Scholar]
- Tokioka T, Yamazaki K, Kitoh A, Ose T. The equatorial 30--60 day oscillation and the Arakawa--Schubert penetrative cumulus parameterization. J Meteorol Soc Jpn. 1988;66:883–901. [Google Scholar]
- Vincent RA, Hertzog A, Boccara G, Vial F. Quasi-Lagrangian superpressure balloon measurements of gravity-wave momentum fluxes in the polar stratosphere of both hemispheres. Geophys Res Lett. 2007;34:L19804. https://doi.org/10.1029/2007GL031072. [Google Scholar]
- Watanabe S, Kawatani Y, Tomikawa Y, Miyazaki K, Takahashi M, Sato K. General aspects of a T213 L256 middle atmosphere general circulation model. J Geophys Res. 2008;113:D12110. https://doi.org/10.1029/2008JD010026. [Google Scholar]
- Wei J, Zhang F. Mesoscale gravity waves in moist baroclinic jet-front systems. J Atmos Sci. 2014;71:929–952. https://doi.org/10.1175/JAS-D-13-0171.1. [Google Scholar]
- Woods BK, Smith RB. Energy flux and wavelet diagnostics of secondary mountain waves. J Atmos Sci. 2010;67:3721–3738. https://doi.org/10.1175/2009JAS3285.1. [Google Scholar]
- Wright CJ, Osprey SM, Gille JC. Global observations of gravity wave intermittency and its impact on the observed momentum flux morphology. J Geophys Res. 2013;118:10980–10993. https://doi.org/10.1002/jgrd.50869. [Google Scholar]
- Zipser E, Liu C, Cecil DJ, Nesbitt SW, Yorty S. Where are the most intense thunderstorms on Earth? Bull Am Meteorol Soc. 2006;87:1057–1071. [Google Scholar]


