Abstract
It is essential to monitor tissue perfusion during and after reconstructive surgery, as restricted blood flow can result in graft failures. Current clinical procedures are insufficient to monitor tissue perfusion, as they are intermittent and often subjective. To address this unmet clinical need, a compact, low-cost, multimodal diffuse correlation spectroscopy and diffuse reflectance spectroscopy system was developed. We verified system performance via tissue phantoms and experimental protocols for rigorous bench testing. Quantitative data analysis methods were employed and tested to enable the extraction of tissue perfusion parameters. This design verification study assures data integrity in future in vivo studies.
Keywords: Diffuse Correlation Spectroscopy, Diffuse Reflectance Spectroscopy, tissue phantoms, tissue perfusion
1. INTRODUCTION
Tissue perfusion monitoring is essential during and after reconstructive surgery, as restricted blood flow can rapidly result in graft failures. Current clinical procedures for monitoring tissue perfusion are insufficient: they are intermittent and often subjective. To address this unmet clinical need, we developed a compact, low-cost, multimodal diffuse correlation spectroscopy (DCS) and diffuse reflectance spectroscopy (DRS) system. This non-invasive system uses fiber-optic probes embedded in adherent skin patches to detect tissue perfusion continuously and automatically.
In this study, we verified the DCS-DRS system’s performance by designing tissue-simulating phantoms and experimental protocols for rigorous bench testing. We employed and tested quantitative data analysis methods to enable the real-time extraction of several perfusion parameters, including blood flow indices as well as hemoglobin concentration.
For the DCS sub-system, we constructed a flow phantom to assess the accuracy of the sub-system’s flow parameter estimates. For the DRS sub-system, we constructed a liquid phantom with scattering and absorption coefficients of physiological relevant values to test accuracy using an inverse model. We anticipate this design verification study will help to assure data integrity in future pre-clinical and clinical studies.
2. METHODS
2.1 Instrumentation
We have developed a multimodal device capable of taking measurements on in vivo tissues using DCS and DRS in rapid succession. A DCS instrument was constructed consisting of two Near-Infrared (785 nm) diode lasers, two cooled avalanche photodiodes operated in Geiger mode for single photon detection, and a custom-made correlation and laser control board. The instrument automates DRS spectral collection using a white LED as a broadband source and a miniaturized spectrometer (Avantes) to acquire a reflectance spectrum (450 ~ 650 nm). All raw photon count time stamps, as well as correlation curves and DRS spectra, are collected and saved by the device to a laptop running a custom GUI written in C#. Further details on instrument construction can be found in [REF 1–5].
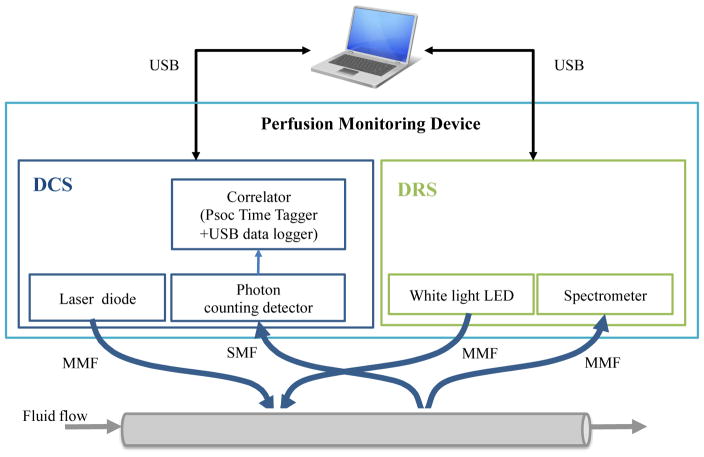
To verify the device’s performance, we designed and tested tissue-simulating flow phantoms on customized multimodal patches. Flow speed was controlled via a peristaltic pump (Fisher Scientific, CAT# 138764). The multimodal patches were designed to acquire data on skin flaps whose geometry is planar in nature, while our liquid phantoms flowed through cylindrical tubing. Due to the incongruence between the patch’s source-detector geometry and our phantom geometry, DRS and DCS measurements were taken on separate phantoms. The experimental setup can be viewed in Figure 1 below.
Figure 1.
Diagram of Experimental Setup – Fiber optic patches were secured to tubing as the perfusion monitoring device detected fluid flow. (MMF: multi-mode fiber; SMF: single-mode fiber)
2.2 Phantom Making
For both DCS and DRS phantoms, we used deionized water as the flow medium and flexelene (Eldon James SFX 1–2, ID = 1/16″, OD = 1/8″) for the tubing. For scattering agents, we used titanium oxide in the DCS phantom and polystyrene microspheres (0.99μm, Polysciences Inc., μs′ = 10 cm−1) in the DRS phantom. For the DRS phantom, we added differing concentrations of hemoglobin (0, 5, 10, 15, 20 μM) as an absorbing agent.
2.3 Data Analysis: DCS
We developed an algorithm to convert photon intensity into a value for meaningfully describing flow changes. An autocorrelation function was generated for each scan in the experiment and then normalized according to its Beta value as defined by the Siegert equation (2.31). For details on the Siegert equation and on how the curves were generated from DCS data, refer to the cited SPIE proceedings.1–4,6 The curves were smoothed using logarithmic interpolation.
| (2.31) |
The Beta value is a product of an experimental setup that fluctuates throughout the experiment. A feature-scaling technique was used to normalize the Beta values for each scan by fitting a sigmoidal curve to the calculated g2 function. Specifically, Min-Max scaling was used to fix the bounds of the autocorrelation function from 0 to 1. Normalized Beta values allowed for more accuracy in detecting changes in the perfusion as opposed to simply monitoring instrument setup and noise. A nonlinear least-squares solver was used to find the parameters of the sigmoid given by equation 2.32. These parameters were used to calculate the maximum and minimum values needed for normalization. They were then used to scale the calculated autocorrelation curves by equation 2.33.
| (2.32) |
| (2.33) |
To obtain a quantitative parameter related to fluid flow, we then calculated a tau-half value (the value that corresponds to one-half the maximum of the normalized g2) for each scan from the scaled autocorrelation function. Our algorithm calculated tau-half values in the following manner:
A mean value for the ‘start’ and ‘end’ of the region of interest in the autocorrelation curve was calculated from g2 values within two predetermined ranges at the beginning and end of the g2 curves. For relatively “clean” DCS data, these ranges represent the points at the beginning and end of the DCS curve where the slope is zero. The average of the ‘start’ and ‘end’ g2 values was calculated and the tau-half value was determined by interpolating the tau value corresponding to this average.
To account for varying amounts of noise between different autocorrelation curves, for each scan a series of 81 tau-half values were calculated using combinations of nine different start and end ranges. A representative tau-half value was then determined from the average of the 81 tau-half values. An overview of the final algorithm developed for DCS data analysis is given in Figure 2. A more in-depth description of the theory behind the DCS analysis can be found in [Ref 6 and 8–12].
Figure 2.
Diagram of DCS data analysis
2.4 Data Analysis: DRS
To estimate total hemoglobin concentration and tissue oxygen saturation, a Monte Carlo lookup table (MCLUT)-based inverse method was employed to fit the measured reflectance spectra.3,7 Technical details on algorithm implementation are described in [REF 1].
3. RESULTS
3.1 DCS results
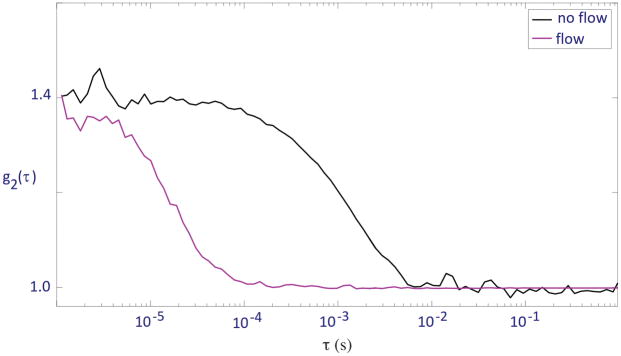
We took DCS measurements using the perfusion-monitoring device on two different flow conditions: no flow and dial 10 on the peristaltic pump, corresponding to a flow rate of ~1.5×10⁻⁷ m3s−1. For no flow, the liquid phantom was stationary within the tubing. For each condition, 6 scans were taken at 5-second intervals for 30 seconds. Normalized autocorrelation curves were generated for each scan measured. One representative scan from each condition is shown in Figure 3.
Figure 3.
Normalized autocorrelation curves of the flexelene flow phantom with no flow in tubing and flow at dial 10 on peristaltic pump
To obtain a quantitative parameter related to flow rate, we also calculated the mean tau-half values for each flow condition from the normalized curves. For both flow conditions, the tau-half values from each of the 6 scans were averaged, and the results are discussed in section 4.1.
3.2 DRS results
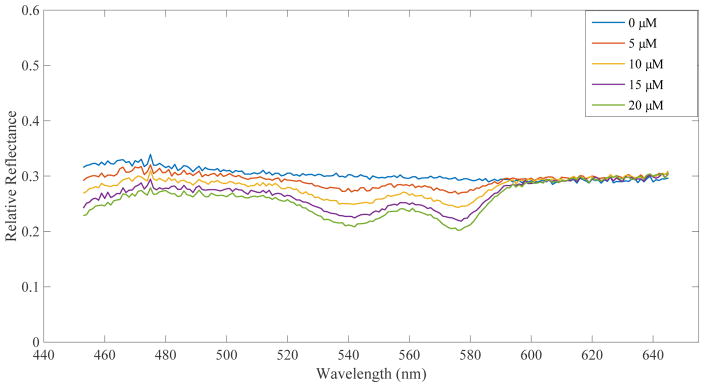
As described in section 2.2, DRS data was taken separately from DCS data. Hemoglobin concentrations were estimated from the reflectance spectra using an MCLUT-based algorithm. Figure 4 displays the reflectance spectra of 5 different Hb concentrations taken on flow phantoms set to a dial speed corresponding to ~1.8×10⁻⁷m3s−1. Table 1 displays the measured and extrapolated percent increases in hemoglobin.
Figure 4.
DRS results for flow at dial 10 on the peristaltic pump
Table 1.
Comparison between extrapolated and actual percent increase in Hb concentration over the course of the experiment
| Hb Concentration (μM) | Estimated % Increase in Hb | Actual % Increase |
|---|---|---|
| 0 | N/A | N/A |
| 5 | N/A | N/A |
| 10 | 61.7 | 100 |
| 15 | 40.2 | 50 |
| 20 | 26.7 | 33.3 |
4. DISCUSSION
4.1 DCS
We explored a number of methods for DCS data analysis to extrapolate consistent data, and feature scaling was found to best represent the data. We also tried creating a filter using the median tau-half values, which were directly calculated from non-normalized autocorrelation curves. There was concern that tau-half values with noisy start and end range combinations could heavily skew the means. To filter these specific tau-half values, a median filter was tested. If the tau-half value was an outlier (±1.5 times the inter-quartile range), the tau-half value was removed from the set before averaging. However, when these newly-calculated mean tau-half values were compared to the autocorrelation curves, the tau-half values did not represent the curves’ trends (curves shifted more to the right did not always have greater tau-half values). Normalizing autocorrelation curves removed the need to filter certain tau-half values, and the final mean tau-half values for each curve were consistent with the curves’ trends.
The acquired autocorrelation curves shown in Figure 3 shifted to the right as flow from the pump was turned off, indicating a clear decrease in flow speed. Note that although there was no directed flow in the no-flow condition, the autocorrelation curve still displayed a sigmoidal shape due to diffusion of the scattering particles. The no-flow and flow conditions were found to have mean tau-half values of 8.4±1.4×10⁻⁴s and 5.2±0.2×10⁻⁵s respectively, supporting the inverse trend between fluid flow and tau-half value implied by the autocorrelation curves.
4.2 DRS
As anticipated, the reflectance spectra in Figure 4 display an increasingly prominent “double dip” shape for increasing hemoglobin concentrations. Looking at Table 1, it is evident that our computer algorithm produces hemoglobin estimates that follow the expected trend (increasing estimated Hb as more Hb was added), but differ from the exact concentration. This suggests that our DRS system in combination with our MCLUT algorithm can reliably assess relative changes in hemoglobin concentration.
5. CONCLUSION
We have bench tested a low-cost, multimodal DRS-DCS system on a variety of flow phantoms with physiologically relevant absorption and scattering coefficients. Our results suggest that the device can reliably detect relative changes in flow and hemoglobin concentration. We are confident that this study lends data integrity to future in vivo studies with this system.
Acknowledgments
This work was supported by the National Institute of Health (R44-DE021935).
Contributor Information
Julia M. Pakela, University of Michigan (United States)
Taylor L. Hedrick, University of Michigan (United States)
Seung Yup Lee, University of Michigan (United States).
Karthik Vishwanath, Miami University (United States).
Sara Zanfardino, Miami University (United States).
Yooree G. Chung, University of Michigan (United States)
Michael C. Helton, University of Michigan (United States)
Noah J. Kolodziejski, Radiation Monitoring Devices, Inc. (United States)
Christopher J. Stapels, Radiation Monitoring Devices, Inc. (United States)
Daniel R. McAdams, Radiation Monitoring Devices, Inc. (United States)
Daniel E. Fernandez, Radiation Monitoring Devices, Inc. (United States)
James F. Christian, Radiation Monitoring Devices, Inc. (United States)
Stephen E. Feinberg, University of Michigan (United States)
Mary-Ann Mycek, University of Michigan (United States).
References
- 1.Kolodziejski NJ, Staples CJ, McAdams DR, Fernandez DE, Podolsky MJ, Farkas D, Ward BB, Vartarian M, Feinberg SE, Lee SY, Parikh U, Mycek MA, Christian JF. A compact instrument to measure perfusion of vasculature in transplanted maxillofacial free flaps. Proc SPIE. 2016;9715:97150L. doi: 10.1117/12.2212872. [DOI] [PMC free article] [PubMed] [Google Scholar]
- 2.Stapels CJ, Kolodziejski NJ, McAdams DR, Podolsky MJ, Fernandez DE, Farkas D, Christian JF. A scalable correlator for multichannel diffuse correlation spectroscopy. Proc SPIE. 2016;9698:969816. doi: 10.1117/12.2213114. [DOI] [PMC free article] [PubMed] [Google Scholar]
- 3.McAdams DR, Kolodziejski NJ, Staples CJ, Fernandez DE, Podolsky MJ, Farkas D, Christian JF, Joyner MJ, Johnson CP, Paradis NA. Instrument to detect syncope and the onset of shock. Proc SPIE. 2016;9707:970706. doi: 10.1117/12.2212803. [DOI] [PMC free article] [PubMed] [Google Scholar]
- 4.Farkas DL, Kolodziejski NJ, Staples CJ, McAdams DR, Fernandez DE, Podolsky MJ, Christian JF, Ward BB, Vartarian M, Feinberg SE, Lee SY, Parikh U, Mycek MA, Joyner MJ, Johnson CP, Paradis NA. A disposable flexible skin patch for clinical optical perfusion monitoring at multiple depths. Proc SPIE. 2016;9715:97151H. doi: 10.1117/12.2230988. [DOI] [PMC free article] [PubMed] [Google Scholar]
- 5.Fernandez D, Stapels C, McAdams D, Christian J, Kolodziejski N. Biomedical Optics 2016, OSA Technical Digest (online) Optical Society of America; 2016. Instrument for Early Detection of Hemorrhage via Diffuse Correlation Spectroscopy. paper JTu3A.1. [Google Scholar]
- 6.Yu G, Durduran T, Zhou C, Cheng R, Yodh AG. Near-Infrared Diffuse Correlation Spectroscopy for Assessment of Tissue Blood Flow. In: Boas DA, Pitris C, Ramanujam N, editors. Handbook of Biomedical Optics. CRC Press; Boca Raton, FL: 2011. pp. 185–216. [Google Scholar]
- 7.Hennessy R, Lim SL, Markey MK, Tunnel JW. Monte Carlo lookup table-based inverse model for extracting optical properties from tissue-simulating phantoms using diffuse reflectance spectroscopy. J Biomed Opt. 2013;18(3):037003. doi: 10.1117/1.JBO.18.3.037003. [DOI] [PMC free article] [PubMed] [Google Scholar]
- 8.Boas DA, Campbell LE, Yodh AG. Scattering and imaging with diffusing temporal field correlations. Phys Rev Lett. 1995;75(9):1855–1858. doi: 10.1103/PhysRevLett.75.1855. [DOI] [PubMed] [Google Scholar]
- 9.Boas DA, Yodh AG. Spatially varying dynamical properties of turbid media probed with diffusing temporal light correlation. J Opt Soc Am A. 1997;14(1):192–215. [Google Scholar]
- 10.Buckley EM, Parthasarathy AB, Grant PE, Yodh AG, Franceschini MA. Diffuse correlation spectroscopy for measurement of cerebral blood flow: future prospects. Neurophoton. 2014;1(1):011009. doi: 10.1117/1.NPh.1.1.011009. [DOI] [PMC free article] [PubMed] [Google Scholar]
- 11.Durduran T, Yodh AG. Diffuse correlation spectroscopy for non-invasive, micro-vascular cerebral blood flow measurement. NeuroImage. 2014;85(1):51–63. doi: 10.1016/j.neuroimage.2013.06.017. [DOI] [PMC free article] [PubMed] [Google Scholar]
- 12.Verdecchia K, Diop M, St Lawrence K. Medical Biophysics Publications. 2015. Investigation of the best model to characterize diffuse correlation spectroscopy measurements acquired directly on the brain. Paper 63. [DOI] [PMC free article] [PubMed] [Google Scholar]


