

Abstract
Therapy-related myeloid neoplasms (t-MN) arise as a late-effect of chemotherapy and/or radiation administered for a primary condition, typically a malignant disease, solid organ transplant, or autoimmune disease. Survival is measured in months, not years, making t-MN one of the most aggressive and lethal cancers. In this review, we discuss recent developments that reframe our understanding of the genetic and environmental etiology of t-MN. Emerging data illuminate who is at highest risk for developing t-MN, why t-MN is chemoresistant, and how we may use this information to treat and ultimately prevent this dreaded disease.
Introduction
Therapy-related myeloid neoplasm (t-MN), comprised of therapy-related acute myeloid leukemia (AML), myelodysplastic syndrome (MDS), and myelodysplastic/myeloproliferative neoplasms (MDS/MPN), is a late complication of cytotoxic therapy used in the treatment of both malignant and non-malignant diseases.1 There are several clinical subsets of t-MN that correlate with the nature of the prior therapy. The most common subtype (~70% of patients) is characterized by loss of part of chromosome 5, del(5q), and/or part or all of chromosome 7 [-7/del(7q)] and is characteristic in patients who received alkylating agents and/or radiation therapy. Clinically, these patients have a long latency period (on average five years), present with MDS, which often progresses rapidly to AML with multilineage dysplasia, and a poor prognosis (median survival: 8 months). A second major subset of t-MN is seen in patients who received topoisomerase II inhibitors. Clinically, these patients have a shorter latency period (in the range of one to two years), present with overt leukemia without an antecedent MDS, and have a more favorable response to intensive induction therapy. Translocations involving KMT2A at 11q23.3, or RUNX1 at 21q22.1 are common in this subgroup.
Historically, t-MN has been considered to be a consequence of DNA damage induced in normal hematopoietic stem or progenitor cells by cytotoxic therapy. There is now active debate in the field of cancer biology regarding the relative contributions of inherited risk factors, environmental exposures, and stochastic events in the etiology of this cancer. One study estimated that extrinsic factors contribute to 70–90% of risk in most cancer types2. By definition, therapy-related cancers, also known as second neoplasms, have a strong extrinsic driver, i.e., previous chemotherapy and/or radiotherapy. Nonetheless, up to 10% of patients have had more than one previous cancer prior to the diagnosis of t-MN; thus, the concept that exposure is the sole cause of t-MN has been unsatisfactory, and raises multiple questions. Why do some people develop t-MN whereas others do not? Why does the second cancer have a latency of ten years or more in some patients? In addition, why are t-MNs inherently chemoresistant?
Technologic advances, such as next-generation sequencing (NGS), have been transformative for the field. We have learned that 8.5-12.6% of cancer patients, have an inherited mutation in a cancer-associated gene, compared to 1-2.7% of individuals without cancer3–5. As discussed below, this frequency is likely to be much higher in t-MN patients. Studies are also coalescing on the role hematopoietic stem cells (HSCs) with acquired somatic mutations prior to treatment of the primary disease as precursors for t-MN. This knowledge of inherited and pretreatment somatic genetic alterations sheds light on t-MN etiology and, potentially, the long-awaited predictors of who is at risk for developing t-MN.
In this review, we synthesize recent findings that are reframing our understanding of t-MN pathogenesis. We highlight new experimental data that challenge prevailing beliefs regarding t-MN etiology: (i) chemotherapy/radiotherapy promotes clonal selection of pre-existing, mutant HSCs, in addition to inducing leukemogenic mutations directly; (ii) t-MNs are genetically and etiologically similar to other high-risk myeloid neoplasms; (iii) large chromosomal deletions do not harbor a single, recessive, tumor suppressor gene (TSG), but rather are part of Contiguous Gene Syndromes (CGSs) invoking haploinsufficiency; and, (iv) an aberrant bone marrow microenvironment contributes to malignant hematopoiesis. The models described here are not mutually exclusive, and one or multiple different pathways may contribute in any individual patient. Moreover, these paradigms may also apply to others cancers that arise from the interaction between genetics and environment.
Epidemiology
In 2012, there were an estimated 13.7 million cancer survivors in the United States6. An aging population, a commensurate increase in the number of cancer cases, and improvements in oncology care are anticipated to lead to 18 million cancer survivors within a decade6,7. Although this progress is welcome, it bears a need to attend to the long-term health risks of survivors. The incidence of t-MN – currently 0.62 per 100,000 men and women (~10-20% of newly diagnosed AML/MDS8,9) – is expected to rise in parallel with the increase in cancer survivors. The median age of diagnosis of t-MN is 64 years, but the disease can occur at any age10. Chemotherapy treatment carries a 4.7-fold increased incidence of t-MN11, and younger age at the time of exposure increases that risk11,12.
Treatment for most primary tumor types carries a risk of t-MN (Figure 1). t-MN is rare, although it can occur in certain subgroups with high frequency. The most common primary malignancies are breast cancer and hematologic malignancies (particularly non-Hodgkin Lymphoma, Hodgkin Lymphoma, and multiple myeloma)11,13,14. Breast cancer patients have a 0.5% cumulative ten-year incidence of t-MN15. Hodgkin Lymphoma patients have a cumulative six-year incidence of 0.9%16. Depending on the treatment regimen, up to 10% of non-Hodgkin Lymphoma patients17, and 8.2% of chronic lymphocytic leukemia patients18 develop t-MN. Patients with a prior bone or soft-tissue sarcoma have a particularly high risk of t-MN, which may stem, in part, from an inherited pathogenic variant in a cancer-risk gene, which is present in one-half of these patients19.
Figure 1. Risk of t-MN after chemotherapy in the U.S. from 1975-2008.
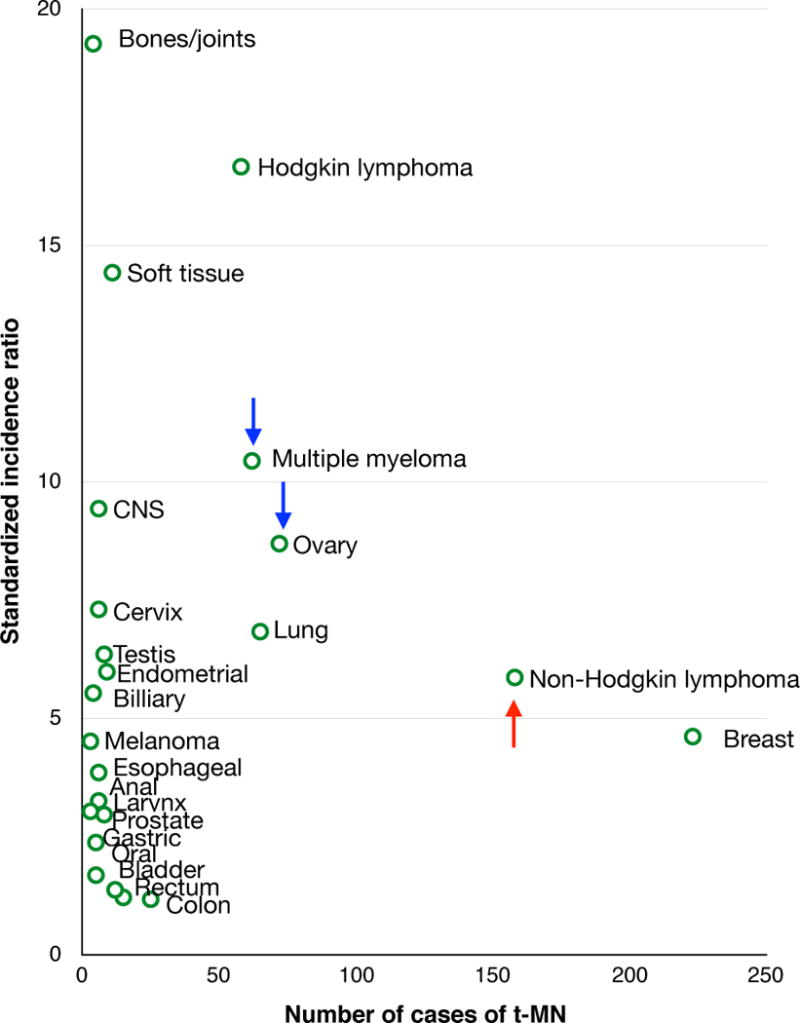
Among adults treated with chemotherapy for a primary malignancy, 801 t-MN patients were identified from Surveillance, Epidemiology and End Results11. The number of cases and standardized incidence ratio for t-MN are shown by primary tumor type. The risk of t-MN has decreased over time for patients with multiple myeloma or ovarian cancer (blue arrows), whereas the risk has increased for patients with non-Hodgkin lymphoma (red arrow).
Changes in treatment protocols, including decreased use of alkylating agents, have ushered in changes in t-MN incidence. Since 1975, the risk of t-MN has decreased for patients with ovarian cancer and multiple myeloma11. In contrast, t-MN risk has increased for non-Hodgkin Lymphoma patients, particularly in those who undergo stem cell transplantation, and new at-risk populations have emerged within esophageal, cervical, prostate, and endometrial cancer patients11. Another growing population is solid organ transplant recipients who have a similar risk for t-MN12. The expectation is that progress in developing targeted chemotherapies, with less nonspecific cytotoxicity, will result in a decrease in t-MN incidence.
With respect to latency period, patients diagnosed with a solid tumor have an increased risk of t-MN within 9 to 12 months after treatment, that peaks at two years, and returns to a population baseline risk in 10–15 years13. t-MN developing after a primary hematologic malignancy follows a broader time course that peaks at five years and does not return to baseline even after 15 years, a risk pattern that could be related to an underlying inherited predisposition to hematopoietic malignancies, as discussed below.
Inherited risk factors
By convention, any myeloid neoplasia occurring after cytotoxic exposure is defined as therapy-related. The observation that some t-MNs occur decades after cytotoxic therapy raises the question of whether some cases are a consequence of prior treatment, or instead, represent either second cancers arising in patients with a genetic predisposition that are unrelated to cytotoxic therapy or are a stochastic second cancer. Inherited, common polymorphisms in genes encoding proteins involved in drug metabolism and DNA damage response pathways are associated with t-MN in some studies, e.g., NQ01, GSTP1, and RAD51 (reviewed in ref.20). However, these are low risk alleles. In the search for higher penetrance inherited variants, researchers have studied cancer survivors who developed t-MN and found that 16-21% of them have a germline mutation associated with inherited cancer susceptibility genes21–23. Churpek and colleagues examined the frequency of germline mutations in 42 breast and ovarian cancer susceptibility genes in forty-seven breast cancer survivors who developed a t-MN or t-ALL (therapy-related acute lymphoblastic leukemia)21. Ten (21%) had germline mutations in BRCA1/2 (n = 5), TP53 (n = 3), PALB2 and CHEK2 (n = 1 each). Other studies corroborate germline mutations in BRCA1, BRCA2, TP53, and Fanconi anemia genes in t-MN patients22,24–27.
Many of the known t-MN predisposition genes encode components of the DNA damage response. This suggests a model whereby individuals with these germline mutations are particularly susceptible to cytotoxic chemotherapy and/or radiation, since they have deficient DNA repair, genomic instability, and/or insufficient cell cycle arrest and apoptosis. Supporting this hypothesis, Brca1-deficient mice (Brca1−/−) exhibit cytopenias, genomic instability, and bone marrow failure, and a subset develop myeloid neoplasms28. Interestingly, breast cancers arising in patients with germline BRCA1/2 mutations are associated with concurrent somatic TP53 mutations, suggesting cooperativity29,30. We postulate that TP53 dysfunction is integral to BRCA1/2 mutation-associated tumors, potentially selecting for the high frequency of TP53 mutations in t-MN, a disease that is also characterized by defects in the DNA damage response31.
An alternative, and not mutually exclusive model, is that genetically susceptible patients are at risk for the independent development of a second malignancy. Supporting this, the latency period to t-MN development in patients with BRCA1 or BRCA2 mutations was quite long – 133 months21. In addition, among eight patients with germline mutations, five had normal karyotypes or balanced translocations in the leukemia cells, which are cytogenetic findings more typical of de novo AML. This supports the hypothesis that myeloid neoplasms arising in some genetically susceptible hosts are minimally influenced by the previous treatment and may represent second primary cancers.
Furthermore, germline mutations in genes other than those involved in the DNA damage pathways may interact with genotoxic cancer therapies to induce t-MN. For example, children with germline mutations of NF1 (encoding a negative regulator of Ras signaling) are at elevated risk of t-MN32. Consistent with this idea, heterozygous Nf1 mutant mice are strongly predisposed to radiation-induced myeloid neoplasms33,34.
It is likely that expanding these studies to include larger gene panels or whole genome sequencing, together with the analysis of a larger cohort of patients, will increase the number of susceptibility genes and the frequencies of inherited risk alleles. Overall, emerging data emphasize the need to account for germline variants in the diagnosis and management of t-MN.
Exposures
Chemotherapy
The risk of developing t-MN is likely to be a complex interaction of the chemotherapeutic agents, dosages, radiation intensity, genetic factors, environment, comorbidities, and age of the patient. Although any cytotoxic agent can increase the risk of t-MN, alkylating agents and topoisomerase II inhibitors are especially causative (Table 1). Alkylating agents covalently modify the DNA, causing DNA cross-linking, double-stranded breaks, mutations, and cytotoxicity. The cumulative dosage correlates with the incidence of t-MN, and some alkylating agents are more leukemogenic than others35,36. Alkylating agents are associated with longer latency to t-MN, a presentation of MDS often progressing to AML, deletions of chromosome 5, loss or deletion of chromosome 7, and a poor prognosis. Platinum-based chemotherapeutic agents have a weaker association with t-MN37,38.
Table 1.
Two major classes of therapy-related myeloid neoplasms.
| Alkylating agent class | Topoisomerase II inhibitor class | |
|---|---|---|
| Cytogenetics | del(5q), −7/del(7q)* | t(11q23.3), t(21q22.1) |
| Frequency | ~70% of t-MN patients | ~30% of t-MN patients |
| Latency | 5-7 years | 2-3 years |
| Presentation | Myelodysplastic syndrome | Acute myeloid leukemia |
| Implicated drugs |
Alkylating agents: bendamustine, busulfan, carmustine, chlorambucil, cyclophosphamide, dacarbazine, lomustine, melphalan, mitomycin C, nitrogen mustard, procarbazine, thiotepa Platinum-based: cisplatin, carboplatin Antimetabolite: azathioprine, fludarabine |
Anthracyclines: daunorubicin, epirubicin, doxorubicin Other topoisomerase II inhibitors: etoposide, teniposide, amsacrine, mitoxantrone |
Loss of the short arm of chromosome 17 containing the TP53 gene, due to a del(17p), unbalanced rearrangement, or −17, is observed in association with a del(5q) in 40% of cases.
Topoisomerase-II inhibitors induce double-stranded DNA breaks by preventing religation of the DNA strands cleaved by the enzyme to facilitate unwinding of the DNA during replication, and are correspondingly linked with balanced translocations14. Because myeloid leukemias with balanced translocations, such as translocations involving 11q23.3/KMT2A, 21q22.1/RUNX1, or PML-RARA/t(15;17) have the fewest cooperating mutations39, it is possible that the acquisition of multiple cooperating mutations is not required for leukemogenesis and can explain why topoisomerase II inhibitor-associated t-MN has a shorter latency and presents as overt AML14.
t-MN is also associated with prior exposure to the antimetabolites, azathioprine and fludarabine40,41. For other classes of drugs (such as anti-tubulins, hydroxyurea, growth factors, or other antimetabolites), it is difficult to parse out a definitive leukemogenic role. This is partly because most patients receive combination therapies, but may also be due to weaker contributions to t-MN. Among ovarian cancer patients with germline BRCA1 or BRCA2 mutations, 0.8-2% developed t-MN after therapy with olaparib, a PARP1 inhibitor, resulting in a black-box warning, and suggesting a unique susceptibility worthy of further study42.
Radiation
Studies of atomic bomb survivors established radiation as a potent leukemogen43. In cancer therapy, the incidence of myeloid neoplasia is proportional to the prior radiation dose44, whereas the addition of radiation to a chemotherapy regimen increases the risk for t-MN in some, but not all, disease contexts. For example, the risk of t-MN increases with combined modality treatment for lung and breast cancer, an effect not seen for patients with non-Hodgkin Lymphoma, Hodgkin Lymphoma, or multiple myeloma13. The influence of radiation exposure was less apparent for these hematologic malignancies, perhaps due to potency of the chemotherapy and/or the radiation field. It also remains possible that for patients with primary hematologic malignancies an underlying genetic predisposition masks an additive effect of radiation.
The role of radiation therapy as a sole risk factor for t-MN development has been controversial. In t-MNs following radiation monotherapy, 60% have abnormalities of chromosomes 5 and/or 7, much like the cytogenetic abnormalities associated with alkylating agents, together with a similar clinical and morphological profile14. The hope is that decreasing radiation fields of exposure and doses will be less leukemogenic, as suggested by a more recent cohort of t-MN patients receiving radiation monotherapy that had clinical and cytogenetic features more similar to de novo myeloid neoplasms45. Furthermore, external beam radiotherapy or brachytherapy for prostate cancer may not be associated with increased risk of MDS46.
Somatic Contiguous Gene Syndromes
The spectrum of genomic abnormalities in t-MN parallels that of de novo myeloid neoplasms, with the key distinction that t-MN is skewed markedly toward high-risk abnormalities47. Del(5q), −7/del(7q), complex karyotypes, and TP53 mutations, all carrying an adverse prognosis, are significantly overrepresented in t-MN compared to de novo counterparts (Table 2). In contrast, favorable risk abnormalities such as the t(8;21), or intermediate risk normal karyotypes are significantly underrepresented. In this regard, t-MN parallels other high-risk myeloid neoplasms, namely secondary AML arising from MDS48, and de novo AML in the elderly49.
Table 2.
Recurrent mutations and cytogenetic abnormalities in therapy-related myeloid neoplasms.
| Cytogenetic abnormality | t-MN frequency (%) | de novo AML frequency (%) | Recurrent in CHIP | Risk stratification | t-MN references | de novo AML references | ChIP references |
|---|---|---|---|---|---|---|---|
| del(5q)* | 42 | 5-16 | Yes | Unfavorable | Le Beau 2002 Blood 102:43 | Grimwade Blood 2001;98:1312-1320; Frohling Blood 2006;108:3280-3288; Grimwade Blood 2010;116(3):354-365 | Forsberg, LA, et al. 2012 ASHG 90(2):217-228 |
| -7/del(7q)* | 49 | 4-14 | Yes | Unfavorable | Le Beau 2002 Blood 102:43 | Grimwade Blood 2001;98:1312-1320; Frohling Blood 2006;108:3280-3288; Grimwade Blood 2010;116(3):354-365 | Laurie, C. C. et al. 2012 Nat Genet. 44(6):642-50 |
| +8 | 3 | 10-13 | Yes | Unfavorable | Le Beau 2002 Blood 102:43 | Grimwade Blood 2001;98:1312-1320; Frohling Blood 2006;108:3280-3288; Grimwade Blood 2010;116(3):354-365 | Laurie, C. C. et al. 2012 Nat Genet. 44(6):642-50 |
| Complex karyotype* | 48 | 5-17 | Unfavorable | Christiansen 2001 J Clin Oncol 19:1405-1413 | Frohling Blood 2006;108:3280-3288; Grimwade Blood 2010;116(3):354-365 | ||
| inv(16), t(16;16) | 2 | 1-7 | Favorable | Le Beau 2002 Blood 102:43 | Grimwade Blood 2001;98:1312-1320; Frohling Blood 2006;108:3280-3288; Grimwade Blood 2010;116(3):354-365 | ||
| Normal karyotype | 8 | 41-48 | Intermediate | Le Beau 2002 Blood 102:43 | Grimwade Blood 2001;98:1312-1320; Frohling Blood 2006;108:3280-3288; Grimwade Blood 2010;116(3):354-365 | ||
| t(11q23.3) | 3 | 3-4 | Intermediate | Le Beau 2002 Blood 102:43 | Grimwade Blood 2001;98:1312-1320; Frohling Blood 2006;108:3280-3288; Grimwade Blood 2010;116(3):354-365 | ||
| t(15;17) | 2 | 3-13 | Favorable | Le Beau 2002 Blood 102:43 | Grimwade Blood 2001;98:1312-1320; Frohling Blood 2006;108:3280-3288; Grimwade Blood 2010;116(3):354-365 | ||
| t(21q22.1) | 3 | 2-7 | Favorable | Le Beau 2002 Blood 102:43 | Grimwade Blood 2001;98:1312-1320; Frohling Blood 2006;108:3280-3288; Grimwade Blood 2010;116(3):354-365 | ||
| Gene mutation | t-MN frequency (%) | de novo AML frequency (across karyotypes) (%) | Recurrent in CHIP | t-MN references | de novo AML references | ChIP references | |
| ABC family | 14 | 4 | Wong 2015 Nature 518:552 | Wong 2015 Nature 518:552 | |||
| ASXL1 | 3-17 | 3-11 | Yes | Wong 2015 Nature 518:552; Lindsley 2015 Blood 125:1367; Shih 2013 Hematologica 98(6):908 | TCGA N Engl J Med 2013;368:2059-74; Chou Blood 2010;116(20):4086-4094 | Genovese 2014 N Engl J Med 371:2477-87; Jaiswal 2014 N Engl J Med 371:2488-98; Xie 2014 Nature Medicine 20:1472–1478; McKerrell 2015 Cell Reports 10:1239–1245 | |
| BCOR | 1-3 | 1 | Yes | Lindsley 2015 Blood 125:1367; Wong 2015 Nature 518:552 | TCGA N Engl J Med 2013;368:2059-74 | ||
| CBL | 2-4 | 1 | Yes | Wong 2015 Nature 518:552; Lindsley 2015 Blood 125:1367 | TCGA N Engl J Med 2013;368:2059-74 | Genovese 2014 N Engl J Med 371:2477-87; Jaiswal 2014 N Engl J Med 371:2488-98; Xie 2014 Nature Medicine 20:1472–1478; McKerrell 2015 Cell Reports 10:1239–1245 | |
| CEBPA | 0-5 | 6-9 | Christiansen 2005 Leukemia 19(12):2232; Lindsley 2015 Blood 125:1367 | TCGA N Engl J Med 2013;368:2059-74; Patel N Engl J Med 2012;366:1079-89 | |||
| CUX1 | 2 | 0-1 | Yes | Lindsley 2015 Blood 125:1367 | TCGA N Engl J Med 2013;368:2059-74; Wong 2014 Nature Genetics 46, 33–38 | ||
| DNMT3A | 8-27 | 14-25 | Yes | Lindsley 2015 Blood 125:1367; Wong 2015 Nature 518:552; Shih 2013 Hematologica 98(6):908 | Hou Blood. 2012;119(2):559; TCGA N Engl J Med 2013;368:2059-74 | Genovese 2014 N Engl J Med 371:2477-87; Jaiswal 2014 N Engl J Med 371:2488-98; Xie 2014 Nature Medicine 20:1472–1478; McKerrell 2015 Cell Reports 10:1239–1245 | |
| ETV6 | 1-3 | 1-2 | Lindsley 2015 Blood 125:1367; Wong 2015 Nature 518:552 | TCGA N Engl J Med 2013;368:2059-74; Oncogene 2005 24, 4129–4137 | |||
| EZH2 | 3-4 | 2 | Lindsley 2015 Blood 125:1367; Wong 2015 Nature 518:552; Shih 2013 Hematologica 98(6):908 | TCGA N Engl J Med 2013;368:2059-74; Wang PLoS ONE 8(4): e61341 | |||
| FLT3 | 8-16 | 24-28 | No | Christiansen 2005 Leukemia 19(12):2232; Wong 2015 Nature 518:552; Lindsley 2015 Blood 125:1367 | Schnittger Blood 2002;100(1):59; TCGA N Engl J Med 2013;368:2059-74 | ||
| IDH1 | 3-5 | 8-10 | Voso 2013 Leukemia 27:982; Wong 2015 Nature 518:552; Shih 2013 Hematologica 98(6):908 | TCGA N Engl J Med 2013;368:2059-74; Paschka J Clin Oncol. 2010;28(22):3636. | |||
| IDH2 | 0-5 | 9-10 | Yes | Voso 2013 Leukemia 27:982; Wong 2015 Nature 518:552; Shih 2013 Hematologica 98(6):908 | TCGA N Engl J Med 2013;368:2059-74; Paschka J Clin Oncol. 2010;28(22):3636. | McKerrell 2015 Cell Reports 10:1239–1245 | |
| JAK2 | 0-1 | 1-2 | Yes | Desta 2006 Leukemia 20:547; Lindsley 2015 Blood 125:1367 | TCGA N Engl J Med 2013;368:2059-74; Levine 2005 Blood 106(10):3377 - 3379 | Genovese 2014 N Engl J Med 371:2477-87; Jaiswal 2014 N Engl J Med 371:2488-98; Xie 2014 Nature Medicine 20:1472–1478; McKerrell 2015 Cell Reports 10:1239–1245 | |
| KIT | 0-3 | 4-6 | Christiansen 2005 Leukemia 19(12):2232; Wong 2015 Nature 518:552; Lindsley 2015 Blood 125:1367 | TCGA N Engl J Med 2013;368:2059-74; Patel N Engl J Med 2012;366:1079-89 | |||
| KMT2A (ITD) | 3 | 5 | Bacher 2007 Hematologica 92:744-752 | Steudel 2003 Genes Chromosomes Cancer 3:237-51 | |||
| KRAS | 11 | 2-4 | Lindsley 2015 Blood 125:1367 | TCGA N Engl J Med 2013;368:2059-74; Patel N Engl J Med 2012;366:1079-89 | |||
| NF1 | 2-4 | 2 | Lindsley 2015 Blood 125:1367; Wong 2015 Nature 518:552 | TCGA N Engl J Med 2013;368:2059-74 | |||
| NPM1 | 4-16 | 27-35 | No | Andersen 2008 Leukemia 22(5):951; Wong 2015 Nature 518:552; Lindsley 2015 Blood 125:1367 | TCGA N Engl J Med 2013;368:2059-74; Falini N Engl J Med 2005;352:254-66 | Genovese 2014 N Engl J Med 371:2477-87; Jaiswal 2014 N Engl J Med 371:2488-98; Xie 2014 Nature Medicine 20:1472–1478; McKerrell 2015 Cell Reports 10:1239–1245 | |
| NRAS | 10-13 | 8-10 | Bacher 2006 Blood 107:3847; Lindsley 2015 Blood 125:1367 | TCGA N Engl J Med 2013;368:2059-74; Bacher 2006 Blood 107(10):3847-3853 | |||
| PHF6 | 1-3 | 3 | Lindsley 2015 Blood 125:1367; Wong 2015 Nature 518:552 | TCGA N Engl J Med 2013;368:2059-74; Van Vlierberghe 2011 Leukemia 25(1):130-4 | |||
| PTPN11 | 3-9 | 5 | Christiansen 2007 Gene Chrom Cancer 46(6)517; Wong 2015 Nature 518:552; Lindsley 2015 Blood 125:1367 | TCGA N Engl J Med 2013;368:2059-74 | |||
| RAD21 | 4 | 1-2 | Lindsley 2015 Blood 125:1367 | TCGA N Engl J Med 2013;368:2059-74; Thol Blood 2014;123(6):914-920 | |||
| RUNX1 | 11-16 | 6-13 | No | Christiansen 2004 Blood 104:1474; Lindsley 2015 Blood 125:1367; Wong 2015 Nature 518:552 | TCGA N Engl J Med 2013;368:2059-74, Gaidzik2011 J Clin Oncol 29(10):1364; Tang 2009 Blood 114(26):5352. | ||
| SETBP1 | 3 | 0-1 | Fabiani 2015 Haematologica 99:e153; Lindsley 2015 Blood 125:1367 | TCGA N Engl J Med 2013;368:2059-74; Thol 2013 Leukemia 27:2072–2075 | |||
| SF3B1 | 0-3 | 1-5 | Yes | Lindsley 2015 Blood 125:1367; Shih 2013 Hematologica 98(6):908 | TCGA N Engl J Med 2013;368:2059-74; Papaemmanuil 2011 N Engl J Med 365:1384-95 | Genovese 2014 N Engl J Med 371:2477-87; Jaiswal 2014 N Engl J Med 371:2488-98; Xie 2014 Nature Medicine 20:1472–1478; McKerrell 2015 Cell Reports 10:1239–1245 | |
| SMC1A | 3 | 1-4 | Lindsley 2015 Blood 125:1367 | TCGA N Engl J Med 2013;368:2059-74; Thol Blood 2014;123(6):914-920 | |||
| SMC3 | 2 | 1-4 | Lindsley 2015 Blood 125:1367 | TCGA N Engl J Med 2013;368:2059-74; Thol Blood 2014;123(6):914-920 | |||
| SRSF2 | 8-11 | 1 | Yes | Lindsley 2015 Blood 125:1367; Shih 2013 Hematologica 98(6):908 | TCGA N Engl J Med 2013;368:2059-74 | Genovese 2014 N Engl J Med 371:2477-87; Jaiswal 2014 N Engl J Med 371:2488-98; Xie 2014 Nature Medicine 20:1472–1478; McKerrell 2015 Cell Reports 10:1239–1245 | |
| STAG2 | 5-6 | 1-3 | Lindsley 2015 Blood 125:1367; Wong 2015 Nature 518:552 | TCGA N Engl J Med 2013;368:2059-74; Thol Blood 2014;123(6):914-920 | |||
| TET2 | 6-14 | 8-27 | Yes | Lindsley 2015 Blood 125:1367; Wong 2015 Nature 518:552; Shih 2013 Hematologica 98(6):908 | TCGA N Engl J Med 2013;368:2059-74; Patel N Engl J Med 2012;366:1079-89: Chou 2011 Blood 118(14):3803-3810; Weissman 2012 Leukemia 26:934-942 | Genovese 2014 N Engl J Med 371:2477-87; Jaiswal 2014 N Engl J Med 371:2488-98; Xie 2014 Nature Medicine 20:1472–1478; McKerrell 2015 Cell Reports 10:1239–1245 | |
| TP53 | 23-37 | 2-12 | Yes | Christiansen 2001 JCO 19:1405; Wong 2015 Nature 518:552; Lindsley 2015 Blood 125:1367; Ok 2015 J Hematol Oncol 8:45; Shih 2013 Hematologica 98(6):908 | TCGA N Engl J Med 2013;368:2059-74; Patel N Engl J Med 2012;366:1079-89; Grossman 2012 Blood 120(15)2963-2972 | Genovese 2014 N Engl J Med 371:2477-87; Jaiswal 2014 N Engl J Med 371:2488-98; Xie 2014 Nature Medicine 20:1472–1478; McKerrell 2015 Cell Reports 10:1239–1245 | |
| U2AF1 | 5-8 | 4 | Yes | Wong 2015 Nature 518:552; Lindsley 2015 Blood 125:1367 | TCGA N Engl J Med 2013;368:2059-74 | Genovese 2014 N Engl J Med 371:2477-87; Jaiswal 2014 N Engl J Med 371:2488-98; Xie 2014 Nature Medicine 20:1472–1478; McKerrell 2015 Cell Reports 10:1239–1245 | |
| WT1 | 2-3 | 6-8 | Lindsley 2015 Blood 125:1367; Wong 2015 Nature 518:552 | TCGA N Engl J Med 2013;368:2059-74; Patel N Engl J Med 2012;366:1079-89 | |||
| ZRSR2 | 1 | 0 | Lindsley 2015 Blood 125:1367 | TCGA N Engl J Med 2013;368:2059-74 |
Key differences are highlighted in red and blue.
del(5q), −7/del(7q), and complex karytope can co-occur in the same patient; thus, these frequencies are partially overlapping.
Of note, deletions of 17p are also recurrent in de novo and t-MN. However 17p deletions are often cryptic and therefore underreported by conventional karyotyping. Thus del(17p) is not included in this table.
A striking 70% of t-MNs have deletions of the long arm of chromosomes 5, del(5q), and/or loss or deletion of chromosome 7, −7/del(7q)14. Long-standing efforts to identify a putative single TSG encoded within each of the commonly deleted regions were influenced initially by the dogma of Knudson’s two hit hypothesis and have been complicated more recently by the recognition of a large number of potentially cooperating candidate genes within the deleted segments, suggesting the existence of Contiguous Gene Syndromes (CGSs) within these loci (Figure 2). With the exception of EZH2 on 7q, 5q and 7q TSGs have haploinsufficient phenotypes, and there is rarely a second inactivating mutation of the remaining allele. Without a canonical “second hit” to identify the TSG(s), investigators mapped minimally deleted regions (MDRs) by examining large numbers of patients with myeloid neoplasms.
Figure 2. Contiguous gene syndrome regions on chromosomes 5 and 7.
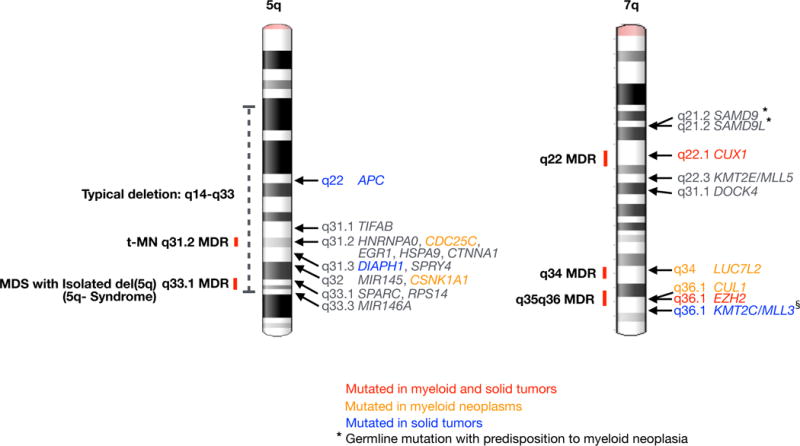
Minimally deleted regions (MDRs) on the long arms of chromosomes 550,51 and 7143–145 are shown. In t-MN, there is evidence for a role for haploinsufficiency of the following genes on 5q: APC53, TIFAB146, and EGR1147. HNRNPA0148, HSPA9149, DIAPH1150, and SPRY4151 have been implicated based on mouse models, and mutations of CDC25C152 have been identified in FPD/AML (familial platelet disorder progressing to AML). CTNNA1153 has been implicated in some, but not all, studies. MIR14555, MIR146A55, CSNK1A157, SPARC154, and RPS1454 have been shown to be involved in the pathogenesis of MDS with an Isolated del(5q). On 7q, there is evidence for a role in myeloid neoplasia for these genes: SAMD974, SAMD9L71,72, CUX165, KMT2E155–157, DOCK4158 LUC7L268, CUL168, EZH2159, and KMT2C70. Blue text indicates genes significantly, recurrently mutated in pan-cancer analysis160. Orange text indicates genes recurrently mutated in myeloid neoplasms. Red text indicates genes recurrently mutated in both myeloid and pan-cancer. § KMT2C/MLL3 mutations may be overestimated due to a pseudogene causing false positive mutations161. * Genes with inherited mutations that are associated with a predisposition to myeloid dysplasia are indicated.
A CGS on the long arm of chromosome 5 (5q)
There are two MDRs on chromosome 5q: 5q31.2 in patients with t-MN, AML, de novo, and high-risk MDS50; and 5q32 in those with the “5q- syndrome”, also known as MDS with an isolated del(5q)51. Although earlier studies focused on genes in the MDRs, it is becoming clear that genes outside the MDR also contribute to disease. Moreover, the deletion in virtually all patients is large (~70 Mb) spanning 5q14-q33, and encompassing both MDRs, making it challenging to identify the involved genes50,52. Haploinsufficient genes implicated in the del(5q) drive distinct disease characteristics, namely anemia (RPS14 and APC), megakaryocytic dysplasia (MIR145 and MIR146A), HSC expansion (EGR1, APC, and CSNK1A1), and clonal dominance (CSNK1A1)53–57. Including APC, 5q14-q33 contains a total of seventeen genes encoding components and regulators of WNT signaling, a pathway integral to hematopoiesis and leukemogenesis58.
A CGS describes a disease caused by multiple dose-sensitive genes within a genomic interval59 in which en bloc segmental deletion is more pathogenic than inactivation of any single gene. Supporting this, Trp53 reduction combined with haploinsufficiency of the 5q-encoded gene, Egr1, does not lead to overt leukemia in mice. However, Trp53 reduction in combination with haploinsufficiency of two 5q-encoded genes, Apc and Egr1, does60. CGSs in cancer are found in other recurring deletions in myeloid neoplasms, i.e. del(7q), del(20q), and deletions encompassing TP53 at 17p13.161, RB1 at 13q62, and MYC at 8q24.2163, to name a few, and may be relevant to the large segmental deletions characteristic of the common epithelial tumors, such as breast, colon, and lung carcinomas64.
A CGS on 7q
Chromosome arm 7q contains three MDRs. At 7q22, CUX1 is a haploinsufficient TSG that is mutated recurrently in hematopoietic malignancies and solid tumors65,66. The genetic evidence for CUX1 acting as a TSG is strong, as heterozygous CUX1 inactivating mutations are independently associated with a poor prognosis66. Heterozygous deletion of a 2 Mb syntenic interval near Cux1 led to features of MDS in mice, demonstrating that 7q22 is also a CGS region67. 7q34 contains LUC7L2, which encodes a spliceosomal protein that is mutated in myeloid malignancies68. A third MDR at 7q35-q36 contains CUL1 and EZH2; both genes have been reported to be somatically mutated68,69. This distal CGS segment also contains the haploinsufficient TSG, MLL370.
Monosomy 7 or large 7q deletions will include SAMD9L at 7q21.2, a gene that encodes an endosome fusion facilitator71. Inherited SAMD9L mutations cause Ataxia-pancytopenia syndrome and a predisposition for AML with monosomy 772. These patients have been observed to develop mosaic 7q loss of heterozygosity in their peripheral blood cells, leading to loss of the mutant SAMD9L allele72. This is intriguing because revertant mosaicism of chromosome 7 is also reported in Shwachman– Diamond syndrome73, a syndrome linked to SBDS gene mutations at 7q11.21 and a predisposition to AML with −7/del(7q). Adaptation by aneuploidy is also reported in patients with SAMD9 mutations with a predisposition to monosomy 7 MDS74. SAMD9 encodes a SAMD9L paralog and is located on chromosome band 7q21.2. The mutated SAMD9 and SAMD9L proteins in these patients were found to restrict cell growth more than their wild-type counterparts. Thus, those cases exhibiting loss of heterozygosity of chromosome 7 carrying the mutant allele may have been an adaptation to the growth-restriction. It is tempting to speculate that monosomy 7 in some diseases with a predisposition to AML with −7/del(7q) is a consequence of pressure for revertant mosaicism.
Somatic gene alterations
NGS of genomes has yielded surprising results and transformed our understanding of the etiology and pathogenesis of t-MN. The most comprehensive study published to date analyzed the whole genomes of 22 t-MN patients, together with the analysis of 149 AML/MDS-related genes in an additional 89 patients75. The expectation was that because all 22 patients had been exposed to chemotherapy and/or radiation therapy for their primary diseases, the burden of somatic mutations would be greater than that found in de novo AML due to the ensuing DNA damage75. Surprisingly however, the number of single nucleotide variants (SNVs), small insertions and deletions (indels), as well as copy number alterations (CNAs) was similar in t-MN compared to de novo AML, with each t-MN genome carrying ten SNVs or indels in coding regions. Overall, this is one of the lowest mutational burdens across human cancers76. We also noted a low mutational load in the exome and RNA-sequencing analysis of ten t-MN cases77. A study of the mutations in fifty-three genes in seventy t-MN patients similarly found that the mutation rate was comparable to that of de novo AML/MDS78. These findings are contrary to the historical premise that t-MN arises largely due to chemotherapy/radiation-induced mutations.
Furthermore, if chemotherapy drives somatic changes in t-MN, it would be expected to leave a signature in the spectra of mutations. Alkylating agents preferentially induce transition-type mutations79 and this signature is apparent in glioblastomas in patients who were pretreated with alkylating agents prior to surgical resection76. Despite the fact that at least half of the t-MN patients had a history of alkylating agent exposure, the frequency of transitions was similar in t-MN patients compared to de novo AML75. Thus the lack of a chemotherapy signature, combined with the surprisingly low mutational load, suggests that treatment-induced mutation is not the only, or major, driver of t-MN. In addition, the low number of DNA base-level mutations raises the question of whether large-scale genomic alterations, such as chromosomal deletions or balanced translocations, may be the critical defects in the pathobiology of t-MN.
Nonetheless, it cannot be ruled out from these studies that chemotherapy induces mutations in some cases. For example, there is a clear relationship and mechanism for topoisomerase-II inhibitor-induced balanced translocations (Figure 3)14,80. Alkylating agents can cause double-strand DNA breaks, which can lead to a chromosomal deletion. On average, seven somatic CNAs are identified in t-MN patients who received prior alkylating agent therapy (James Downing and Joy Nakitandwe, unpublished data), whereas CNAs are infrequent in the topoisomerase II inhibitor subset75. CNAs are skewed 2:1 in favor of loss over gain of chromosomal material, with patients with del(5q) showing a 2-fold increase over the average, consistent with the association with a complex karyotype.
Figure 3. Both intrinsic and extrinsic factors contribute to the development of t-MN.
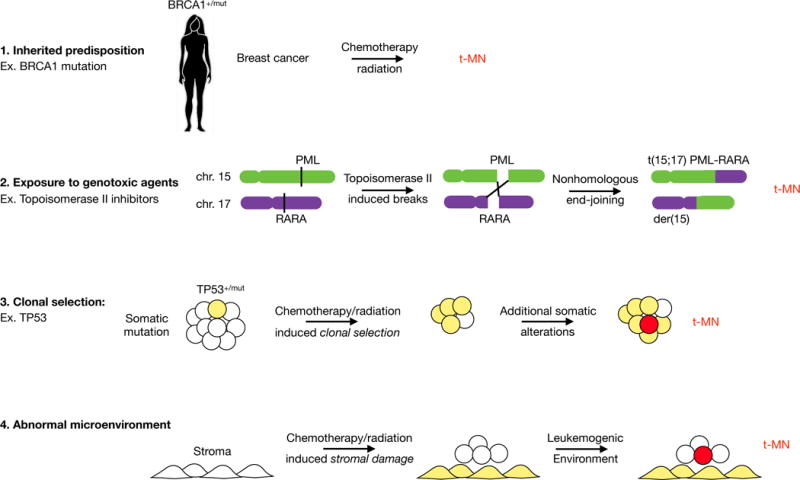
There are four main drivers for therapy-related myeloid neoplasia development. These pathways are not mutually exclusive, and one or multiple pathways may contribute in any individual patient. 1. Patients with an inherited mutation in a gene encoding a component of the DNA damage and repair response pathway have an increased susceptibility to the development of multiple, independent malignancies. In addition, these patients may have increased susceptibility to chemotherapy/radiation-induced mutations due to an impaired DNA damage response or DNA repair pathway. 2. The role for therapy as a mutagen is illustrated. In the prevailing model of t-MN, chemotherapy/radiation induces DNA damage that leads to transformation. An example of this is topoisomerase-II inhibitor induced translocations. 3. The role for therapy as a driver of clonal selection is shown. In patients with a pre-existing somatic mutation and clonal hematopoiesis, i.e., clonal hematopoiesis of indeterminate potential, chemotherapy/radiation gives these clones a competitive advantage over normal HSCs. The consequences of the somatic mutation – genetic instability associated with mutant TP53, for example – combined with regenerative hematopoiesis facilitates the acquisition of subsequent mutations and t-MN development. 4. Chemotherapy/radiation also induces damage to the bone marrow stromal niche. Alternatively, the bone marrow microenvironment may be altered/damaged due to normal processes, e.g., aging. Altered niche function, such as pro-inflammatory response, may promote clonal selection and/or produce factors that favor leukemia initiating cells.
In addition to a comparable number of mutations and type of mutation, a growing number of studies report that the mutated genes and pathways, i.e., spliceosome genes, chromatin modifiers, transcription factors, and receptor tyrosine kinase and signaling pathways, are completely overlapping in t-MN and de novo AML (Table 2). Ebert and colleagues report that the overall spectrum of mutated genes in t-MN is indistinct from de novo AML47; however, t-MN somatic mutations were more akin to de novo AML with the same cytogenetic changes, than to other t-MNs. Thus, the emerging pattern is that when the analyses control for karyotype, de novo AML and t-MN are indistinguishable at the genetic level. In other words, t-MNs have a significantly higher frequency of high-risk karyotypes (complex karyotypes, abnormalities of chromosomes 5 and/or 7 are seen in ~70% vs. 20% in AML de novo), but t-MNs with high-risk karyotypes are indistinguishable to the mutational, clinical, and morphologic profile of de novo AML with comparable high-risk karyotypes.
In t-MN, there are two general genetic pathways that account for the majority of cases. TP53 mutations define the first, occurring in up to 37% of t-MN81. t-MN and de novo AML with TP53 mutations are associated with del(5q) in ~80% of cases, complex karyotypes, resistance to therapy, and poor overall survival82. −7/del(7q) defines the second major subgroup of t-MN, occurring in 49% of patients14, and is associated with mutations that activate the RAS pathway in both de novo and t-MN77,83. Although this is also a poor prognostic subgroup, the development of RAS pathway inhibitors provides some therapeutic promise. There is partial overlap between the TP53 mutated subgroup and the −7/del(7q) subgroup, as −7/del(7q) may also occur in TP53 mutated cases, typically in the context of a del(5q) and complex karyotype14,77. The remaining t-MN cases that do not fall into these two ontogenies are akin to de novo counterparts (balanced translocations, normal karyotype with NPM1 and/or FLT3 mutations, etc.)47.
To date, there is no clear sequence of genetic events, and it is likely that multiple scenarios exist. TP53 mutations can be the initiating lesion in some t-MNs75,84. In MDS with a del(5q), the deletion is the initiating defect in up to 73% of cases, and TP53 mutations are acquired as a secondary cooperating mutation associated with a high risk of progression to AML85,86. Monosomy 7 occurs in the absence of recurrent gene mutations in most aplastic anemia-associated MDS cases87. Future studies to illuminate the sequence of events, and how the order of mutations alters the disease phenotype will be informative.
The role of clonal hematopoiesis
In 1993, Cachia et al., reported a higher frequency of clonal hematopoiesis in patients who had received cytotoxic therapy for lymphoma, and presciently suggested that these patients should be followed prospectively for t-MN development88. More recent reports suggest that up to 15% of breast and/or ovarian cancer patients treated with one round of chemotherapy, and 27% of patients who received two rounds of chemotherapy develop clonal hematopoiesis89–91. Clonal haematopoiesis of indeterminate potential (CHIP) is the presence of a clonal population of hematopoietic cells with a somatic mutation in a gene associated with haematologic malignancies in the absence of morphological evidence of disease. The fundamental role of CHIP, in the pathogenesis of t-MN is becoming apparent92.
Almost 1% of healthy individuals harbor clonal, somatic, numerical, or structural chromosomal changes in the blood93–96. The frequency increases to 2-3% in those over age 6095,96, and some clones expand over time94,97. The types of abnormalities even include those found in hematopoietic malignancies, such as del(20q), del(13q), del(11q), trisomy 8 or, less commonly, del(5q) or del(7q),93,94,96. Not surprisingly, clonal mosaicism for structural rearrangements carries a ten-fold increased risk for a subsequent hematopoietic malignancy96,98.
NGS studies of peripheral blood lymphocytes identified gene-level, somatic mutations and evidence of CHIP, an increased incidence with age, and an association with subsequent hematologic cancer99–102. Ultra-sensitive sequencing revealed CHIP in 19/20 healthy individuals of 50-60 years of age103. The genes mutated in CHIP are also recurrently mutated in myeloid malignancies, for example, DNMT3A, ASXL1, TET2, and TP53.
How might pre-existing somatic mutations and CHIP relate to t-MN? Over twenty genes provide an engraftment advantage to HSCs when inactivated104, including DNMT3A in humans and Tet2 in mice105–107. We propose the following model: during chemotherapy/radiation, mutated HSC clones with a “fitness” advantage will preferentially survive and repopulate the hematopoietic compartment. That those mutations may also cause abnormal differentiation and genomic instability is a recipe for dysfunctional hematopoiesis and, ultimately, transformation. The relative risk of individual mutant genes and structural rearrangements for subsequent t-MN is an active area of investigation.
Recent reports established direct links between pre-existing somatic mutations and t-MN. Wong and colleagues identified somatic TP53 mutations in the blood of healthy individuals75. They, and others, demonstrated that TP53 mutations are detectable in the blood of some t-MN patients before exposure to chemotherapy for the primary malignant disease75,84. In addition, Trp53+/− HSCs in mice have a clonal advantage after chemotherapy/radiation75,108.
Expanding on this result, a retrospective study of t-MN patients identified CHIP in 10/14 (71%) patients at the time of the primary malignancy, prior to treatment109. Two additional retrospective studies report CHIP in 62-66% of t-MN patients at the time of the primary malignancy, although most of these patients had already received some treatment110,111. The positive predictive value of CHIP for the development of t-MN was 27-35%, and the negative predictive value was 89-98%, thereby providing the first potential biomarker for t-MN109,110. There is some indication that certain mutated CHIP genes are more predictive of subsequent t-MN. However, the number of patients studied is too small currently to achieve a consensus on which genes are more informative. Higher clonal frequency and more than one gene mutation also indicated a greater risk of t-MN. Whether the presence of multiple mutations occurs within the same clone, and if this is clinically meaningful, remains unknown. In most cases, the mutation present in the CHIP clone was identified in the t-MN, and likely drove the pathogenesis of the myeloid neoplasm. However, in a few patients, the CHIP mutation was not present in the t-MN, suggesting that it may instead be a harbinger of a diseased bone marrow and/or genetic instability. In light of the finding that most individuals over the age of 50 may have CHIP103, it is imperative to define the features of CHIP that are clinically relevant and predictive of the development of subsequent myeloid neoplasia.
In summary, there is strong evidence that chemotherapy/radiation creates an environment that selects for pre-existing mutant clones at the expense of normal, healthy HSCs (Figure 4). This also partly explains why t-MNs are inherently treatment resistant. The mutant leukemia-initiating clones have already undergone one or more rounds of selection for increased “fitness” in response to chemotherapy/radiation.
Figure 4. Model for the role of clonal selection in the etiology of high-risk myeloid neoplasms.
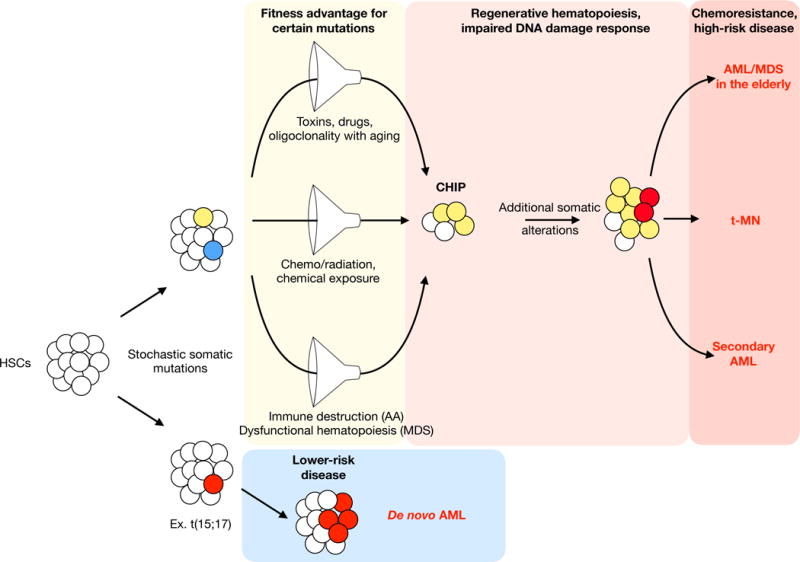
Stochastic mutations occur in hematopoietic stem cells over time. Certain mutated genes provide a “fitness” advantage in the context of various competitive conditions. Competition filters for mutant HSCs at the expense of healthy HSCs, resulting in clonal hematopoiesis of indeterminate potential (CHIP). Over time, mutant clones can acquire additional mutations due to mutations in the DNA damage response genes and/or increased proliferation in the context of regenerative hematopoiesis. In hematopoiesis, competition arises in a number of different contexts. Loss of HSC diversity with age, and the cumulative lifetime exposure to toxins and drugs, among other factors, may select for mutant clones that ultimately give rise to myeloid neoplasms in the elderly. Chemotherapy and radiation exposure promotes therapy-related myeloid neoplasms. Inflammation, immune destruction, and dysfunctional hematopoiesis (including niche-based effects) can give rise to secondary myeloid neoplasms arising from aplastic anemia or myelodysplastic syndrome. Regardless of the selective pressure, the competitive filter increases the likelihood that the malignant clones will have inherent therapy resistance. In contrast, a stochastic mutation that gives rise to AML without an antecedent clonal selection is more likely to be lower-risk disease.
It could be argued that clonal selection is the origin of other high-risk myeloid neoplasms with inherent chemoresistance (Box 1). AML in the elderly has high-risk clinical and genetic features often indistinguishable from t-MN49. In this case, HSC oligoclonality associated with normal aging and increased potential for chemical/environmental exposures during a lifetime may drive HSC selection. Clonal competition may arise during regenerative hematopoiesis driven by normal processes, such as aging, inflammation, immune destruction, viral infections, defects in the niche, and/or dysfunctional hematopoiesis, as found in aplastic anemia and MDS. Indeed, CHIP occurs in 47-73% of patients with aplastic anemia, a patient population with known risk of developing AML/MDS with high-risk cytogenetic features112–114. Likewise, secondary AML arising from MDS has high-risk features akin to t-MN48.
Box 1. Tenets of the clonal selection model of cancer.
Somatic mutations occur in tissue stem cells.
The prevalence of mutations accumulates with age.
Some mutated genes provide a “fitness” advantage.
Competitive conditions select for mutated clones.
In myelopoiesis, competition may arise from diverse causes: regenerative hematopoiesis, chemotherapy, radiation, chemical exposure, infections, inflammation, immune destruction (AA, PNH), oligoclonal HSCs associated with aging, defects in the niche, and dysfunctional hematopoiesis (MDS, AA).
Clones acquire additional mutations due to increased divisions and/or DNA damage response pathway inactivation.
The malignant clones have inherent therapy resistance because they have already undergone one or more rounds of selection for increased “fitness” in response to competitive pressures.
Role of the bone marrow niche
Recent studies highlight the role of the complex bidirectional crosstalk between HSCs and the bone marrow niche in normal hematopoiesis as well as in the pathogenesis of myeloid diseases. Multiple cell types contribute to the niche, including various mesenchymal stromal cell (MSC) populations, and progeny cells derived from MSCs, such as osteoblasts. Although not fully understood, emerging data suggest that niche alterations play a role in the pathogenesis of myeloid neoplasms115–118. Functional defects of the MDS/AML niche have been noted, such as a decrease in production of HSC-supportive factors119,120, and may in part, account for the poor results of HSC transplantation in t-MN and high-risk MDS/AML. Medyouf et al. showed that MSCs from MDS patients have a disturbed differentiation program and are essential for the propagation of MDS stem cells (CD34+, CD38−) in xenografts. Healthy MSCs adopted MDS MSC-like molecular features when exposed to MDS HSCs, via niche reprogramming120. Conversely, other studies in mice revealed that genetic changes in MSCs (Crebbp+/−, Rara−/−, Apcdel/+) or osteoblasts (Dicer1−/−) led to the development of MDS/AML116,118,121,122.
In the last decade, alterations in several cellular pathways in the bone marrow niche have been implicated in the etiology of myeloid diseases. Canonical Wnt signaling plays a role in the regulation of hematopoiesis and the aberrant renewal of leukemia stem cells, and in maintaining the function of the BM niche123,124. Gene expression profiling of hematopoietic cells has identified Wnt pathway activation in MDS, AML, and t-MN with a del(5q)58,125,126. Deregulation of WNT signaling/CTNNB1 in cancer has been correlated with genomic instability, raising the possibility that this pathway contributes to genomic instability and complex karyotypes characteristic of this subtype of t-MN. In parallel, activation of CTNNB1, the nuclear mediator of WNT signaling, was observed in niche osteoblastic cells with resultant increased Notch signaling in HSCs in ~40% of MDS/AML patients studied, most (80%) of whom had del(5q) and/or −7/del(7q)127.
In elegant work using mouse models of MDS, Zambetti et al established mechanistic links between inflammation and cancer128. Specifically, they demonstrated that overexpression of the DAMP genes, S100A8/S100A9, in the mesenchymal niche cells drives genotoxic stress in HSCs via activation of the TP53-S100A8/9-TLR4 axis. Moreover, transcriptional activation of this signaling axis in the niche predicted progression to AML and survival in patients with MDS, providing a rationale for therapeutic targeting of the niche-based inflammatory signaling in some myeloid disorders128.
What is the role of cytotoxic therapy in this process? The answer is likely to be complex, as cytotoxic therapy has been shown to have a number of effects on the bone marrow microenvironment, including a pro-inflammatory response and release of inflammatory cytokines, e.g., TNFA, TGFB, and IL-6, release of reactive oxygen species by MSCs with resultant genotoxic damage to HSCs, injury to sympathetic nerves, and bone marrow niche remodeling. In a mouse model of t-MN, based on haploinsufficiency of two del(5q) genes, Egr1 and Apc, together with knockdown of Trp53, Stoddart et al observed a high frequency of myeloid diseases following treatment of both the hematopoietic cells and the bone marrow stroma with an alkylating agent, but not after treatment of either alone, reinforcing the role of the intricate bidirectional interplay between mutant HSCs and MSCs in myeloid diseases122. Link and Walter proposed that HSC-extrinsic factors, such as cytotoxic therapy, toxins, infection/inflammation, or autoimmunity – processes known to impact the niche – may reduce the size of the HSC pool transiently and contribute to clonal selection of mutant HSCs and subsequent disease development129. There is strong evidence that cytotoxic therapy creates an environment that selects for pre-existing mutant clones at the expense of normal, healthy HSCs. In this context, DNA damage-induced competition led to a selective advantage of HSCs and progenitor cells with reduced Trp53 function (and possible clonal expansion of emerging cancer cells) in mouse bone marrow chimeras – reminiscent of the CHIP phenotype – via growth arrest and senescence-related gene expression in cells with higher Trp53 activity108. Interestingly, cell competition based on reduced Trp53 levels was increased with lower proportions of Trp53-deficient cells. Moreover, genes involved in cell:cell interactions with the environment, i.e., adhesion and migration, were differentially expressed in the HSCs with a clonal selective advantage, implicating a role for Trp53 levels in mediating a gene expression profile in HSCs that alters interactions with the stroma. This “clonal selection model” is a paradigm shift and will impact how we understand the biology of t-MN, how we alter treatment to prevent it, and how we screen for it.
In summary, what has emerged from studies in mouse models and in patients is that treatment-induced mutations in HSCs are not the only driver of t-MN and additional factors, such as niche-based changes, also influence disease pathobiology. That is, BM stromal changes, and the formation of a malignant niche is not merely a consequence of the malignant process, but contributes directly to the pathogenesis of the disease, making MDS, AML, and t-MN unique diseases of the “tissue”.
Prognosis
The outcome for t-MN patients is poor with a 5-year survival rate of 10%. In the largest single institution study of 303 t-MN patients ascertained between 1972-2001, the median survival was 8.0 months14. Two decades later, a modest improvement in survival (14.6 months) was reported in a multicenter study of 277 patients recruited between 1999-201310. Older age at t-MN diagnosis, unfavorable karyotype (Table 2), low hemoglobin, and low platelet counts portend worse outcome10.
Compared to patients with de novo AML, t-MN patients are more likely to have high-risk karyotypes, comorbidities, and poor performance status130. In a study that adjusted for these confounding factors, it was found that among patients 60 years or older, with a high-risk karyotype, and undergoing intensive therapy, t-MN patients had a similar outcome compared to de novo AML130. This suggests that these diseases are biologically similar in older patients. For younger patients and patients with favorable-risk karyotypes, t-MN is an independent adverse prognostic indicator130–132.
Allogeneic hematopoietic stem cell transplantation (HSCT) significantly improves patient survival to 58.8 months and is the only potentially curative treatment, but has been performed in under 20% of cases10. t-MN patients are often excluded as candidates for allogeneic HSCT due to poor performance status, advanced age, and the lack of a matched donor. For those patients who receive a transplant, overall survival is 38% at five years and 24% at ten years133. Emerging data indicate that not all patients may benefit from transplantation – TP53 mutated MDS patients have a median overall survival of just 4.6 months after HSCT134. This is sobering news as up to 40% of t-MN patients have TP53 mutations81. On the other hand, the addition of decitabine to transplant regimens may particularly benefit patients with TP53-mutant AML/MDS135.
Therapeutic implications
The knowledge gained in t-MN etiology opens up preventative and therapeutic opportunities, but raises a number of new questions. The burden of rare, inherited, deleterious variants needs to be characterized fully by performing genome-wide analyses in cohorts of t-MN patients with and without a family history of cancer. Prospective trials of cancer patients are necessary to ascertain the genetic risks of subsequent t-MN definitively, with the caveat that the risk of t-MN is strongly influenced by the therapeutic regimen and will therefore change over time. These studies should determine the degree to which germline mutations in t-MN susceptibility genes correlate with subsequent t-MN.
We also need to perform prospective trials to define the extent to which CHIP can be used as a biomarker for t-MN risk stratification. Specific questions in this area include determining which genes and individual genetic changes, at what clonal frequencies, the impact of multiple gene mutations, and possibly the specific combinations of mutations, confer the highest t-MN risk? Sensitive genomic assays should also be performed to identify low frequency clonal aneuploidy, as this may also prove predictive of t-MN. Ultimately, data addressing these questions should inform treatment decisions for at-risk patients at the time of the primary malignancy and provide a molecular test for long-term monitoring.
Based on the findings of such studies, therapies for the primary malignant disease could be tailored to decrease the risk of t-MN – for example, by avoiding or decreasing the dose of alkylating agents in genetically susceptible populations, and/or continued reduction of radiation fields and dosages. Perhaps allogeneic HSCT donors should be screened for the presence of CHIP, and autologous HSCT should be avoided in patients with CHIP111,136. We also expect that non-cytotoxic therapies will be less leukemogeneic. For instance, differentiation therapy promotes maturation of cancer stem cells and would not eliminate healthy HSCs. Based on the emerging picture of alterations of the niche, future chemoprevention studies targeting niche alterations, e.g., WNT signaling, inflammatory signaling, or the TP53-mediated stress response, to reduce the risk in individuals with CHIP, may be warranted.
Given that a proportion of t-MN derives from clonal selection of mutant HSCs, efforts could be directed towards preserving their healthy HSCs during treatment of the primary cancer. One speculative approach to accomplish a “clonal switch”137 is a homeopathic approach of “like cures like”. For example, temporarily inhibiting Trp53 during radiation treatment in mice138 levels the playing field such that normal HSCs are not out-competed by HSCs with knockdown of Trp53 (Figure 5). A similar strategy could be devised for other CHIP mutations. Another therapeutic opportunity is afforded by the high prevalence of del(5q) and −7/del(7q), in which the cellular requirement for a normal gene dosage of essential genes within the CGS may create the opportunity to target vulnerabilities due to a reduction in the level of a protein product of a haploinsufficient gene, as in the case of ubiquitin-mediated degradation of CSNK1A1 (casein kinase 1A1) induced by lenalidomide, creating a therapeutic window for the affected cells in MDS with an Isolated del(5q)139–141
Figure 5. A hypothetical approach to preserve healthy hematopoietic stem cells during chemotherapy and/or radiation therapy.
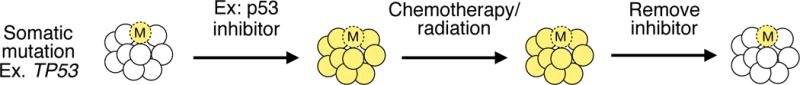
A proportion of t-MN derives from clonal selection of hematopoietic stem cells (HSCs) carrying somatic mutations (indicated by an “M” in the illustration) at the expense of healthy HSCs during treatment of the primary cancer. One hypothetical approach towards preserving the healthy HSCs is to temporarily recapitulate the mutation in the healthy HSCs, such that no HSC clone has a “fitness” advantage over the others. For example, in patients with a somatic TP53 mutation, a TP53 inhibitor administered during chemotherapy/radiation treatment would prevent normal HSCs from being out-competed by TP53-mutant HSCs. A similar strategy could be devised for other CHIP mutations.
Summary and future directions
Recent studies have provided remarkable new discoveries on the pathobiology of t-MN along the entire timeline of t-MN ontogeny. Inherited mutations in the DNA repair pathway are associated with t-MN development in a small subset of patients. Pre-existing somatic mutations acquired prior to treatment are selected for by chemotherapy/radiation. The mutant leukemia-initiating clones have previously undergone one or more rounds of selection for increased “fitness” in response to therapy, and hence, are chemoresistant. Altered function of the bone marrow niche may precede cytotoxic therapy, or treatment may damage the microenvironment, providing another source for selecting for the outgrowth of preleukemic clones. Subsequent somatic mutations in t-MN are shared with other high-risk myeloid neoplasms, indicative of a shared etiology. Finally, haploinsufficiency and CGSs are now recognized as major drivers of disease. In the future, we anticipate that other secondary cancers will follow a parallel etiologic pathway. Indeed, primary cancers in general likely have similar contributions from genetic predisposition, somatic clonal mosaicism [reviewed in142], and environment.
Despite these significant strides, many unanswered questions remain. It is essential to continue to classify t-MN separately from de novo AML, so that these questions can be addressed. What is the mechanism for clonal dominance? For example, it should be determined if CHIP genes alter proliferation, quiescence, senescence, apoptosis, or some other pathway to increase “fitness”. Do certain CHIP genes have increased fitness only in certain contexts? Why do some chemotherapeutic agents promote competition and not others? Does this correlate with the extent that the DNA-damage responses are triggered? What is the full compendium of involved genes on chromosomes 5 and 7, and how do 5q- and 7q-encoded genes interact to drive hematopoietic transformation and promote clonal outgrowth? Has the possible role of non-coding genes on 5q and 7q been fully elucidated? Are there endophenotypes of CGS deletions? What is the sequence of genetic events in t-MN, and does the sequence influence the disease phenotype? What is the mechanism(s) of bone marrow niche involvement? What is the spectrum of therapeutics targets? What is the potential for targeting the bone marrow niche, or employing combination therapy targeting both the HSCs and the niche? Although these are complex problems, they are tractable. After decades of little progress in improving clinical outcome, we now foresee a future where we can predict, prevent, and treat t-MN.
Acknowledgments
The authors thank Angela Stoddart and Kevin M. Shannon for critical reading of the manuscript. MEM is supported by NIH 1K08CA181254, The V Foundation for Cancer Research (V Foundation Scholar Award), the University of Chicago Medicine Comprehensive Cancer Center CCSG (P30 CA14599), Institutional Research Grant (IRG-58-004-53-IRG) from the American Cancer Society, and the University of Chicago Cancer Research Foundation Auxiliary Board. LAG is supported by grants from the Edward P. Evans Foundation, the Taub Foundation, the Leukemia and Lymphoma Society, and the Cancer Research Foundation. MML is supported by grants from NIH (CA190372) and the Edward P. Evans Foundation.
Footnotes
Conflict of interest statement. The authors have no conflicts of interest to declare.
References
- 1.Singh ZN, et al. Therapy-related myelodysplastic syndrome: morphologic subclassification may not be clinically relevant. American Journal of Clinical Patholology. 2007;127:197–205. doi: 10.1309/NQ3PMV4U8YV39JWJ. [DOI] [PubMed] [Google Scholar]
- 2.Wu S, Powers S, Zhu W, Hannun YA. Substantial contribution of extrinsic risk factors to cancer development. Nature. 2016;529:43–47. doi: 10.1038/nature16166. [DOI] [PMC free article] [PubMed] [Google Scholar]
- 3.Schrader KA, et al. Germline variants in targeted tumor sequencing using matched normal DNA. JAMA Oncology. 2016;2:104–111. doi: 10.1001/jamaoncol.2015.5208. [DOI] [PMC free article] [PubMed] [Google Scholar]
- 4.Pritchard CC, et al. Inherited DNA-repair gene mutations in men with metastatic prostate cancer. N Engl J Med. 2016;375:443–453. doi: 10.1056/NEJMoa1603144. [DOI] [PMC free article] [PubMed] [Google Scholar]
- 5.Zhang J, et al. Germline mutations in predisposition genes in pediatric cancer. N Engl J Med. 2015;373:2336–2346. doi: 10.1056/NEJMoa1508054. [DOI] [PMC free article] [PubMed] [Google Scholar]
- 6.de Moor JS, et al. Cancer survivors in the United States: prevalence across the survivorship trajectory and implications for care. Cancer Epidemiol Biomarkers Prev. 2013;22:561–570. doi: 10.1158/1055-9965.EPI-12-1356. [DOI] [PMC free article] [PubMed] [Google Scholar]
- 7.Rowland JH, Bellizzi KM. Cancer survivorship issues: life after treatment and implications for an aging population. J Clin Oncol. 2014;32:2662–2668. doi: 10.1200/JCO.2014.55.8361. [DOI] [PMC free article] [PubMed] [Google Scholar]
- 8.De Roos AJ, et al. Incidence of myelodysplastic syndromes within a nonprofit healthcare system in western Washington state, 2005-2006. Am J Hematol. 2010;85:765–770. doi: 10.1002/ajh.21828. [DOI] [PubMed] [Google Scholar]
- 9.Hulegardh E, et al. Characterization and prognostic features of secondary acute myeloid leukemia in a population-based setting: a report from the Swedish Acute Leukemia Registry. Am J Hematol. 2015;90:208–214. doi: 10.1002/ajh.23908. [DOI] [PubMed] [Google Scholar]
- 10.Fianchi L, et al. Characteristics and outcome of therapy-related myeloid neoplasms: Report from the Italian network on secondary leukemias. Am J Hematol. 2015;90:E80–85. doi: 10.1002/ajh.23966. [DOI] [PubMed] [Google Scholar]
- 11.Morton LM, et al. Evolving risk of therapy-related acute myeloid leukemia following cancer chemotherapy among adults in the United States, 1975-2008. Blood. 2013;121:2996–3004. doi: 10.1182/blood-2012-08-448068. [DOI] [PMC free article] [PubMed] [Google Scholar]
- 12.Morton LM, et al. Risk of myeloid neoplasms after solid organ transplantation. Leukemia. 2014;28:2317–2323. doi: 10.1038/leu.2014.132. [DOI] [PMC free article] [PubMed] [Google Scholar]
- 13.Radivoyevitch T, et al. Defining AML and MDS second cancer risk dynamics after diagnoses of first cancers treated or not with radiation. Leukemia. 2016;30:285–294. doi: 10.1038/leu.2015.258. [DOI] [PubMed] [Google Scholar]
- 14.Smith SM, et al. Clinical-cytogenetic associations in 306 patients with therapy-related myelodysplasia and myeloid leukemia: the University of Chicago series. Blood. 2003;102:43–52. doi: 10.1182/blood-2002-11-3343. [DOI] [PubMed] [Google Scholar]
- 15.Wolff AC, et al. Risk of marrow neoplasms after adjuvant breast cancer therapy: the national comprehensive cancer network experience. J Clin Oncol. 2015;33:340–348. doi: 10.1200/JCO.2013.54.6119. [DOI] [PMC free article] [PubMed] [Google Scholar]
- 16.Eichenauer DA, et al. Therapy-related acute myeloid leukemia and myelodysplastic syndromes in patients with Hodgkin lymphoma: a report from the German Hodgkin Study Group. Blood. 2014;123:1658–1664. doi: 10.1182/blood-2013-07-512657. [DOI] [PubMed] [Google Scholar]
- 17.Armitage JO, et al. Treatment-related myelodysplasia and acute leukemia in non-Hodgkin’s lymphoma patients. J Clin Oncol. 2003;21:897–906. doi: 10.1200/JCO.2003.07.113. [DOI] [PubMed] [Google Scholar]
- 18.Smith MR, et al. Incidence of therapy-related myeloid neoplasia after initial therapy for chronic lymphocytic leukemia with fludarabine-cyclophosphamide versus fludarabine: long-term follow-up of US Intergroup Study E2997. Blood. 2011;118:3525–3527. doi: 10.1182/blood-2011-03-342485. [DOI] [PMC free article] [PubMed] [Google Scholar]
- 19.Ballinger ML, et al. Monogenic and polygenic determinants of sarcoma risk: an international genetic study. Lancet Oncol. 2016;17:1261–1271. doi: 10.1016/S1470-2045(16)30147-4. [DOI] [PubMed] [Google Scholar]
- 20.Bhatia S. Genetic variation as a modifier of association between therapeutic exposure and subsequent malignant neoplasms in cancer survivors. Cancer. 2015;121:648–663. doi: 10.1002/cncr.29096. [DOI] [PMC free article] [PubMed] [Google Scholar]
- 21.Churpek JE, et al. Inherited mutations in cancer susceptibility genes are common among survivors of breast cancer who develop therapy-related leukemia. Cancer. 2016;122:304–311. doi: 10.1002/cncr.29615. [DOI] [PMC free article] [PubMed] [Google Scholar]
- 22.Schulz E, et al. Germline mutations in the DNA damage response genes BRCA1, BRCA2, BARD1 and TP53 in patients with therapy related myeloid neoplasms. J Med Genet. 2012;49:422–428. doi: 10.1136/jmedgenet-2011-100674. [DOI] [PubMed] [Google Scholar]
- 23.Voso MT, et al. Fanconi anemia gene variants in therapy-related myeloid neoplasms. Blood Cancer Journal. 2015;5:e323. doi: 10.1038/bcj.2015.44. [DOI] [PMC free article] [PubMed] [Google Scholar]
- 24.Felix CA, et al. The p53 gene in pediatric therapy-related leukemia and myelodysplasia. Blood. 1996;87:4376–4381. [PubMed] [Google Scholar]
- 25.Felix CA, et al. Association of germline p53 mutation with MLL segmental jumping translocation in treatment-related leukemia. Blood. 1998;91:4451–4456. [PubMed] [Google Scholar]
- 26.Link DC, et al. Identification of a novel TP53 cancer susceptibility mutation through whole-genome sequencing of a patient with therapy-related AML. JAMA. 2011;305:1568–1576. doi: 10.1001/jama.2011.473. [DOI] [PMC free article] [PubMed] [Google Scholar]
- 27.Momota H, et al. Acute lymphoblastic leukemia after temozolomide treatment for anaplastic astrocytoma in a child with a germline TP53 mutation. Pediatr Blood Cancer. 2010;55:577–579. doi: 10.1002/pbc.22542. [DOI] [PubMed] [Google Scholar]
- 28.Vasanthakumar A, et al. Brca1 deficiency causes bone marrow failure and spontaneous hematologic malignancies in mice. Blood. 2016;127:310–313. doi: 10.1182/blood-2015-03-635599. [DOI] [PMC free article] [PubMed] [Google Scholar]
- 29.Ramus SJ, et al. Increased frequency of TP53 mutations in BRCA1 and BRCA2 ovarian tumours. Genes Chromosomes Cancer. 1999;25:91–96. doi: 10.1002/(sici)1098-2264(199906)25:2<91::aid-gcc3>3.0.co;2-5. [DOI] [PubMed] [Google Scholar]
- 30.Schuyer M, Berns EM. Is TP53 dysfunction required for BRCA1-associated carcinogenesis? Mol Cell Endocrinol. 1999;155:143–152. doi: 10.1016/s0303-7207(99)00117-3. [DOI] [PubMed] [Google Scholar]
- 31.Jacoby MA, et al. The DNA double-strand break response is abnormal in myeloblasts from patients with therapy-related acute myeloid leukemia. Leukemia. 2014;28:1242–1251. doi: 10.1038/leu.2013.368. [DOI] [PMC free article] [PubMed] [Google Scholar]
- 32.Maris JM, et al. Monosomy 7 myelodysplastic syndrome and other second malignant neoplasms in children with neurofibromatosis type 1. Cancer. 1997;79:1438–1446. [PubMed] [Google Scholar]
- 33.Chao RC, et al. Therapy-induced malignant neoplasms in Nf1 mutant mice. Cancer Cell. 2005;8:337–348. doi: 10.1016/j.ccr.2005.08.011. [DOI] [PubMed] [Google Scholar]
- 34.Choi G, et al. Genetically mediated Nf1 loss in mice promotes diverse radiation-induced tumors modeling second malignant neoplasms. Cancer Res. 2012;72:6425–6434. doi: 10.1158/0008-5472.CAN-12-1728. [DOI] [PMC free article] [PubMed] [Google Scholar]
- 35.Greene MH, et al. Melphalan may be a more potent leukemogen than cyclophosphamide. Ann Intern Med. 1986;105:360–367. doi: 10.7326/0003-4819-105-3-360. [DOI] [PubMed] [Google Scholar]
- 36.Curtis RE, et al. Risk of leukemia after chemotherapy and radiation treatment for breast cancer. N Engl J Med. 1992;326:1745–1751. doi: 10.1056/NEJM199206253262605. [DOI] [PubMed] [Google Scholar]
- 37.Travis LB, et al. Risk of leukemia after platinum-based chemotherapy for ovarian cancer. N Engl J Med. 1999;340:351–357. doi: 10.1056/NEJM199902043400504. [DOI] [PubMed] [Google Scholar]
- 38.Travis LB, et al. Treatment-associated leukemia following testicular cancer. J Natl Cancer Inst. 2000;92:1165–1171. doi: 10.1093/jnci/92.14.1165. [DOI] [PubMed] [Google Scholar]
- 39.TCGA. Genomic and epigenomic landscapes of adult de novo acute myeloid leukemia. N Engl J Med. 2013;368:2059–2074. doi: 10.1056/NEJMoa1301689. [DOI] [PMC free article] [PubMed] [Google Scholar]
- 40.Offman J, et al. Defective DNA mismatch repair in acute myeloid leukemia/myelodysplastic syndrome after organ transplantation. Blood. 2004;104:822–828. doi: 10.1182/blood-2003-11-3938. [DOI] [PubMed] [Google Scholar]
- 41.Waterman J, et al. Fludarabine as a risk factor for poor stem cell harvest, treatment-related MDS and AML in follicular lymphoma patients after autologous hematopoietic cell transplantation. Bone Marrow Transplant. 2012;47:488–493. doi: 10.1038/bmt.2011.109. [DOI] [PubMed] [Google Scholar]
- 42.Kim G, et al. FDA approval summary: olaparib monotherapy in patients with deleterious germline BRCA-mutated advanced ovarian cancer treated with three or more lines of chemotherapy. Clin Cancer Res. 2015;21:4257–4261. doi: 10.1158/1078-0432.CCR-15-0887. [DOI] [PubMed] [Google Scholar]
- 43.Lange RD, Moloney WC, Yamawaki T. Leukemia in atomic bomb survivors. I. General observations. Blood. 1954;9:574–585. [PubMed] [Google Scholar]
- 44.Travis LB, et al. Second malignant neoplasms and cardiovascular disease following radiotherapy. J Natl Cancer Inst. 2012;104:357–370. doi: 10.1093/jnci/djr533. [DOI] [PMC free article] [PubMed] [Google Scholar]
- 45.Nardi V, et al. Acute myeloid leukemia and myelodysplastic syndromes after radiation therapy are similar to de novo disease and differ from other therapy-related myeloid neoplasms. J Clin Oncol. 2012;30:2340–2347. doi: 10.1200/JCO.2011.38.7340. [DOI] [PMC free article] [PubMed] [Google Scholar]
- 46.Mukherjee S, et al. Risk for developing myelodysplastic syndromes in prostate cancer patients definitively treated with radiation. J Natl Cancer Inst. 2014;106:djt462. doi: 10.1093/jnci/djt462. [DOI] [PubMed] [Google Scholar]
- 47.Lindsley RC, et al. Acute myeloid leukemia ontogeny is defined by distinct somatic mutations. Blood. 2015;125:1367–1376. doi: 10.1182/blood-2014-11-610543. [DOI] [PMC free article] [PubMed] [Google Scholar]
- 48.Bello C, et al. Outcomes after induction chemotherapy in patients with acute myeloid leukemia arising from myelodysplastic syndrome. Cancer. 2011;117:1463–1469. doi: 10.1002/cncr.25598. [DOI] [PMC free article] [PubMed] [Google Scholar]
- 49.Appelbaum FR, et al. Age and acute myeloid leukemia. Blood. 2006;107:3481–3485. doi: 10.1182/blood-2005-09-3724. [DOI] [PMC free article] [PubMed] [Google Scholar]
- 50.Le Beau MM, et al. Cytogenetic and molecular delineation of the smallest commonly deleted region of chromosome 5 in malignant myeloid diseases. Proc Natl Acad Sci U S A. 1993;90:5484–5488. doi: 10.1073/pnas.90.12.5484. [DOI] [PMC free article] [PubMed] [Google Scholar]
- 51.Boultwood J, et al. Narrowing and genomic annotation of the commonly deleted region of the 5q- syndrome. Blood. 2002;99:4638–4641. doi: 10.1182/blood.v99.12.4638. [DOI] [PubMed] [Google Scholar]
- 52.Jerez A, et al. Topography, clinical, and genomic correlates of 5q myeloid malignancies revisited. J Clin Oncol. 2012;30:1343–1349. doi: 10.1200/JCO.2011.36.1824. [DOI] [PMC free article] [PubMed] [Google Scholar]
- 53.Wang J, Fernald AA, Anastasi J, Le Beau MM, Qian Z. Haploinsufficiency of Apc leads to ineffective hematopoiesis. Blood. 2010;115:3481–3488. doi: 10.1182/blood-2009-11-251835. [DOI] [PMC free article] [PubMed] [Google Scholar]
- 54.Ebert BL, et al. Identification of RPS14 as a 5q- syndrome gene by RNA interference screen. Nature. 2008;451:335–339. doi: 10.1038/nature06494. [DOI] [PMC free article] [PubMed] [Google Scholar]
- 55.Starczynowski DT, et al. Identification of miR-145 and miR-146a as mediators of the 5q- syndrome phenotype. Nat Med. 2010;16:49–58. doi: 10.1038/nm.2054. [DOI] [PubMed] [Google Scholar]
- 56.Min IM, et al. The transcription factor EGR1 controls both the proliferation and localization of hematopoietic stem cells. Cell Stem Cell. 2008;2:380–391. doi: 10.1016/j.stem.2008.01.015. [DOI] [PubMed] [Google Scholar]
- 57.Schneider RK, et al. Role of casein kinase 1A1 in the biology and targeted therapy of del(5q) MDS. Cancer Cell. 2014;26:509–520. doi: 10.1016/j.ccr.2014.08.001. [DOI] [PMC free article] [PubMed] [Google Scholar]
- 58.Stoddart A, Nakitandwe J, Chen SC, Downing JR, Le Beau MM. Haploinsufficient loss of multiple 5q genes may fine-tune Wnt signaling in del(5q) therapy-related myeloid neoplasms. Blood. 2015;126:2899–2901. doi: 10.1182/blood-2015-10-673228. [DOI] [PMC free article] [PubMed] [Google Scholar]
- 59.Schmickel RD. Contiguous gene syndromes: a component of recognizable syndromes. J Pediatr. 1986;109:231–241. doi: 10.1016/s0022-3476(86)80377-8. [DOI] [PubMed] [Google Scholar]
- 60.Stoddart A, et al. Haploinsufficiency of del(5q) genes, Egr1 and Apc, cooperate with Tp53 loss to induce acute myeloid leukemia in mice. Blood. 2014;123:1069–1078. doi: 10.1182/blood-2013-07-517953. [DOI] [PMC free article] [PubMed] [Google Scholar]
- 61.Liu Y, et al. Deletions linked to TP53 loss drive cancer through p53-independent mechanisms. Nature. 2016;531:471–475. doi: 10.1038/nature17157. [DOI] [PMC free article] [PubMed] [Google Scholar]
- 62.Parker H, et al. 13q deletion anatomy and disease progression in patients with chronic lymphocytic leukemia. Leukemia. 2011;25:489–497. doi: 10.1038/leu.2010.288. [DOI] [PubMed] [Google Scholar]
- 63.Tseng YY, et al. PVT1 dependence in cancer with MYC copy-number increase. Nature. 2014;512:82–86. doi: 10.1038/nature13311. [DOI] [PMC free article] [PubMed] [Google Scholar]
- 64.Solimini NL, et al. Recurrent hemizygous deletions in cancers may optimize proliferative potential. Science. 2012;337:104–109. doi: 10.1126/science.1219580. [DOI] [PMC free article] [PubMed] [Google Scholar]
- 65.McNerney ME, et al. CUX1 is a haploinsufficient tumor suppressor gene on chromosome 7 frequently inactivated in acute myeloid leukemia. Blood. 2013;121:975–983. doi: 10.1182/blood-2012-04-426965. [DOI] [PMC free article] [PubMed] [Google Scholar]
- 66.Wong CC, et al. Inactivating CUX1 mutations promote tumorigenesis. Nat Genet. 2014;46:33–38. doi: 10.1038/ng.2846. [DOI] [PMC free article] [PubMed] [Google Scholar]
- 67.Wong JC, et al. Functional evidence implicating chromosome 7q22 haploinsufficiency in myelodysplastic syndrome pathogenesis. Elife. 2015;4 doi: 10.7554/eLife.07839. [DOI] [PMC free article] [PubMed] [Google Scholar]
- 68.Hosono N, et al. Recurrent genetic defects on chromosome 7q in myeloid neoplasms. Leukemia. 2014;28:1348–1351. doi: 10.1038/leu.2014.25. [DOI] [PMC free article] [PubMed] [Google Scholar]
- 69.Ernst T, et al. Inactivating mutations of the histone methyltransferase gene EZH2 in myeloid disorders. Nat Genet. 2010;42:722–726. doi: 10.1038/ng.621. [DOI] [PubMed] [Google Scholar]
- 70.Chen C, et al. MLL3 is a haploinsufficient 7q tumor suppressor in acute myeloid leukemia. Cancer Cell. 2014;25:652–665. doi: 10.1016/j.ccr.2014.03.016. [DOI] [PMC free article] [PubMed] [Google Scholar]
- 71.Nagamachi A, et al. Haploinsufficiency of SAMD9L, an endosome fusion facilitator, causes myeloid malignancies in mice mimicking human diseases with monosomy 7. Cancer Cell. 2013;24:305–317. doi: 10.1016/j.ccr.2013.08.011. [DOI] [PubMed] [Google Scholar]
- 72.Chen DH, et al. Ataxia-pancytopenia syndrome Is caused by missense mutations in SAMD9L. Am J Hum Genet. 2016;98:1146–1158. doi: 10.1016/j.ajhg.2016.04.009. [DOI] [PMC free article] [PubMed] [Google Scholar]
- 73.Minelli A, et al. The isochromosome i(7)(q10) carrying c.258+2t>c mutation of the SBDS gene does not promote development of myeloid malignancies in patients with Shwachman syndrome. Leukemia. 2009;23:708–711. doi: 10.1038/leu.2008.369. [DOI] [PubMed] [Google Scholar]
- 74.Narumi S, et al. SAMD9 mutations cause a novel multisystem disorder, MIRAGE syndrome, and are associated with loss of chromosome 7. Nat Genet. 2016;48:792–797. doi: 10.1038/ng.3569. [DOI] [PubMed] [Google Scholar]
- 75.Wong TN, et al. Role of TP53 mutations in the origin and evolution of therapy-related acute myeloid leukaemia. Nature. 2015;518:552–555. doi: 10.1038/nature13968. [DOI] [PMC free article] [PubMed] [Google Scholar]
- 76.Alexandrov LB, et al. Signatures of mutational processes in human cancer. Nature. 2013;500:415–421. doi: 10.1038/nature12477. [DOI] [PMC free article] [PubMed] [Google Scholar]
- 77.McNerney ME, et al. The spectrum of somatic mutations in high-risk acute myeloid leukaemia with −7/del(7q) Br J Haematol. 2014;166:550–556. doi: 10.1111/bjh.12964. [DOI] [PMC free article] [PubMed] [Google Scholar]
- 78.Ok CY, et al. Mutational profiling of therapy-related myelodysplastic syndromes and acute myeloid leukemia by next generation sequencing, a comparison with de novo diseases. Leuk Res. 2015;39:348–354. doi: 10.1016/j.leukres.2014.12.006. [DOI] [PMC free article] [PubMed] [Google Scholar]
- 79.Hunter C, et al. A hypermutation phenotype and somatic MSH6 mutations in recurrent human malignant gliomas after alkylator chemotherapy. Cancer Res. 2006;66:3987–3991. doi: 10.1158/0008-5472.CAN-06-0127. [DOI] [PMC free article] [PubMed] [Google Scholar]
- 80.Mistry AR, et al. DNA topoisomerase II in therapy-related acute promyelocytic leukemia. N Engl J Med. 2005;352:1529–1538. doi: 10.1056/NEJMoa042715. [DOI] [PubMed] [Google Scholar]
- 81.Ok CY, et al. TP53 mutation characteristics in therapy-related myelodysplastic syndromes and acute myeloid leukemia is similar to de novo diseases. J Hematol Oncol. 2015;8:45. doi: 10.1186/s13045-015-0139-z. [DOI] [PMC free article] [PubMed] [Google Scholar]
- 82.Christiansen DH, Andersen MK, Pedersen-Bjergaard J. Mutations with loss of heterozygosity of p53 are common in therapy-related myelodysplasia and acute myeloid leukemia after exposure to alkylating agents and significantly associated with deletion or loss of 5q, a complex karyotype, and a poor prognosis. J Clin Oncol. 2001;19:1405–1413. doi: 10.1200/JCO.2001.19.5.1405. [DOI] [PubMed] [Google Scholar]
- 83.Side LE, et al. RAS, FLT3, and TP53 mutations in therapy-related myeloid malignancies with abnormalities of chromosomes 5 and 7. Genes Chromosomes Cancer. 2004;39:217–223. doi: 10.1002/gcc.10320. [DOI] [PubMed] [Google Scholar]
- 84.Schulz E, et al. Preexisting TP53 mutation in therapy-related acute myeloid leukemia. Ann Hematol. 2015;94:527–529. doi: 10.1007/s00277-014-2191-0. [DOI] [PMC free article] [PubMed] [Google Scholar]
- 85.Adem V, et al. The complete mutatome and clonal architecture of del(5q) American Society of Hematology Annual Meeting. 2015;608 Abstract. [Google Scholar]
- 86.Woll PS, et al. Myelodysplastic syndromes are propagated by rare and distinct human cancer stem cells in vivo. Cancer Cell. 2014;25:794–808. doi: 10.1016/j.ccr.2014.03.036. [DOI] [PubMed] [Google Scholar]
- 87.Dumitriu B, et al. Telomere attrition and candidate gene mutations preceding monosomy 7 in aplastic anemia. Blood. 2015;125:706–709. doi: 10.1182/blood-2014-10-607572. [DOI] [PMC free article] [PubMed] [Google Scholar]
- 88.Cachia PG, et al. Clonal haemopoiesis following cytotoxic therapy for lymphoma. Leukemia. 1993;7:795–800. [PubMed] [Google Scholar]
- 89.Ruark E, et al. Mosaic PPM1D mutations are associated with predisposition to breast and ovarian cancer. Nature. 2013;493:406–410. doi: 10.1038/nature11725. [DOI] [PMC free article] [PubMed] [Google Scholar]
- 90.Swisher EM, et al. Somatic mosaic mutations in PPM1D and TP53 in the blood of women with ovarian carcinoma. JAMA Oncology. 2016;2:370–372. doi: 10.1001/jamaoncol.2015.6053. [DOI] [PMC free article] [PubMed] [Google Scholar]
- 91.Pharoah PD, et al. PPM1D mosaic truncating variants in ovarian cancer cases may be treatment-related somatic mutations. J Natl Cancer Inst. 2016;108 doi: 10.1093/jnci/djv347. [DOI] [PMC free article] [PubMed] [Google Scholar]
- 92.Steensma DP, et al. Clonal hematopoiesis of indeterminate potential and its distinction from myelodysplastic syndromes. Blood. 2015;126:9–16. doi: 10.1182/blood-2015-03-631747. [DOI] [PMC free article] [PubMed] [Google Scholar]
- 93.Rodriguez-Santiago B, et al. Mosaic uniparental disomies and aneuploidies as large structural variants of the human genome. Am J Hum Genet. 2010;87:129–138. doi: 10.1016/j.ajhg.2010.06.002. [DOI] [PMC free article] [PubMed] [Google Scholar]
- 94.Forsberg LA, et al. Age-related somatic structural changes in the nuclear genome of human blood cells. Am J Hum Genet. 2012;90:217–228. doi: 10.1016/j.ajhg.2011.12.009. [DOI] [PMC free article] [PubMed] [Google Scholar]
- 95.Jacobs KB, et al. Detectable clonal mosaicism and its relationship to aging and cancer. Nat Genet. 2012;44:651–658. doi: 10.1038/ng.2270. [DOI] [PMC free article] [PubMed] [Google Scholar]
- 96.Laurie CC, et al. Detectable clonal mosaicism from birth to old age and its relationship to cancer. Nat Genet. 2012;44:642–650. doi: 10.1038/ng.2271. [DOI] [PMC free article] [PubMed] [Google Scholar]
- 97.Machiela MJ, et al. Characterization of large structural genetic mosaicism in human autosomes. Am J Hum Genet. 2015;96:487–497. doi: 10.1016/j.ajhg.2015.01.011. [DOI] [PMC free article] [PubMed] [Google Scholar]
- 98.Schick UM, et al. Confirmation of the reported association of clonal chromosomal mosaicism with an increased risk of incident hematologic cancer. PLoS One. 2013;8:e59823. doi: 10.1371/journal.pone.0059823. [DOI] [PMC free article] [PubMed] [Google Scholar]
- 99.Genovese G, et al. Clonal hematopoiesis and blood-cancer risk inferred from blood DNA sequence. N Engl J Med. 2014;371:2477–2487. doi: 10.1056/NEJMoa1409405. [DOI] [PMC free article] [PubMed] [Google Scholar]
- 100.Jaiswal S, et al. Age-related clonal hematopoiesis associated with adverse outcomes. N Engl J Med. 2014;371:2488–2498. doi: 10.1056/NEJMoa1408617. [DOI] [PMC free article] [PubMed] [Google Scholar]
- 101.Xie M, et al. Age-related mutations associated with clonal hematopoietic expansion and malignancies. Nat Med. 2014;20:1472–1478. doi: 10.1038/nm.3733. [DOI] [PMC free article] [PubMed] [Google Scholar]
- 102.McKerrell T, et al. Leukemia-associated somatic mutations drive distinct patterns of age-related clonal hemopoiesis. Cell Reports. 2015;10:1239–1245. doi: 10.1016/j.celrep.2015.02.005. [DOI] [PMC free article] [PubMed] [Google Scholar]
- 103.Young AL, Challen GA, Birmann BM, Druley TE. Clonal haematopoiesis harbouring AML-associated mutations is ubiquitous in healthy adults. Nat Commun. 2016;7:12484. doi: 10.1038/ncomms12484. [DOI] [PMC free article] [PubMed] [Google Scholar]
- 104.Rossi L, et al. Less is more: unveiling the functional core of hematopoietic stem cells through knockout mice. Cell Stem Cell. 2012;11:302–317. doi: 10.1016/j.stem.2012.08.006. [DOI] [PMC free article] [PubMed] [Google Scholar]
- 105.Moran-Crusio K, et al. Tet2 loss leads to increased hematopoietic stem cell self-renewal and myeloid transformation. Cancer Cell. 2011;20:11–24. doi: 10.1016/j.ccr.2011.06.001. [DOI] [PMC free article] [PubMed] [Google Scholar]
- 106.Challen GA, et al. Dnmt3a is essential for hematopoietic stem cell differentiation. Nat Genet. 2012;44:23–31. doi: 10.1038/ng.1009. [DOI] [PMC free article] [PubMed] [Google Scholar]
- 107.Shlush LI, et al. Identification of pre-leukaemic haematopoietic stem cells in acute leukaemia. Nature. 2014;506:328–333. doi: 10.1038/nature13038. [DOI] [PMC free article] [PubMed] [Google Scholar]
- 108.Bondar T, Medzhitov R. p53-mediated hematopoietic stem and progenitor cell competition. Cell Stem Cell. 2010;6:309–322. doi: 10.1016/j.stem.2010.03.002. [DOI] [PMC free article] [PubMed] [Google Scholar]
- 109.Takahashi K, et al. Preleukaemic clonal haemopoiesis and risk of therapy-related myeloid neoplasms: a case-control study. Lancet Oncol. 2017;18:100–111. doi: 10.1016/S1470-2045(16)30626-X. [DOI] [PMC free article] [PubMed] [Google Scholar]
- 110.Gillis NK, et al. Clonal haemopoiesis and therapy-related myeloid malignancies in elderly patients: a proof-of-concept, case-control study. Lancet Oncol. 2017;18:112–121. doi: 10.1016/S1470-2045(16)30627-1. [DOI] [PMC free article] [PubMed] [Google Scholar]
- 111.Gibson CJ, et al. Clonal hematopoiesis associated with adverse outcomes after autologous stem-cell transplantation for lymphoma. J Clin Oncol. 2017 doi: 10.1200/JCO.2016.71.6712. JCO2016716712. [DOI] [PMC free article] [PubMed] [Google Scholar]
- 112.Yoshizato T, et al. Somatic mutations and clonal hematopoiesis in aplastic anemia. N Engl J Med. 2015;373:35–47. doi: 10.1056/NEJMoa1414799. [DOI] [PMC free article] [PubMed] [Google Scholar]
- 113.Babushok DV, et al. Emergence of clonal hematopoiesis in the majority of patients with acquired aplastic anemia. Cancer Genet. 2015;208:115–128. doi: 10.1016/j.cancergen.2015.01.007. [DOI] [PMC free article] [PubMed] [Google Scholar]
- 114.Maciejewski JP, Risitano A, Sloand EM, Nunez O, Young NS. Distinct clinical outcomes for cytogenetic abnormalities evolving from aplastic anemia. Blood. 2002;99:3129–3135. doi: 10.1182/blood.v99.9.3129. [DOI] [PubMed] [Google Scholar]
- 115.Raaijmakers MH. Myelodysplastic syndromes: revisiting the role of the bone marrow microenvironment in disease pathogenesis. Int J Hematol. 2012;95:17–25. doi: 10.1007/s12185-011-1001-x. [DOI] [PubMed] [Google Scholar]
- 116.Agarwal P, Bhatia R. Influence of bone marrow microenvironment on leukemic stem cells: breaking up an intimate relationship. Adv Cancer Res. 2015;127:227–252. doi: 10.1016/bs.acr.2015.04.007. [DOI] [PubMed] [Google Scholar]
- 117.Anthony BA, Link DC. Regulation of hematopoietic stem cells by bone marrow stromal cells. Trends Immunol. 2014;35:32–37. doi: 10.1016/j.it.2013.10.002. [DOI] [PMC free article] [PubMed] [Google Scholar]
- 118.Korn C, Mendez-Ferrer S. Myeloid malignancies and the microenvironment. Blood. 2016 doi: 10.1182/blood-2016-09-670224. [DOI] [PMC free article] [PubMed] [Google Scholar]
- 119.Ferrer RA, et al. Mesenchymal stromal cells from patients with myelodyplastic syndrome display distinct functional alterations that are modulated by lenalidomide. Haematologica. 2013;98:1677–1685. doi: 10.3324/haematol.2013.083972. [DOI] [PMC free article] [PubMed] [Google Scholar]
- 120.Medyouf H, et al. Myelodysplastic cells in patients reprogram mesenchymal stromal cells to establish a transplantable stem cell niche disease unit. Cell Stem Cell. 2014;14:824–837. doi: 10.1016/j.stem.2014.02.014. [DOI] [PubMed] [Google Scholar]
- 121.Raaijmakers MH, et al. Bone progenitor dysfunction induces myelodysplasia and secondary leukaemia. Nature. 2010;464:852–857. doi: 10.1038/nature08851. [DOI] [PMC free article] [PubMed] [Google Scholar]
- 122.Stoddart A, et al. Cell intrinsic and extrinsic factors synergize in mice with haploinsufficiency for Tp53, and two human del(5q) genes, Egr1 and Apc. Blood. 2014;123:228–238. doi: 10.1182/blood-2013-05-506568. [DOI] [PMC free article] [PubMed] [Google Scholar]
- 123.Fleming HE, et al. Wnt signaling in the niche enforces hematopoietic stem cell quiescence and is necessary to preserve self-renewal in vivo. Cell Stem Cell. 2008;2:274–283. doi: 10.1016/j.stem.2008.01.003. [DOI] [PMC free article] [PubMed] [Google Scholar]
- 124.Wang Y, et al. The Wnt/beta-catenin pathway is required for the development of leukemia stem cells in AML. Science. 2010;327:1650–1653. doi: 10.1126/science.1186624. [DOI] [PMC free article] [PubMed] [Google Scholar]
- 125.Lane SW, et al. The Apc(min) mouse has altered hematopoietic stem cell function and provides a model for MPD/MDS. Blood. 2010;115:3489–3497. doi: 10.1182/blood-2009-11-251728. [DOI] [PMC free article] [PubMed] [Google Scholar]
- 126.Falconi G, et al. Impairment of PI3K/AKT and WNT/beta-catenin pathways in bone marrow mesenchymal stem cells isolated from patients with myelodysplastic syndromes. Exp Hematol. 2016;44:75–83 e71. 74. doi: 10.1016/j.exphem.2015.10.005. [DOI] [PubMed] [Google Scholar]
- 127.Kode A, et al. Leukaemogenesis induced by an activating beta-catenin mutation in osteoblasts. Nature. 2014;506:240–244. doi: 10.1038/nature12883. [DOI] [PMC free article] [PubMed] [Google Scholar]
- 128.Zambetti NA, et al. Mesenchymal inflammation drives genotoxic stress in hematopoietic stem cells and predicts disease evolution in human pre-leukemia. Cell Stem Cell. 2016;19:613–627. doi: 10.1016/j.stem.2016.08.021. [DOI] [PubMed] [Google Scholar]
- 129.Link DC, Walter MJ. ‘CHIP’ping away at clonal hematopoiesis. Leukemia. 2016;30:1633–1635. doi: 10.1038/leu.2016.130. [DOI] [PubMed] [Google Scholar]
- 130.Granfeldt Ostgard LS, et al. Epidemiology and clinical significance of secondary and therapy-related acute myeloid leukemia: a national population-based cohort study. J Clin Oncol. 2015;33:3641–3649. doi: 10.1200/JCO.2014.60.0890. [DOI] [PubMed] [Google Scholar]
- 131.Borthakur G, et al. Survival is poorer in patients with secondary core-binding factor acute myelogenous leukemia compared with de novo core-binding factor leukemia. Cancer. 2009;115:3217–3221. doi: 10.1002/cncr.24367. [DOI] [PMC free article] [PubMed] [Google Scholar]
- 132.Kayser S, et al. The impact of therapy-related acute myeloid leukemia (AML) on outcome in 2853 adult patients with newly diagnosed AML. Blood. 2011;117:2137–2145. doi: 10.1182/blood-2010-08-301713. [DOI] [PubMed] [Google Scholar]
- 133.Finke J, et al. Long-term follow-up of therapy-related myelodysplasia and AML patients treated with allogeneic hematopoietic cell transplantation. Bone Marrow Transplant. 2016;51:771–777. doi: 10.1038/bmt.2015.338. [DOI] [PubMed] [Google Scholar]
- 134.Bejar R, et al. Somatic mutations predict poor outcome in patients with myelodysplastic syndrome after hematopoietic stem-cell transplantation. J Clin Oncol. 2014;32:2691–2698. doi: 10.1200/JCO.2013.52.3381. [DOI] [PMC free article] [PubMed] [Google Scholar]
- 135.Welch JS, et al. TP53 and Decitabine in Acute Myeloid Leukemia and Myelodysplastic Syndromes. N Engl J Med. 2016;375:2023–2036. doi: 10.1056/NEJMoa1605949. [DOI] [PMC free article] [PubMed] [Google Scholar]
- 136.Rojek K, et al. Identifying Inherited and Acquired Genetic Factors Involved in Poor Stem Cell Mobilization and Donor-Derived Malignancy. Biol Blood Marrow Transplant. 2016;22:2100–2103. doi: 10.1016/j.bbmt.2016.08.002. [DOI] [PMC free article] [PubMed] [Google Scholar]
- 137.Goodell MA, Rando TA. Stem cells and healthy aging. Science. 2015;350:1199–1204. doi: 10.1126/science.aab3388. [DOI] [PubMed] [Google Scholar]
- 138.Lee CL, et al. Acute DNA damage activates the tumour suppressor p53 to promote radiation-induced lymphoma. Nature Communications. 2015;6:8477. doi: 10.1038/ncomms9477. [DOI] [PMC free article] [PubMed] [Google Scholar]
- 139.Frei E., 3rd Gene deletion: a new target for cancer chemotherapy. Lancet. 1993;342:662–664. doi: 10.1016/0140-6736(93)91764-d. [DOI] [PubMed] [Google Scholar]
- 140.Jaras M, et al. Csnk1a1 inhibition has p53-dependent therapeutic efficacy in acute myeloid leukemia. J Exp Med. 2014;211:605–612. doi: 10.1084/jem.20131033. [DOI] [PMC free article] [PubMed] [Google Scholar]
- 141.Kronke J, et al. Lenalidomide induces ubiquitination and degradation of CK1alpha in del(5q) MDS. Nature. 2015;523:183–188. doi: 10.1038/nature14610. [DOI] [PMC free article] [PubMed] [Google Scholar]
- 142.Fernandez LC, Torres M, Real FX. Somatic mosaicism: on the road to cancer. Nat Rev Cancer. 2016;16:43–55. doi: 10.1038/nrc.2015.1. [DOI] [PubMed] [Google Scholar]
- 143.Le Beau MM, et al. Cytogenetic and molecular delineation of a region of chromosome 7 commonly deleted in malignant myeloid diseases. Blood. 1996;88:1930–1935. [PubMed] [Google Scholar]
- 144.Dohner K, et al. Molecular cytogenetic characterization of a critical region in bands 7q35-q36 commonly deleted in malignant myeloid disorders. Blood. 1998;92:4031–4035. [PubMed] [Google Scholar]
- 145.Jerez A, et al. Loss of heterozygosity in 7q myeloid disorders: clinical associations and genomic pathogenesis. Blood. 2012;119:6109–6117. doi: 10.1182/blood-2011-12-397620. [DOI] [PMC free article] [PubMed] [Google Scholar]
- 146.Varney ME, et al. Loss of Tifab, a del(5q) MDS gene, alters hematopoiesis through derepression of Toll-like receptor-TRAF6 signaling. J Exp Med. 2015;212:1967–1985. doi: 10.1084/jem.20141898. [DOI] [PMC free article] [PubMed] [Google Scholar]
- 147.Joslin JM, et al. Haploinsufficiency of EGR1, a candidate gene in the del(5q), leads to the development of myeloid disorders. Blood. 2007;110:719–726. doi: 10.1182/blood-2007-01-068809. [DOI] [PMC free article] [PubMed] [Google Scholar]
- 148.Young DJ, et al. Knockdown of Hnrnpa0, a del(5q) gene, alters myeloid cell fate in murine cells through regulation of AU-rich transcripts. Haematologica. 2014;99:1032–1040. doi: 10.3324/haematol.2013.098657. [DOI] [PMC free article] [PubMed] [Google Scholar]
- 149.Chen TH, et al. Knockdown of Hspa9, a del(5q31.2) gene, results in a decrease in hematopoietic progenitors in mice. Blood. 2011;117:1530–1539. doi: 10.1182/blood-2010-06-293167. [DOI] [PMC free article] [PubMed] [Google Scholar]
- 150.Peng J, et al. Myeloproliferative defects following targeting of the Drf1 gene encoding the mammalian diaphanous related formin mDia1. Cancer Res. 2007;67:7565–7571. doi: 10.1158/0008-5472.CAN-07-1467. [DOI] [PubMed] [Google Scholar]
- 151.Zhao Z, et al. Cooperative loss of RAS feedback regulation drives myeloid leukemogenesis. Nat Genet. 2015;47:539–543. doi: 10.1038/ng.3251. [DOI] [PMC free article] [PubMed] [Google Scholar]
- 152.Yoshimi A, et al. Recurrent CDC25C mutations drive malignant transformation in FPD/AML. Nature Communications. 2014;5:4770. doi: 10.1038/ncomms5770. [DOI] [PubMed] [Google Scholar]
- 153.Liu TX, et al. Chromosome 5q deletion and epigenetic suppression of the gene encoding alpha-catenin (CTNNA1) in myeloid cell transformation. Nat Med. 2007;13:78–83. doi: 10.1038/nm1512. [DOI] [PubMed] [Google Scholar]
- 154.Lehmann S, et al. Common deleted genes in the 5q- syndrome: thrombocytopenia and reduced erythroid colony formation in SPARC null mice. Leukemia. 2007;21:1931–1936. doi: 10.1038/sj.leu.2404852. [DOI] [PubMed] [Google Scholar]
- 155.Heuser M, et al. Loss of MLL5 results in pleiotropic hematopoietic defects, reduced neutrophil immune function, and extreme sensitivity to DNA demethylation. Blood. 2009;113:1432–1443. doi: 10.1182/blood-2008-06-162263. [DOI] [PubMed] [Google Scholar]
- 156.Madan V, et al. Impaired function of primitive hematopoietic cells in mice lacking the Mixed-Lineage-Leukemia homolog MLL5. Blood. 2009;113:1444–1454. doi: 10.1182/blood-2008-02-142638. [DOI] [PubMed] [Google Scholar]
- 157.Zhang Y, et al. MLL5 contributes to hematopoietic stem cell fitness and homeostasis. Blood. 2009;113:1455–1463. doi: 10.1182/blood-2008-05-159905. [DOI] [PMC free article] [PubMed] [Google Scholar]
- 158.Sundaravel S, et al. Reduced DOCK4 expression leads to erythroid dysplasia in myelodysplastic syndromes. Proc Natl Acad Sci U S A. 2015;112:E6359–6368. doi: 10.1073/pnas.1516394112. [DOI] [PMC free article] [PubMed] [Google Scholar]
- 159.Muto T, et al. Concurrent loss of Ezh2 and Tet2 cooperates in the pathogenesis of myelodysplastic disorders. J Exp Med. 2013;210:2627–2639. doi: 10.1084/jem.20131144. [DOI] [PMC free article] [PubMed] [Google Scholar]
- 160.Lawrence MS, et al. Discovery and saturation analysis of cancer genes across 21 tumour types. Nature. 2014;505:495–501. doi: 10.1038/nature12912. [DOI] [PMC free article] [PubMed] [Google Scholar]
- 161.Bowler TG, et al. Exome sequencing of familial MDS reveals novel mutations and high rates of false positive mutations in MLL3 due to pseudogene effects. American Society of Hematology Annual Meeting. 2015 Abstract #4591. [Google Scholar]