Abstract
Purpose
This study estimated the 10-year risk of developing second primary lung cancer (SPLC) among survivors of initial primary lung cancer (IPLC) and evaluated the clinical utility of the risk prediction model for selecting eligibility criteria for screening.
Methods
SEER data were used to identify a population-based cohort of 20,032 participants diagnosed with IPLC between 1988 and 2003 and who survived ≥ 5 years after the initial diagnosis. We used a proportional subdistribution hazards model to estimate the 10-year risk of developing SPLC among survivors of lung cancer LC in the presence of competing risks. Considered predictors included age, sex, race, treatment, histology, stage, and extent of disease. We examined the risk-stratification ability of the prediction model and performed decision curve analysis to evaluate the clinical utility of the model by calculating its net benefit in varied risk thresholds for screening.
Results
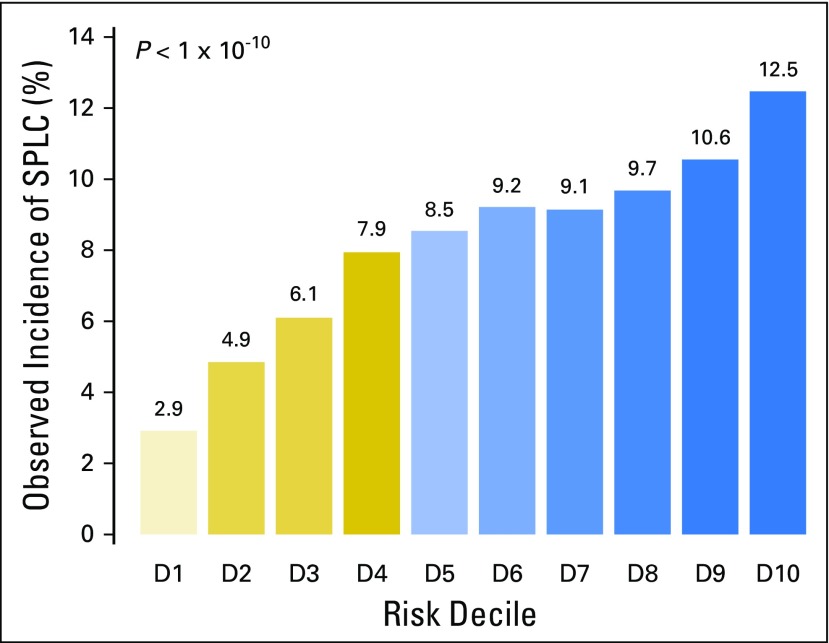
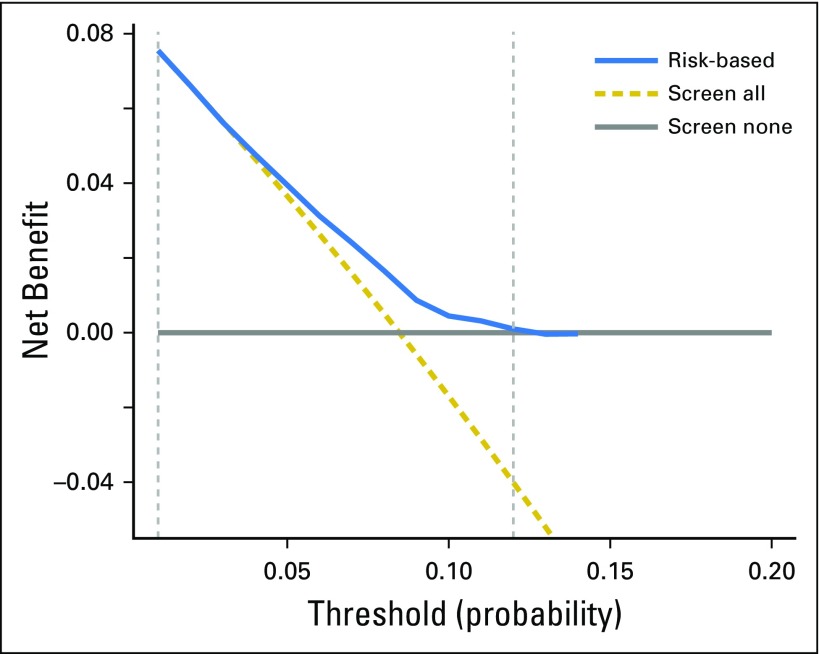
Although the median 10-year risk of SPLC among survivors of LC was 8.36%, the estimated risk varied substantially (range, 0.56% to 14.3%) when stratified by age, histology, and extent of IPLC in the final prediction model. The stratification by deciles of estimated risk showed that the observed incidence of SPLC was significantly higher in the tenth-decile group (12.5%) versus the first-decile group (2.9%; P < 10−10). The decision curve analysis yielded a range of risk thresholds (1% to 11.5%) at which the clinical net benefit of the risk model was larger than those in hypothetical all-screening or no-screening scenarios.
Conclusion
The risk stratification approach in SPLC can be potentially useful for identifying survivors of LC to be screened by computed tomography. More comprehensive environmental and genetic data may help enhance the predictability and stratification ability of the risk model for SPLC.
INTRODUCTION
Lung cancer (LC) is the leading cause of cancer-related mortality in the United States.1 The National Lung Screening Trial recently showed that low-dose computed tomography (LDCT) screening is effective in reducing LC mortality by 20% compared with chest x-ray screening.2 With the adoption of computed tomography screening, the number of survivors of LC is expected to rapidly increase.3 The estimated number of survivors of LC was approximately 412,230 as of 2012 and is projected to be > 500,000 in 2022.3 Recent studies have shown that survivors of LC have a high risk of developing second primary lung cancer (SPLC), with an incidence four- to six-times higher than that of initial primary lung cancer (IPLC).4
Despite the increasing importance of SPLC, there is uncertainty on how to guide screenings for survivors of LC. Recently, the US Preventive Services Task Force established national lung screening guidelines for IPLC, recommending that asymptomatic persons 55 to 80 years of age with ≥ 30 pack-years of smoking and < 15 years since smoking cessation be screened annually by LDCT.5
However, there currently are no consensus screening guidelines for survivors of LC who are at a high risk of SPLC. Although several recent studies showed that risk model–based screening is important to efficiently detect IPLC,6-8 such approaches have never been examined for SPLC. To implement effective screening programs for survivors of LC, it is essential to identify factors associated with SPLC risk and to evaluate individuals’ risk factors for SPLC that can help identify efficient screening criteria.
Although numerous studies have examined the risk of SPLC, many of them focused on estimating the cumulative incidence of SPLC in study populations,9-12 and the factors that contribute to SPLC risk have not been established. Johnson9 analyzed 10 published studies to examine the cumulative risk of SPLC; this work showed that nine of the 10 studies reported a rate of SPLC risk of 1% to 2% per patient per year among patients with resected non–small-cell lung cancer. The factors associated with SPLC risk were not reported, nor were prediction models provided for survivors of IPLC. Whereas a recent study by Boyle et al13 reported that smoking is a risk factor for SPLC, another study by Ripley et al14 reported no association between smoking and SPLC risk. Most published studies for SPLC, including these two studies, report results from the experiences of single institutions12-14; these results may be heterogeneous, with a lack of power to identify the important factors associated with SPLC.
In this study, we aimed to evaluate the risk of SPLC among patients with LC who survived ≥ 5 years after the diagnosis of IPLC. We used data from a large population-based cohort to identify the clinical and demographic factors associated with SPLC risk. In a prior study, we compared various statistical modeling approaches to analyze SPLC risk; we showed that application of the standard Cox regression, which does not take into account competing risks, leads to a substantial bias in risk estimation of SPLC (Han et al, Competing risk analysis of SPLC). In an extension of this work, we applied a proportional subdistribution hazards regression15 to obtain unbiased estimates of SPLC risk in the presence of competing risks. In addition, we evaluated the risk-stratification ability and the clinical utility of the prediction model by using decision curve analysis.
METHODS
SEER Data
We obtained the study participants from the population-based SEER program of the National Cancer Institute. With a focus on evaluation of the risk of developing SPLC among survivors of IPLC, in accordance with clinical opinions, we defined survivors of LC as patients with IPLC who survived ≥ 5 years after the diagnosis of IPLC. We identified 20,032 patients who were diagnosed with IPLC between 1988 and 2003, and who survived ≥ 5 years after the initial diagnosis. We focused on this period because it was before active computed tomography screenings were adopted, and hence most cancers were likely to be detected clinically in the absence of screening; this can help avoid potential bias that could be raised by allowing different detection modes across patients.
Staging and Histology
Histologic classification was according to the International Classification of Diseases of Oncology, 3rd edition. All tumors were staged according to the American Joint Committee on Cancer staging system. Collected clinical variables included stage, histology, tumor size, extent of disease, first-course treatment, survival of up to 16 years after the diagnosis of IPLC, and the incidence of SPLC. Demographic variables such as age at lung cancer diagnosis, sex, and race/ethnicity were also collected; smoking information was not available in SEER data. We only included histologically confirmed malignant tumors of the lung and excluded patients with missing information on stage, race/ethnicity, age, histology, and treatment.
Definition of SPLC
The most widely used definition of SPLC, proposed by Martini and Melamed,16 considers a new, distinct pulmonary malignancy to be SPLC if it fulfills any one of the following three criterion: (1) histologic results are different from those of IPLC; (2) the histologic results are the same as for the index tumor but diagnosed 2 years after the primary tumor; or (3) the histologic results are the same as for the index tumor, diagnosed within 2 years of the primary tumor, but are located in different lobes or segments, with no positive intervening lymph nodes and no evidence of metastasis. Reflecting the concerns on the complexity in diagnosis of SPLC,17,18 however, we considered alternative criteria that are stricter, in accordance with clinical opinions, where SPLC is defined as a new, distinct pulmonary malignancy that is diagnosed ≥ 5 years after the primary tumor.
Statistical Methods
Proportional subdistribution hazards modeling.
Although the most common method for analyzing survival data is the Cox proportional hazards regression model, it is not designed to accommodate the competing nature of multiple causes of the same event; hence, it tends to produce inaccurate estimates.19
Competing risks are especially relevant in the study of SPLC, where a substantial proportion of survivors of LC often die as the result of other causes (such as heart disease) before developing SPLC. To obtain unbiased estimates of the risk of SPLC, we applied a proportional subdistribution hazards regression,15 which connects regression coefficients to a cumulative incidence function to estimate the unbiased risks in the presence of competing risks.
Variable selection.
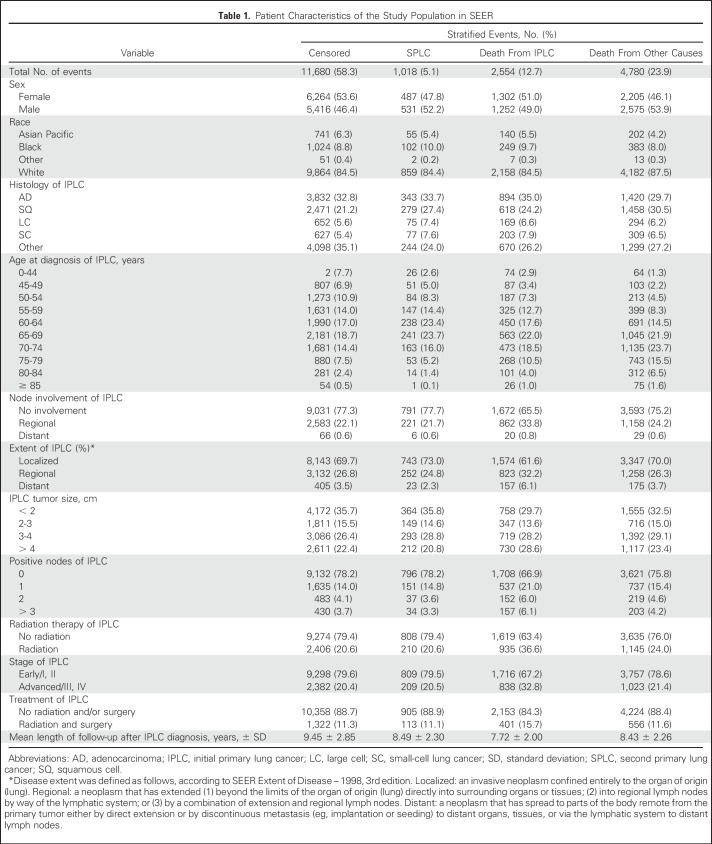
The following variables were considered for predicting the risk of SPLC: sex, race, age at IPLC diagnosis, stage, histology, disease extent (Table 1), tumor size, node involvement, the number of positive nodes, and first course of treatment. We also considered interactions of all possible pairs of variables. To select variables to be included in the final prediction model, we used stepwise forward and backward elimination methods. Stepwise selection is a method of fitting models in which the selection of predictive variables is performed by an automatic procedure. In each step, a variable is considered for addition to or subtraction from the set of variables on the basis of some prespecified criterion. We used the Akaike information criterion and the Bayesian information criterion (BIC) as well as a new criterion called BICcr, which is an adjustment of BIC to competing risks models.20 We quantified variable importance by conducting likelihood ratio tests and using χ2 test statistics subtracted by the degrees of freedom as a comparison metric.21
Table 1.
Patient Characteristics of the Study Population in SEER
Validation and performance evaluation.
As a validation study, we used a bootstrap cross-validation method; risk prediction models were trained on 200 bootstrap samples that were drawn with replacement of the same size as the original data. We then evaluated the performance of the models in the observations that were not in the bootstrap sample to estimate unbiased estimate of performance metrics. To evaluate the performance of the prediction model, we used the c-index and calibration plot. The c-index measures discrimination, which is the ability of a model to distinguish subject outcomes. The calibration of a prediction model measures the overall agreement between the observed outcomes and the predicted probability using the model.
Risk stratification ability.
Given recent criticisms of the c-index,22-25 we considered another way to evaluate a risk prediction model—the ability to stratify a population into groups with distinct risks that can substantially affect the risk-benefit balance of screening.24 As more predictive risk factors are identified and incorporated into a model, estimated risks will have more variations among individuals, which can be useful for identifying high-risk individuals for disease prevention. To examine the risk stratification ability of the prediction model for SPLC, we divided the study population into 10 groups by deciles on the basis of estimated risk. We then estimated observed cumulative incidence (10 years) using the Gray method26 for each group by taking into account competing risks and comparing them across the deciles.
Clinical utility: Decision curve analysis.
Although the c-index is one of the most commonly used methods to evaluate the performance of a prediction model, it does not have a direct clinical interpretation. To address this issue, we applied decision curve analysis, which evaluates the clinical usefulness of a prediction model by calculating its net benefit using the rate of true and false positives in varied risk thresholds for screening.25 A model is clinically useful in the context of screening if the application of the model produces a larger net benefit than not applying it in identifying screening eligibility. More details on this method are provided in the Appendix (online only). All statistical analyses were conducted using R (https://www.r-project.org/).
RESULTS
Development of a Risk Model: Identifying Factors Associated With SPLC Risk
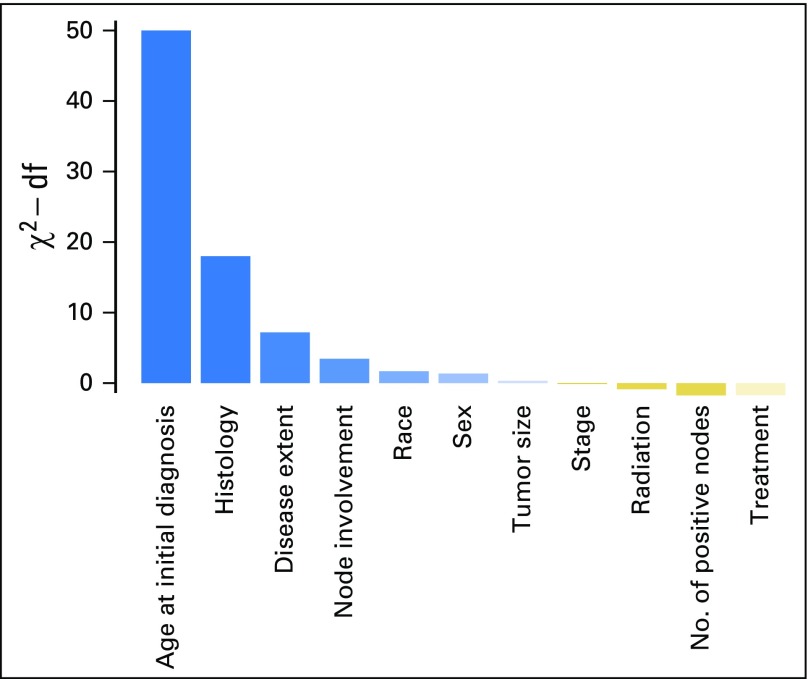
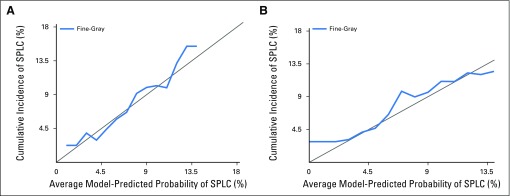
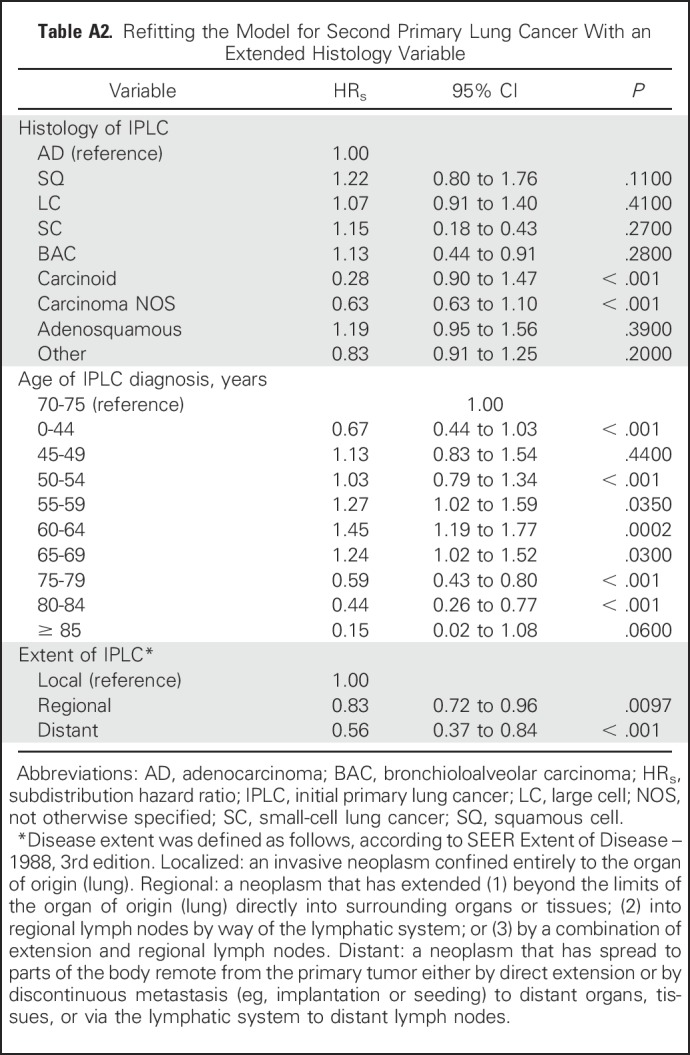
Characteristics of the study population are listed in Table 1; the maximum follow-up was 16 years and the median follow-up was 8 years from the diagnosis of IPLC. Results for the selected variables are listed in Table 2, which indicate that the age of IPLC diagnosis, histology, and extent of disease were significantly associated with SPLC risk. Figure 1 shows the relative importance of each independent variable, and shows that patient age at the time of IPLC diagnosis was the most important factor in predicting SPLC risk, followed by histology and extent of disease. Compared with a reference age group of 70 to 74 years, survivors of LC with a younger age (< 45 years) or an older age (> 75 years) had substantially reduced risks of SPLC, with a subdistribution hazard ratio (HRs) < 0.59. Survivors of LC in the “other” histology group had significantly reduced risks versus adenocarcinoma (HRs = 0.79; P = 4.3 × 10⁻³). Refitting the proportional subdistribution hazards model with a more detailed histology variable (nine levels instead of five levels) revealed that carcinoid and carcinoma not otherwise specified in the “other” histology group drove the reduced risks (HRs = 0.28 and 0.68, respectively; P = 2.3 × 10⁻⁸ and .013, respectively; Appendix Tables A1 and A2, online only). Regional and distant extensions of IPLC were also associated with a decreased risk of SPLC, potentially as the result of a higher chance of death from IPLC before developing SPLC. Validation of the risk model showed that the c-index for validation was 61.2%, with moderate discriminatory power; in addition, calibration results demonstrated good concordance between the observed incidences and predictions, with the curves following the 45° line (Appendix Fig A1, online only).
Table 2.
Factors Associated With Second Primary Lung Cancer (SPLC) Risk Among Survivors of Lung Cancer Included in the Final Prediction Model for SPLC Risk
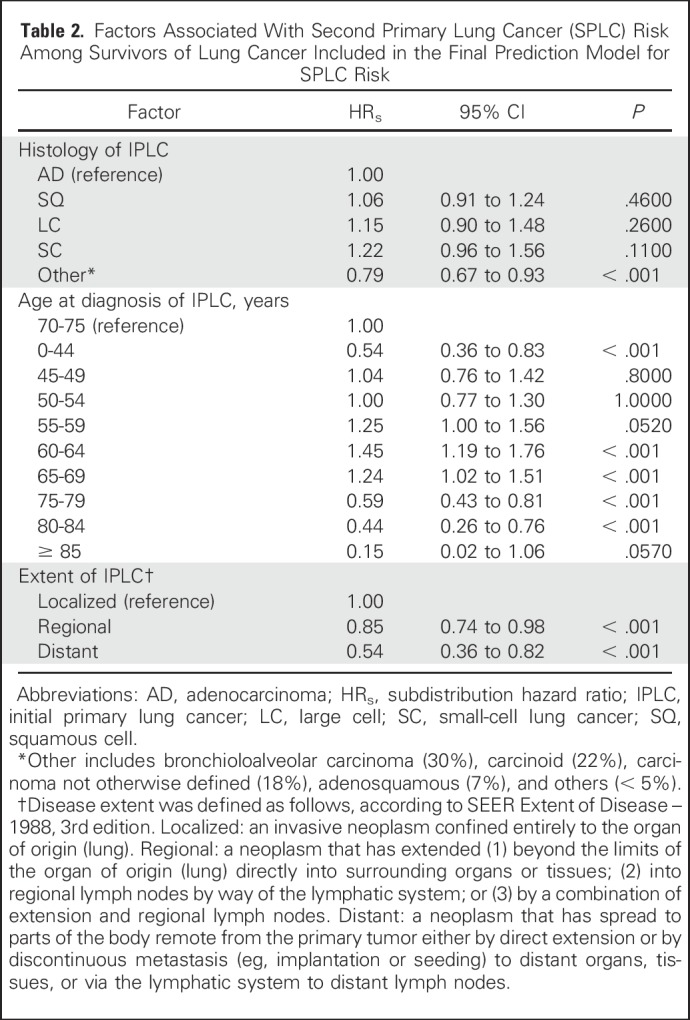
Fig 1.
Importance of variables in predicting the risk of second primary lung cancer. The y-axis shows the likelihood ratio test χ2 statistic subtracted by the degrees of freedom (df) conducted for each variable. Note that none of interaction terms were significant; hence, the importance metric was displayed for the main effects of the variables in the multivariable model.
Risk Stratification: Variation of SPLC Risk Across Individuals
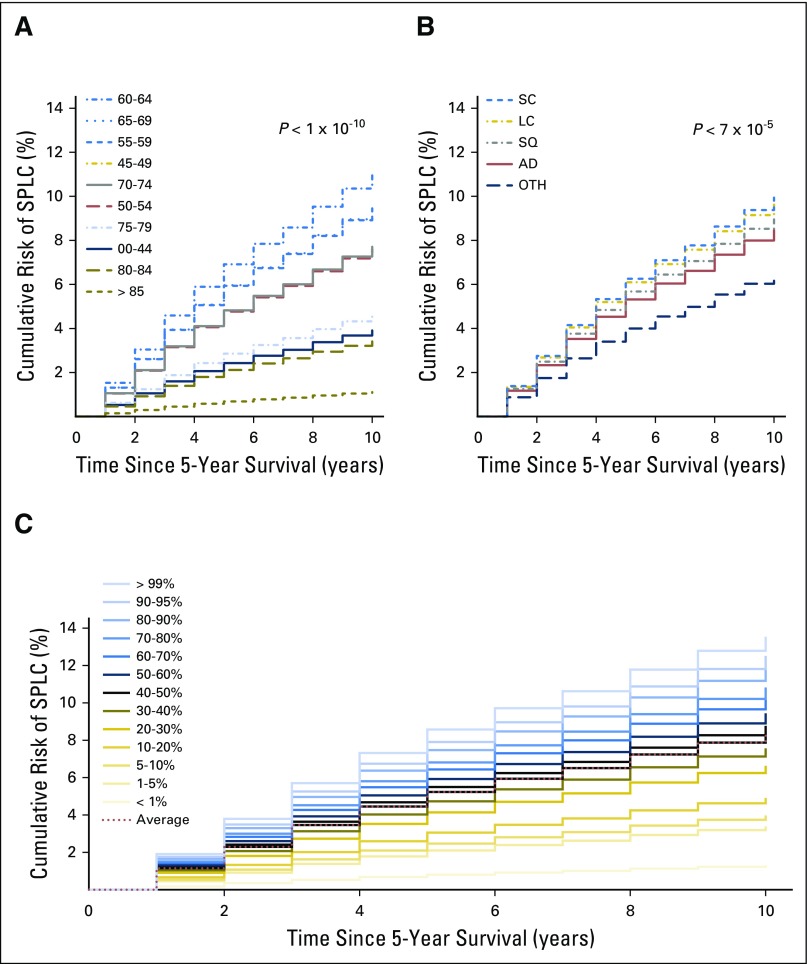
Using the risk prediction model in Table 2, we estimated an individual’s risk of developing SPLC15 within 10 years after surviving 5 years from their diagnosis of IPLC (ie, 15 years since the diagnosis of IPLC). Although the median 10-year risk for SPLC among survivors of LC was 8.35%, the risk varied substantially (range, 0.59% to 14.3%) when stratified by age, histology, and extent of disease using the risk model. Figures 2A and 2B show that the observed risks varied substantially by age or histology (eg, age group ≥ 85 years had a median 10-year risk of 1.1%, whereas the age group 60 to 64 years had the highest median risk at 10.97% [P < 10−10]). The cumulative risk stratified by each percentile of the risk estimated using all selected features, eg, age, histology, and disease extent (Fig 2C), shows a wide stratification of risks, from 1.3% for the bottom first percentile to 12.56% for the top first percentile, demonstrating a good separation among low-risk versus high-risk individuals. We compared the observed incidence of SPLC across different risk groups defined by the deciles of estimated risk in Figure 3, which shows that a significantly higher incidence was observed in the tenth-decile group (12.5%) versus the first-decile group (2.9%; P < 10−10). This suggests that the risk stratification for SPLC using the risk model can be potentially useful in identifying high-risk individuals among survivors of LC.
Fig 2.
Cumulative risk of second primary lung cancer (SPLC) among survivors of lung cancer (ie, patients with initial primary lung cancer [IPLC] who survived ≥ 5 years after the diagnosis of IPLC). The cumulative risk of SPLC is shown by (A) age group, and by (B) histologic subtype. The risks across different groups were compared and tested using the method by Gray.26 (C) The cumulative risk is shown by percentile of estimated risk on the basis of the prediction model. AD, adenocarcinoma; LC, large cell; OTH, other; SC, small-cell lung cancer; SQ, squamous cell.
Fig 3.
Cumulative 10-year incidence of second primary lung cancer (SPLC) by decile (D) of the estimated risk using the prediction model. In each decile of individuals, the marginal cumulative incidence of SPLC was calculated and the equality of the estimated incidences across groups was tested using the method by Gray.26
Evaluating the Clinical Utility of the Risk Prediction Model
We compared the net benefit of the risk model to those in two alternative scenarios: screening all individuals and screening no one. The results shown in Figure 4 demonstrate that in a wide range of threshold probabilities (1% to 11%), the clinical net benefit of the risk model was larger than that in hypothetical all-screening or no-screening scenarios. This implies that if we use a risk threshold from the given interval of 1% to 11% (eg, 5%), so that screening is recommended if an individual’s risk is above the given threshold, then the calculated net benefit (the weighted sum of true positives subtracted by the number of false positives) is larger for the prediction model than it is in the strategies that do not use the model.
Fig 4.
Decision curve analysis for the risk model for second primary lung cancer. The x-axis is the risk threshold probability that changes from 0 to 1 (right truncated at 0.2) and the y-axis is the calculated net benefit for a given threshold probability. The blue curve depicts the net benefit of the risk model–based selection strategy for screening, whereas the gold and gray lines display the net benefits in the alternative strategies of screening all patients (gold) versus screening no patients (gray) in the data set.
DISCUSSION
Using population-based cancer surveillance data, we evaluated an individual’s risk of developing SPLC among patients who survived ≥ 5 years after the diagnosis of IPLC. Although the median 10-year risk for SPLC was 8.35% for the entire sample, the estimated risk varied substantially across individuals (range, 0.59% to 14.3%) when stratified by various risk factors. The stratification of patients by deciles of estimated risk showed that the observed incidence of SPLC was significantly higher in the tenth-decile group compared with the first-decile group, implying that the risk model provides a good separation of high- versus low-risk survivors. Unlike most prior studies that have assessed overall risk of SPLC among patients who have undergone resection,9,12,14 our study focused on individuals who survived ≥ 5 years after the diagnosis of IPLC. Although patients are under intense surveillance for potential recurrence or metastases after resection, those who survive long enough (eg, ≥ 5 years) are often in high need of guidance on screening and can benefit from informed decision making.
To the best of our knowledge, this is the first study to evaluate the risk stratification ability and clinical utility of a prediction model for SPLC among survivors of LC using data from a large, population-based cohort. Unlike studies conducted using data from single-institution based studies, this allows the estimation of a number of risk factors on the basis of a large sample that is not subject to selection and referral biases. It is notable that all SEER registries comply with the strictest data-quality indicators and follow consistent criteria for collecting data and maintaining the quality of its variables. Recently, our group evaluated and compared the performance of various statistical modeling approaches to estimate the risk of SPLC (Han et al, Competing risk analysis of SPLC). However, the risk stratification ability of the prediction model has not been investigated nor was the examination of the clinical utility of the risk model reported. In the current study, we quantified the clinical net benefits of the risk model–based screening strategy for SPLC.
Research on the optimal risk threshold for screening for IPLC is ongoing. Recently, Tammemägi et al8 proposed a 6-year risk threshold of 1.5% for IPLC risk for screening, which represents the 65th percentile of the 6-year risk among the high-risk individuals who participated in the National Lung Screening Trial. A direct comparison may not be appropriate because of the application of different risk models. However, the 65th percentile of the 6-year risk for SPLC that we estimated for survivors of LC in SEER data, using our model, was 6.2%, which is more than four times higher than that of IPLC. This finding is consistent with prior reports that compared the incidences of SPLC versus IPLC.4 Interestingly, using the 1.5% threshold recommended for IPLC, 99% of the survivors of LC in the SEER data we used were eligible for screening (data not shown). This implies that a tailored prediction model for SPLC is needed for survivors of LC to stratify a population into groups with distinct risks to substantially affect the risk-benefit balance of screening.
The association between young age and lower risk of several second cancers has been reported previously.27 Although this finding is rather counterintuitive because young survivors have more time to develop SPLC and thus could have a higher risk of SPLC, it is possible that this association exists partly because young patients with LC have different smoking behaviors. Although SEER data do not provide information on smoking, we compared the histology distribution among young (age < 45 years) versus middle-aged (55 to 75 years) patients and found that the proportion of squamous LC (known to be associated with heavy smoking) was much lower among younger patients (9% v 27%, respectively). It is possible that the etiology of LC among a young population may be different from that of smoking-related LC, with potentially different driver mutations that may be more curable or that may lower the chance of developing SPLC. Further investigation into this hypothesis is necessary, but will require additional databases that contain information on driver mutations.
Despite several strengths, our study has limitations. First, SEER does not provide environmental exposures data, including smoking. Although smoking is an established risk factor for IPLC, its effect on SPLC is not clear. Given that a high proportion of patients with LC are already smokers, the effect of smoking on SPLC among patients with LC may not be as strong as it is on the risk of IPLC. Recently, Ripley et al14 showed that smoking is not associated with SPLC, but this finding needs to be confirmed in a larger study.
SEER data also do not include other potentially important information for SPLC, such as family history of LC, chronic obstructive pulmonary disease, or genetic variants. It is possible that the lack of these data has led to the moderate c-index observed in our model. However, although the c-index is currently considered to be the standard metric to evaluate the accuracy of risk prediction models, it is criticized for having no direct clinical relevance and for avoiding the supposed subjectivity in the threshold selection by summarizing overall model performance above all possible thresholds.22-25 Despite the moderate c-index, our model has shown the ability to stratify a population into subpopulations with distinct risks that can potentially effect the risk-benefit balance of screening. It has also proven to be clinically useful in providing screening eligibility criteria compared with strategies that do not use models based on decision curve analysis.
In conclusion, we developed a prediction model for SPLC risk on the basis of clinical and demographic risk factors using data from a large population-based cohort. Our analysis shows that the risk stratification approach for SPLC can be potentially useful in identifying survivors of LC at high risk who should be screened using LDCT. Future directions include validating and extending the proposed model using more comprehensive environmental and genetic data, which can help enhance the predictability and stratification ability of the risk model for SPLC.
Appendix
Fig A1.
Calibration plots. (A) The calibration on the entire data used to fit the model. (B) The validation of the prediction model using bootstrap cross-validation method. The x-axis shows the mean predicted probability of the conditional cumulative incidence model. The y-axis indicates marginal cumulative incidence probabilities for the respective cohorts. The gray line represents equality between the predicted and observed marginal cumulative incidences.
Table A1.
Distribution of Histology of IPLC
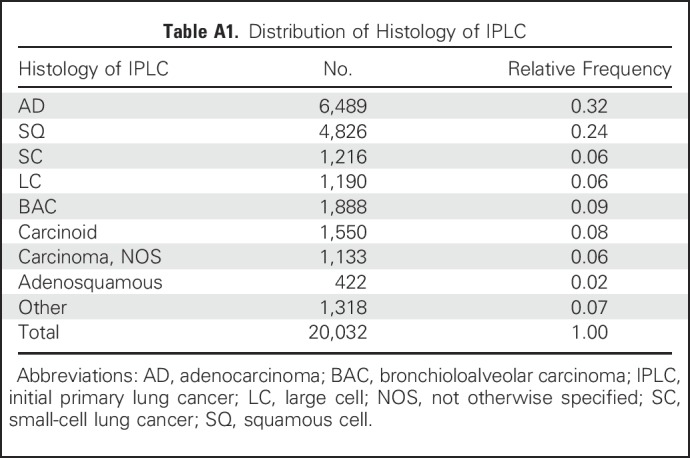
Table A2.
Refitting the Model for Second Primary Lung Cancer With an Extended Histology Variable
Footnotes
Supported by NIH grants U01-CA152956 and U01-CA199284.
Presented at the International Association for the Study of Lung Cancer Chicago Multidisciplinary Symposium in Thoracic Oncology, Chicago, IL, September 22-24, 2016.
AUTHOR CONTRIBUTIONS
Conception and design: Summer S. Han, Gabriel A. Rivera, Sylvia K. Plevritis, Heather A. Wakelee
Financial support: Sylvia K. Plevritis, Heather A. Wakelee
Collection and assembly of data: Summer S. Han, Gabriel A. Rivera, Heather A. Wakelee
Data analysis and interpretation: Summer S. Han, Martin C. Tammemägi, Scarlett L. Gomez, Iona Cheng, Heather A. Wakelee
Manuscript writing: All authors
Final approval of manuscript: All authors
Accountable for all aspects of the work: All authors
AUTHORS’ DISCLOSURES OF POTENTIAL CONFLICTS OF INTEREST
Risk Stratification for Second Primary Lung Cancer
The following represents disclosure information provided by authors of this manuscript. All relationships are considered compensated. Relationships are self-held unless noted. I = Immediate Family Member, Inst = My Institution. Relationships may not relate to the subject matter of this manuscript. For more information about ASCO’s conflict of interest policy, please refer to www.asco.org/rwc or ascopubs.org/jco/site/ifc.
Summer S. Han
No relationship to disclose
Gabriel A. Rivera
No relationship to disclose
Martin C. Tammemägi
No relationship to disclose
Sylvia K. Plevritis
Consulting or Advisory Role: GRAIL
Scarlett L. Gomez
Employment: Abgenix (I), BioInspire (I), Boehringer Ingelheim (I)
Stock or Other Ownership: Amgen (I)
Research Funding: Genentech (Inst)
Travel, Accommodations, Expenses: Genentech (through employment [CPIC]) (I)
Iona Cheng
No relationship to disclose
Heather A. Wakelee
Honoraria: Peregrine Pharmaceuticals, Biocon, ACEA Biosciences, Pfizer, Novartis
Consulting or Advisory Role: Peregrine Pharmaceuticals, ACEA Biosciences, Pfizer, Novartis
Research Funding: Genentech (Inst), Pfizer (Inst), Eli Lilly (Inst), Celgene (Inst), AstraZeneca/MedImmune (Inst), Exelixis (Inst), Novartis (Inst), Regeneron (Inst), Clovis Oncology (Inst), Xcovery (Inst), Bristol-Myers Squibb (Inst), Agennix (Inst), Gilead Sciences (Inst), Pharmacyclics (Inst)
Travel, Accommodations, Expenses: Clovis Oncology, Novartis, ACEA Biosciences, Pfizer, Genentech
REFERENCES
- 1.Siegel R, Ma J, Zou Z, et al. : Cancer statistics, 2014. CA Cancer J Clin 64:9-29, 2014 [DOI] [PubMed] [Google Scholar]
- 2., Aberle DR, Adams AM, Berg CD, et al. : Reduced lung-cancer mortality with low-dose computed tomographic screening. N Engl J Med 365:395-409, 2011 [DOI] [PMC free article] [PubMed] [Google Scholar]
- 3.Siegel R, DeSantis C, Virgo K, et al. : Cancer treatment and survivorship statistics, 2012. CA Cancer J Clin 62:220-241, 2012 [DOI] [PubMed] [Google Scholar]
- 4.Surapaneni R, Singh P, Rajagopalan K, et al. : Stage I lung cancer survivorship: Risk of second malignancies and need for individualized care plan. J Thorac Oncol 7:1252-1256, 2012 [DOI] [PubMed] [Google Scholar]
- 5.Moyer VA, U.S. Preventive Services Task Force : Screening for lung cancer: U.S. Preventive Services Task Force recommendation statement. Ann Intern Med 160:330-338, 2014 [DOI] [PubMed] [Google Scholar]
- 6.Tammemägi MC, Katki HA, Hocking WG, et al. : Selection criteria for lung-cancer screening. N Engl J Med 368:728-736, 2013 [DOI] [PMC free article] [PubMed] [Google Scholar]
- 7.Kovalchik SA, Tammemagi M, Berg CD, et al. : Targeting of low-dose CT screening according to the risk of lung-cancer death. N Engl J Med 369:245-254, 2013 [DOI] [PMC free article] [PubMed] [Google Scholar]
- 8.Tammemägi MC, Church TR, Hocking WG, et al. : Evaluation of the lung cancer risks at which to screen ever- and never-smokers: Screening rules applied to the PLCO and NLST cohorts. PLoS Med 11:e1001764, 2014 [DOI] [PMC free article] [PubMed] [Google Scholar]
- 9.Johnson BE: Second lung cancers in patients after treatment for an initial lung cancer. J Natl Cancer Inst 90:1335-1345, 1998 [DOI] [PubMed] [Google Scholar]
- 10.Rice D, Kim H-W, Sabichi A, et al. : The risk of second primary tumors after resection of stage I nonsmall cell lung cancer. Ann Thorac Surg 76:1001-1007, discussion 1007-1008, 2003 [DOI] [PubMed] [Google Scholar]
- 11.Heyne KH, Lippman SM, Lee JJ, et al. : The incidence of second primary tumors in long-term survivors of small-cell lung cancer. J Clin Oncol 10:1519-1524, 1992 [DOI] [PubMed] [Google Scholar]
- 12.Lou F, Huang J, Sima CS, et al. : Patterns of recurrence and second primary lung cancer in early-stage lung cancer survivors followed with routine computed tomography surveillance. J Thorac Cardiovasc Surg 145:75-81, discussion 81-82, 2013 [DOI] [PubMed] [Google Scholar]
- 13. doi: 10.1002/cncr.29095. Boyle JM, Tandberg DJ, Chino JP, et al: Smoking history predicts for increased risk of second primary lung cancer: A comprehensive analysis. Cancer 121:598-604, 2015. [DOI] [PubMed] [Google Scholar]
- 14.Ripley RT, McMillan RR, Sima CS, et al. : Second primary lung cancers: Smokers versus nonsmokers after resection of stage I lung adenocarcinoma. Ann Thorac Surg 98:968-974, 2014 [DOI] [PMC free article] [PubMed] [Google Scholar]
- 15.Fine JP, Gray RJ: A proportional hazards model for the subdistribution of a competing risk. J Am Stat Assoc 94:496-509, 1999 [Google Scholar]
- 16.Martini N, Melamed MR: Multiple primary lung cancers. J Thorac Cardiovasc Surg 70:606-612, 1975 [PubMed] [Google Scholar]
- 17.van Bodegom PC, Wagenaar SS, Corrin B, et al. : Second primary lung cancer: Importance of long term follow up. Thorax 44:788-793, 1989 [DOI] [PMC free article] [PubMed] [Google Scholar]
- 18.Xue X, Liu Y, Pan L, et al. : Diagnosis of multiple primary lung cancer: A systematic review. J Int Med Res 41:1779-1787, 2013 [DOI] [PubMed] [Google Scholar]
- 19.Scrucca L, Santucci A, Aversa F: Regression modeling of competing risk using R: An in depth guide for clinicians. Bone Marrow Transplant 45:1388-1395, 2010 [DOI] [PubMed] [Google Scholar]
- 20.Kuk D, Varadhan R: Model selection in competing risks regression. Stat Med 32:3077-3088, 2013 [DOI] [PubMed] [Google Scholar]
- 21.Harrell FE., Jr Regression Modeling Strategies. Springer, New York, NY, 2015 [Google Scholar]
- 22.Cook NR, Ridker PM: Advances in measuring the effect of individual predictors of cardiovascular risk: The role of reclassification measures. Ann Intern Med 150:795-802, 2009 [DOI] [PMC free article] [PubMed] [Google Scholar]
- 23.Lobo JM, Jiménez-Valverde A, Real R: AUC: A misleading measure of the performance of predictive distribution models. Glob Ecol Biogeogr 17:145-151, 2008 [Google Scholar]
- 24.Chatterjee N, Shi J, García-Closas M: Developing and evaluating polygenic risk prediction models for stratified disease prevention. Nat Rev Genet 17:392-406, 2016 [DOI] [PMC free article] [PubMed] [Google Scholar]
- 25.Vickers AJ, Elkin EB: Decision curve analysis: A novel method for evaluating prediction models. Med Decis Making 26:565-574, 2006 [DOI] [PMC free article] [PubMed] [Google Scholar]
- 26.Gray RJ: A class of K-sample tests for comparing the cumulative incidence of a competing risk. Ann Stat 16:1141-1154, 1988 [Google Scholar]
- 27.Park SM, Lim MK, Jung KW, et al. : Prediagnosis smoking, obesity, insulin resistance, and second primary cancer risk in male cancer survivors: National Health Insurance Corporation Study. J Clin Oncol 25:4835-4843, 2007 [DOI] [PubMed] [Google Scholar]


