Abstract
This work presents a diagnostic system for the hepatitis C infection using Raman spectroscopy and proximity based classification. The proposed method exploits transformed Raman spectra using the proximity based machine learning technique and is denoted as RS-PCA-Prox. First, Raman spectral data is baseline corrected by subtracting noise and low intensity background. After this, a feature transformation of Raman spectra is adopted, not only to reduce the feature’s dimensionality but also to learn different deviations in Raman shifts. The proposed RS-PCA-Prox shows significant diagnostic power in terms of accuracy, sensitivity, and specificity as 95%, 0.97 and 0.94 in PCA based transformed domain. The comparison of the RS-PCA-Prox with linear and ensemble based classifiers shows that proximity based classification performs better for the discrimination of HCV infected individuals and is able to differentiate the infected individuals from normal ones on the basis of molecular spectral information. Furthermore, it is observed that characteristic spectral changes are due to variation in the intensity of lectin, chitin, lipids, ammonia and viral protein as a consequence of the HCV infection.
OCIS codes: (300.0300) Spectroscopy; (300.6450) Spectroscopy, Raman
1. Introduction
Hepatitis is a serious health problem worldwide and a leading cause of morbidity and mortality. According to the World Health Organization (WHO), Hepatitis C virus (HCV) infection has become a global health issue, which nearly infects 3-4 million people annually and 350,000 people die as a result of HCV related diseases. It is a blood-borne infectious disease associated with the development of liver cirrhosis, liver failure and hepatocellular cancer [1]. Symptoms of the disease are founded on the type of infection ranging from asymptotic behavior in acutely infected individuals to appearance of jaundice, abdominal pain and decreased appetite in chronic patients [2].
There is currently no vaccine for hepatitis C treatment in the market, however, many are in development phase. Therefore, treatment is based merely on an early and efficient diagnosis of the infection. The established devices used for diagnosis, medication, and determination of response to antiviral treatment are serological and molecular tests [3,4]. Serological assays use Enzyme Linked Immunosorbent Assay (ELISA) for the screening of antiviral antibodies, whereas molecular tests detect and quantify RNA virus by employing RT-PCR protocol [5]. In spite of usefulness of wet-lab methods in the diagnosis of disease, they are expensive, time-consuming and error-prone. High specificity and sensitivity are needed for diagnosis of HCV infection, but both of these rarely meet concurrently. Thus, there is an extensive need for robust, sensitive and specific economical laboratory test which accurately detects disease by differentiating HCV infection from false positive HCV antibody [4].
In the past two decades, the use of Raman spectroscopy has increased in the detection and diagnosis of infectious and genetic diseases [6]. Raman spectroscopy is based on an inelastic scattering of light photons after an interaction with intra-molecular bonds of a sample being probed. The shift produced in the frequency of scattered light photons provides information about the molecular composition of the given sample. Diseases are linked to change in molecular morphology and composition that results in deviation from the normal molecular vibrational pattern. This distinction thus serves as a phenotypic marker for disease detection in Raman spectroscopy [7].
Due to the complex structure of Raman spectra of biological samples, one cannot differentiate the spectra of the pathological samples from the normal ones with the naked eye. Shortcomings of Raman spectroscopy for better detection of disease are usually overcome by combining with multivariate statistical analysis and classification methods such as principal component analysis (PCA), linear discriminant analysis, and support vector machine etc [8]. Different studies have utilized Raman spectroscopy based blood serum analysis for diagnosis and detection of biochemical alteration in various diseases such as dengue, cancer, malaria, hepatitis B [6,9–12]. In the current study, Raman spectroscopy together with machine learning approaches have been exploited for detection of disease related spectral changes in HCV infected individuals. In this work, Raman spectra of blood serum of hepatitis C positive and negative individuals have been used for the development of a diagnostic system that exploits transformed Raman spectrum using proximity based machine learning technique and is denoted as RS-PCA-prox. Raman spectrum generates feature rich data that spans over redundant and non-discriminative features. Therefore, the proposed study is augmented with different feature transformation techniques, in order to analyse their potential in learning the alteration in Raman shifts. Distinct information of spectrum (features comprising maximum variance) is fetched through orthogonal transformation and maximization of margins’ distance between opposite class instances by performing PCA, factor analysis (FA), and large margin nearest neighbor (LMNN). The performance of the proposed system is compared with linear and ensemble based classifiers. It is observed that proximity based classification is quite promising in learning the deviation in the Raman shifts, once transformed using PCA. Moreover, PCA based feature transformation coupled with machine learning techniques can alleviate the predictive power of Raman spectra.
2. Materials and methods
2.1 Sample collection and preparation
Blood serum of 227 individuals, both male and female and of different age groups is collected from Holy Family Hospital Rawalpindi, Pakistan. Out of 227 samples, 105 are from healthy individuals, whereas 122 samples are from HCV infected individuals. All the HCV infected patients considered for this study did not have any other infection or disease. Non-heparinized peripheral blood is used for the study purpose; a quantity of 3 ml is acquired through a syringe and stored in clot activator tubes (HebeiXinle, Sci&Tech Co. Ltd., China). Samples from all these subjects have been collected at different times. Samples from collection point have been brought to the laboratory in a specially designed container having ice packs. Serum from all these samples has been extracted on the same day. This study is conducted after obtaining written permission from each patient and ethical commission of Rawalpindi Medical College, Pakistan.
2.2 Acquiring Raman spectra
For the recording of Raman spectrum, the quantity of about 10μl blood serum of each sample is put on an aluminum substrate. Raman system (PeakSeeker Pro, Agiltron USA) has been used for recording of spectra. This system consists of laser source coupled with the microscope emitting laser light at 785nm. Before the acquisition of Raman spectrum of blood serum samples, the system is rectified to 520 cm−1 Raman peak of the silicon wafer. The spectra from all samples have been acquired in a spectral range of 300-1800 cm−1. Laser light is focused on the sample surface through microscope objective having 10x magnifications having numerical (NA = 0.25). The Raman scattered light has been collected with the help of the same objective in the back scattering configuration. An acquisition time of 5 seconds with the laser power of 30 mW is used for the recording of each spectrum. For each sample, three spectra are recorded and an average of these values is used as a representative spectrum.
2.3 Data pre-processing
Strong fluorescence signal that is intrinsically emitted by biological compounds always exists in the Raman spectrum of biological samples [13]. Before making spectral analysis, it is necessary to filter out background noise from spectrum [13–17]. Smoothening, de-noising, baseline correction and normalization methods have been used for background cleaning. Initially, the spectra are adjusted by applying moving average Savitzky-Golay smoothing filter, over a span of 5 points and by using the polynomial kernel of order 3. The baseline of peaks has been corrected by employing “msbackadj” function which uses spline approximation [18,19]. After this, all spectra have been vector-normalized.
2.4 Classification system
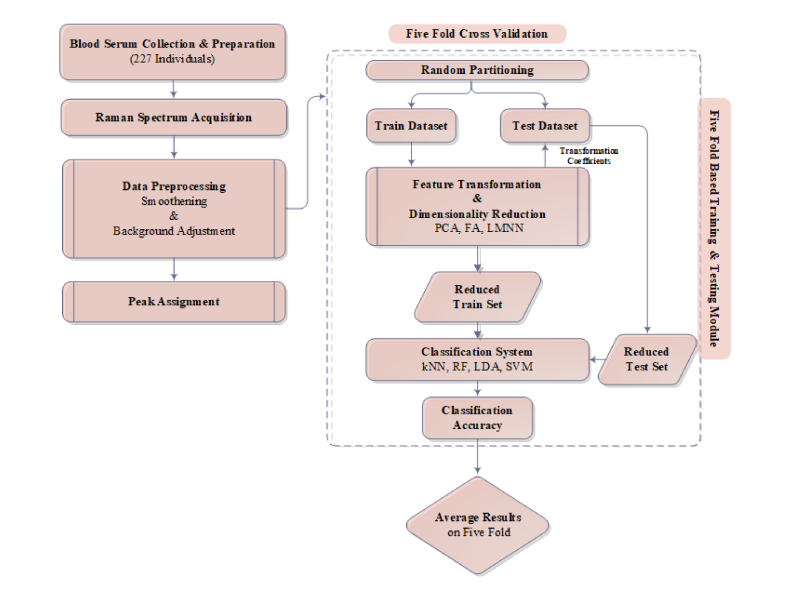
In order to develop classification system, data samples are randomly permuted in order to avoid bias towards any specific sample during the training phase. Preprocessing of the data for model development involves dimensionality reduction which is attained by employing PCA, FA and LMNN implemented in Matlab2016a [20]. Spectrum valuesare subtracted from a mean value and a mean centered data is used for dimensionality reduction. In order to avoid overfitting, test samples are separated from training samples and both are transformed to new coordinate system separately. The classification system is developed by performing training of kNN, RF, LDA, and SVM on reduced data set implemented in Matlab 2016a. Model is evaluated by employing five-fold cross-validation evaluation measure. Data set is randomly partitioned into five disjoint sets, each time; one set is used for a test while remaining four data sets are jointly used for training. This procedure is repeated five times and each time different training and test sets are used [21]. The classification model is tuned by adjusting k = {1,3,5,7,9} neighbors and different distance measures for kNN while adjusting a set of different base learners from n = 10 to 5000 trees for RF. Whereas SVM performance is optimized for linear, polynomial and RBF kernels. Performance of the proposed classification system is evaluated by confusion matrix. The confusion matrix is a M x M matrix that shows a proportion of predicted versus actual classes in which each column corresponds to predicted instances and row shows true instances. Decision power of the model is determined by specificity , sensitivity, and accuracy . Discrimination performance of classifiers is compared by receiver operating characteristic curves (ROC) and area under the ROC curve (AUC).
Fig. 1.
Block diagram of the proposed RS-PCA-Prox detection system.
2.5 Related theory
2.5.1 RF based ensemble classification
RF is an ensemble based classification algorithm built on a collection of decision trees used as base learners. RF combines bagging and bootstrapping techniques and randomly draws ‘n’ number of samples () from training data set during the training phase. For each sample, it grows an unpruned tree and defines node split by selecting the best predictor from a subset of randomly chosen predictors at each node . For new data instance the class label is assigned based on majority of the labels predicted by base classifiers [22,23].
| (1) |
2.5.2 kNN based classification
kNN is a proximity based classification technique in which each instance is discriminated on the intuition that it belongs to a class of itsnearest neighbors. In nearest neighbors’ rule, the distance of test instance is calculated from its nearest neighbors that belong to class and test instance is assigned a class of its maximum neighbors among nearest neighbors [24]. The vote assigned by to is same as of its class label then returns 1.
| (2) |
2.5.3 LDA based classification
LDA is a linear classifier. It separates the two classes by projecting hyperplane that maximizes the distance between means of two classes, whereas it minimizes within class variance. Thus, it requires inter and intraclass scatter matrix and projection plane is defined as below,
| (3) |
is known as fisher linear projection criterion. Input vector x that maximizes this criterion; is termed as fisher optimal projection axis, which is defined as in Eq. (4) [25].
| (4) |
2.5.4 SVM based maximum margin classification
SVM is a linear supervised machine learning algorithm. SVM takes input from samples in the form of a pair, where is a sample in a feature space and is its label. SVM linearly differentiates pattern for binary classification problem by defining a hyperplane (5) in such a way that it maximizes the distance between closely placed training instances that belong to the opposite classes. Input training samples that are near to hyperplane are known as support vectors. If two classes are linearly separable, then hyperplane bifurcates two classes in such a way that all samples of that belong to the same class are on one side. The optimal hyperplane is defined by imposing constraint as mentioned below in Eq. (6,7) [26]. In (5), is a weight vector that is orthogonal to hyperplane whereas c is bias.
| (5) |
| (6) |
| (7) |
2.5.5 PCA based feature transformation
PCA linearly decomposes data , into principal components by projecting data into low dimensional space, where L is a transformation function. The linear transformation function L is used to maximize the variance of the projected inputs, subject to the constraint that transformation function defines a projection matrix. The variance of the projected inputs is expressed in terms of the covariance matrix C. Each transformed component is orthogonal to the successive component, and is based on finding variance in the direction of its eigenvector [27].
| (8) |
| (9) |
is mean value of feature vector, n is the total number of data points whereas is transformation function.
2.5.6 FA based feature transformation
FA takes into account the linear relation among a set of m intercorrelated random variables (features)by analysing variance among them in terms of a set of common factorsare fewer than the variables [28].
| (10) |
are variables, are factors, is called factor loading and is an error term.
2.5.7 LMNN based feature transformation
LMNN trains a Mahalanobis metric M that performs a global linear transformation of the input sample space supplemented by kNN classification. For every instance, number of neighbors are selected within a distance such that instance having the same class label as an instance , is known as target neighbor. The target neighbors are nearest neighbors under learned matric, whereas neighbor known as imposter is also nearest neighbor but belongs to a different class . The metric is trained so that the nearest neighbors always have same class while examples from different classes are separated by a large margin [29].
| (11) |
| (12) |
| (13) |
3. Results and discussion
Raman spectroscopy generates multiple samples for each individual, therefore manual spectral analysis becomes time-consuming, prone to error and is liable to have an element of human subjectivity. Machine learning based diagnostic systems have paved way for simultaneous analysis of multiple samples in short time and highly accurate diagnosis of disease with low error rate. In order to screen HCV infected individuals, the proposed RS-PCA-Prox analyses Raman spectrum data and discriminates infected and normal individuals by employing kNN in the transformed domain. Performance of the proposed RS-PCA-Prox is compared with linear and ensemble based classifiers.
3.1 Raman spectral data analysis
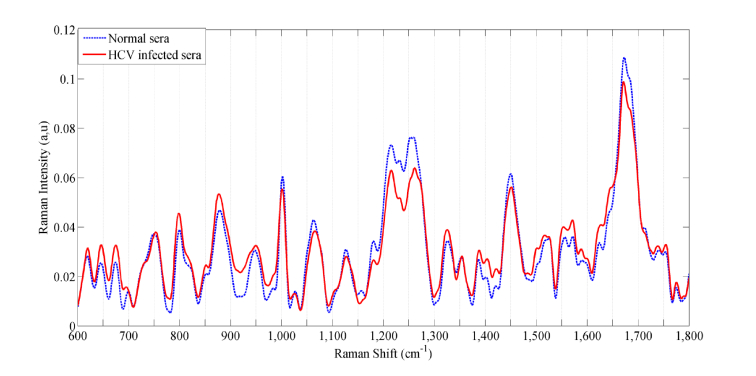
Blood serum of HCV positive and negative individuals is used for Raman spectroscopic analysis. Human blood serum constitutes different biomolecular components such as lipids, fats, vitamins, minerals, hormones, glucose and immunoglobulins (IgMs) [30]. Raman peaks in spectrum correspond to different biomolecules. Molecular information is assigned to each spectral peak based on vibrational bond information [31]. Mean Raman spectra of normal and HCV infected blood serum are shown in Fig. 2. For the purpose of reader clarity, normalized mean spectra of the control group are shown in blue color (dashed line), whereas, the mean spectra of HCV infected sera samples are shown in red color (solid line) (Fig. 2). The diseased, as well as normal samples, have an almost similar pattern, but there is a precise difference in the intensity of Raman shifts. The variations observed for Raman intensities are found at 712, 800, 875, 911, 1004, 1166, 1220, 1250-1300, 1340, 1393-1430, 1449 and 1675 cm−1.
Fig. 2.
The plot of the mean spectral difference between HCV infected (red) and normal blood sera (blue).
3.2 Raman spectra transformation using PCA
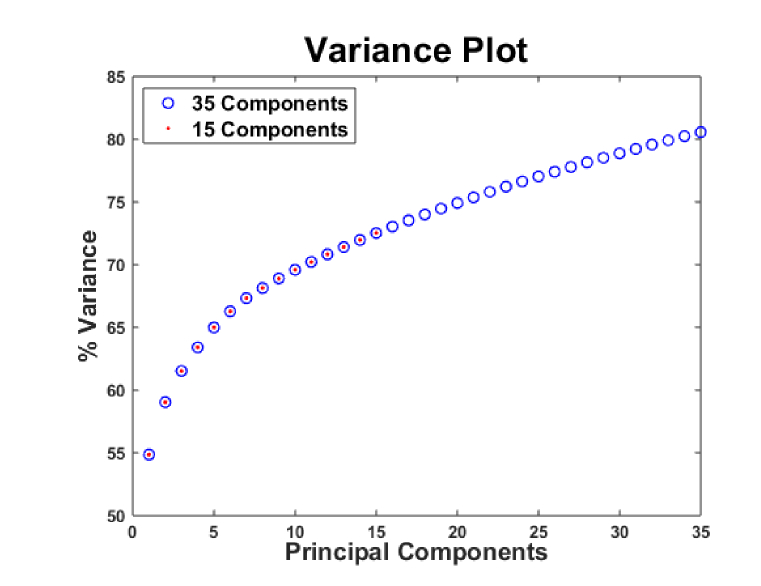
The analysed Raman spectra comprehend the information of components that profile the blood serum composition of normal and infected patients (Fig. 2). As compared to normal individuals, Raman spectra of diseased individuals show discernable changes in intensity for various bimolecular components of HCV infected individuals (Fig. 2). These distinctions between HCV positive and negative individuals thus serve as phenotypic markers for disease detection. Therefore, spectra of biomolecular components such as IgMs, lipids, carbohydrates etc. are used as a feature space for classification system development. However, in this work, it is observed that performance of the proposed RS-PCA-Prox can be enhanced by transforming the Raman feature space. In order to derive the transformed and reduced feature set, the entire spectrum is considered to identify spectral features that contribute to maximum variance. PCA based transformation is applied which reduced the original high dimensional data set to 181 components, out of which the first 35 components represent about 80% of the variance and 15 components represent about 75% of the spectral variance (Fig. 3). However, the remaining 145 components contribute less than 1% of the variance. In order to find out the transformation that best describes the behavior of Raman data, FA and LMNN based transformations are also analysed in addition to PCA.
Fig. 3.
Variance plot for principal components.
3.3 Proximity based classification of PCA transformed data
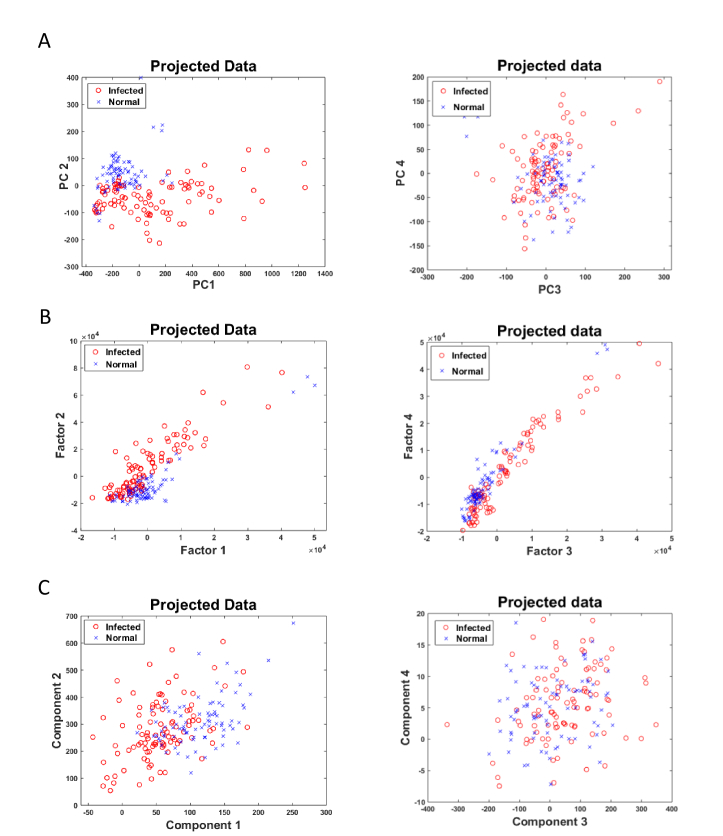
In order to develop classification system, blood samples are divided into 80:20 ratio for training and test set respectively. The decision to choose the number of features is critical for the performance of the classifier. The significant number of features for the proposed RS-PCA-Prox is selected by performing both grid search and analysis of variance plot. It is not necessary for the first few components that capture maximum variance, to correspond to the best discrimination power [10]. The distribution of first two transformed features of PCA, FA and LMNN (Fig. 4) shows that the two classes are overlapping and cannot be classified by considering only the first two dimensions of the data. The number and choice of features have considerable influence on the accuracy and training time of classifier. It is observed that training on 15 PCs (contribute ~75% variance) (Fig. 3) produces classifier performance whose accuracy is similar to that of 35 PCs (contribute 80% variance) (Fig. 3), therefore in order to reduce computational complexity and to avoid overfitting, 15 PCs are used for training. The number of transformed features used for training of classification model is mentioned in Table 1, Table 2 and Table 4.
Fig. 4.
Distribution of samples using feature 1 vs feature 2 and feature 3 vs feature 4 of the reduced dataset, (A) Mapping of PCA: PC1 vs PC2, and PC3 vs PC4 (B) Mapping of FA: Factor1 vs Factor2, and Factor3 vs Factor4 (C) Mapping of LMNN: component 1 vs component 2 and component 3 vs component 4.
Table 1. Performance of kNN on PCA transformed test data.
|
Performance
Measure |
PCA
15 components |
|||||||||
|---|---|---|---|---|---|---|---|---|---|---|
|
| ||||||||||
| kNN | k = 1 | k = 3 | k = 5 | k = 7 | k = 9 | |||||
| TP | 24 | 23 | 24 | 24 | 22 | |||||
| TN | 20 | 19 | 20 | 20 | 18 | |||||
| FP | 2 | 2 | 1 | 1 | 3 | |||||
| FN | 1 | 1 | 1 | 1 | 3 | |||||
| Accuracy | 93.48% | 93.04% | 95.22% | 93.48% | 92.17% | |||||
| Sensitivity | 0.97 | 0.94 | 0.97 | 0.96 | 0.96 | |||||
| Specificity | 0.90 | 0.92 | 0.94 | 0.91 | 0.88 | |||||
TP; ture positives, TN; true negatives, FP; false positives, FN; false negatives
Performance of kNN on test data is evaluated by five-fold cross-validation. TP, TN, FP and FN values are reported only for one-fold whereas an average value of sensitivity, specificity and accuracy is reported for five folds.
Table 2. Performance of kNN on FA and LMNN transformed test data.
|
Performance
Measure |
FA
25 components |
LMNN
5 components |
||||||||
|---|---|---|---|---|---|---|---|---|---|---|
|
| ||||||||||
| kNN | k = 1 | k = 3 | k = 5 | k = 7 | k = 9 | k = 1 | k = 3 | k = 5 | k = 7 | k = 9 |
| TP | 23 | 23 | 24 | 24 | 23 | 21 | 19 | 19 | 18 | 21 |
| TN | 19 | 20 | 16 | 18 | 18 | 16 | 17 | 17 | 19 | 15 |
| FP | 2 | 2 | 5 | 3 | 3 | 6 | 5 | 5 | 2 | 6 |
| FN | 2 | 1 | 1 | 1 | 2 | 3 | 6 | 6 | 7 | 4 |
| Accuracy | 90.43% | 90.43% | 88.70% | 87.83% | 86% | 77.83% | 75.22% | 76.52% | 76.96% | 76.96% |
| Sensitivity | 0.92 | 0.92 | 0.94 | 0.93 | 0.91 | 0.80 | 0.76 | 0.76 | 0.76 | 0.76 |
| Specificity | 0.89 | 0.89 | 0.83 | 0.82 | 0.80 | 0.76 | 0.75 | 0.78 | 0.79 | 0.79 |
TP; true positives, TN; true negatives, FP; false positives, FN; false negatives
Performance of kNN on test data is evaluated by five-fold cross-validation. TP, TN, FP, and FN values are reported only for one-fold whereas an average value of sensitivity, specificity and accuracy is reported for five folds.
Table 4. Performance of RF on the transformed test data.
|
Performance
Measure |
PCA
13 components |
FA
15 components |
LMNN
5 components |
||||||
|---|---|---|---|---|---|---|---|---|---|
|
| |||||||||
| RF | n = 120 | n = 500 | n = 1000 | n = 120 | n = 500 | n = 1000 | n = 120 | n = 500 | n = 1000 |
| TP | 22 | 21 | 21 | 21 | 21 | 22 | 18 | 18 | 19 |
| TN | 21 | 19 | 19 | 19 | 21 | 19 | 18 | 19 | 19 |
| FP | 1 | 2 | 2 | 2 | 1 | 2 | 3 | 3 | 3 |
| FN | 3 | 4 | 4 | 3 | 3 | 2 | 7 | 7 | 5 |
| Accuracy | 91.20% | 89.13% | 90% | 89.57% | 86.96% | 89.13% | 78.26% | 77.83% | 77.83% |
| Sensitivity | 0.88 | 0.85 | 0.86 | 0.89 | 0.86 | 0.87 | 0.74 | 0.73 | 0.73 |
| Specificity | 0.95 | 0.93 | 0.94 | 0.89 | 0.88 | 0.92 | 0.83 | 0.83 | 0.83 |
TP; true positives, TN; true negatives, FP; false positives, FN; false negatives
Performance of RF on test data is evaluated by five-fold cross-validation. TP, TN, FP, and FN values are reported only for one-fold whereas an average value of sensitivity, specificity, and accuracy is reported for five folds.
Proximity based classification system RS-PCA-Prox is developed by performing training on principal components. Once the training of the model is achieved, the performance of the classification system is assessed through accuracy, sensitivity and specificity parameters on test data. kNN shows satisfactory diagnostic power on PCA based transformed data set for 15 PCs with an average accuracy, sensitivity, and specificity of 95%, 0.97 and 0.94 respectively (Table 1).
3.4 Transformed vs original domain analysis
kNN performance in PCA transformed domain is compared with its performance in FA and LMNN transformed feature space. It is noted that the accuracy of the diagnostic system is decreased by 6.52% and 18.7% on LMNN and FA based transformed features, respectively (Table 2). In order to analyse the importance of feature transformation, in learning the deviation of Raman shifts, the classification model is also trained by considering all Raman shifts in the original domain. The analysed spectral data in original space consists of 782 features. In the original domain, even though with high dimensional feature space and thus high complexity and computational time, the accuracy is dropped by 0.3% as compared to PCA transformed feature space (Table 3). This performance drop is mainly due to the presence of redundant and correlated features in high dimensional Raman spectrum that causes overfitting of classification model [32].
Table 3. Performance of kNN in the original domain.
| Performance Measure | k = 1 | k = 3 | k = 5 | k = 7 | k = 9 |
|---|---|---|---|---|---|
| TP | 23 | 24 | 24 | 24 | 24 |
| TN | 18 | 18 | 18 | 17 | 17 |
| FP | 3 | 3 | 3 | 4 | 4 |
| FN | 2 | 1 | 1 | 1 | 1 |
| Accuracy | 92.61% | 92.61% | 90.43% | 90.43% | 90.43% |
| Sensitivity | 0.97 | 0.98 | 0.98 | 0.98 | 0.99 |
| Specificity | 0.88 | 0.87 | 0.81 | 0.81 | 0.80 |
TP; ture positives, TN; true negatives, FP; false positives, FN; false negatives
Performance of kNN on untransformed test data is evaluated by five-fold cross-validation. TP, TN, FP and FN values are reported only for one-fold whereas an average value of sensitivity, specificity and accuracy is reported for five folds.
3.5 RS-PCA-Prox comparison with ensemble classifier
Performance of proximity based classifier is evaluated with ensemble based classifier RF, which uses a collection of decision trees. RF gives the best result for an ensemble of 120 decision trees (base learners) with 91% accuracy, 0.88 sensitivity and 0.95 specificity on PCA reduced test data set (Table 4). RF like kNN, achieves the best result on PCA based transformed data set rather than on transformation that is based on LMNN and FA. As compared to PCA, the performance of RF on FA and LMNN is degraded in terms of accuracy by 1.63% and 12.94% respectively (Table 4). The comparison of classifiers trained on PCA, FA and LMNN based transformed feature space shows that both kNN and RF outperform when PCA based feature space is used (Table 1, Table 2 & Table 4).
3.6 RS-PCA-Prox comparison with linear classifier in PCA domain
In order to assess the performance of the linear classifiers on Raman data as compared to kNN which is a non-linear classifier, SVM and LDA are implemented on PCA transformed Raman spectrum. Results of LDA and SVM are shown in Table 5. It is noted that LDA based classification results are comparable with kNN results. This suggests that LDA can be utilized for classification of HCV infected individuals based on biomolecular content with an accuracy of 95%. However, LDA is less sensitive than kNN for detection of HCV positive individuals. Similar to LDA, SVM is also a linear classifier but its learning method is different. The experimental results of SVM also show acceptable performance on PCA transformed Raman spectrum data with an average accuracy of 94%, however, its performance in comparison with kNN is decreased by 0.88% in terms of accuracy.
Table 5. Performance comparison of kNN with LDA and SVM on PCA transformed test data.
|
Performance
Measure |
kNN
(k = 5) |
LDA |
SVM
(kernel = linear) |
|---|---|---|---|
|
| |||
|
PCA
15 components |
PCA
15 components |
PCA
15 components |
|
| TP | 25 | 25 | 23 |
| TN | 20 | 20 | 20 |
| FP | 1 | 1 | 1 |
| FN | 0 | 0 | 2 |
| Accuracy | 95.22% | 95% | 94.35% |
| Sensitivity | 0.97 | 0.97 | 0.94 |
| Specificity | 0.94 | 0.93 | 0.95 |
TP; ture positives, TN; true negatives, FP; false positives, FN; false negatives
Diagnostic ability of kNN is compared with LDA and SVM. Performance is evaluated on test data by using five-fold cross-validation. TP, TN, FP and FN values are reported only for one-fold whereas an average value of sensitivity, specificity and accuracy is reported for five folds.
3.7 Decision surface based analysis of Raman shifts and its biochemical significance
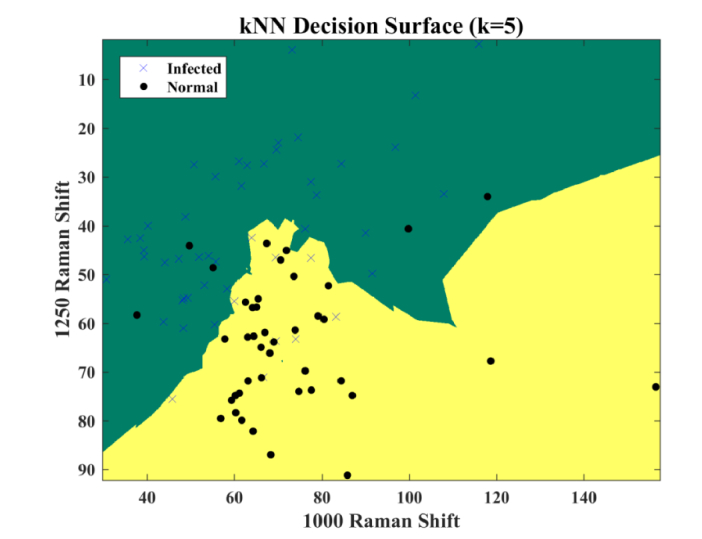
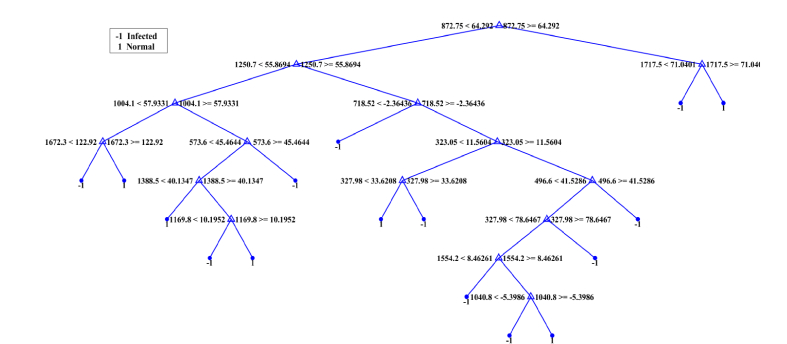
In order to characterize the potential of identified peaks for their use as biomarkers for the development of machine learning based diagnostic system, decision surface of kNN and RF is drawn and shown in Fig. 5 and Fig. 6. The decision surface of kNN for 1000 and 1225 cm−1 Raman shift with k = 5 is shown in Fig. 5, that shows good separation between two classes. In order to pinpoint the molecules that are used as discriminating factors by the RF, the splitting criterion of one of the decision trees (base classifier) of the ensemble is shown in Fig. 6. In the decision tree, 718, 872, 1004, 1169, 1250 cm−1 Raman shifts are the characteristic peaks which are used as a classifier by RF. Identified peaks can be used as biomarkers for detection of the disease. Raman shift 718 cm−1 corresponds to a vibrational band of chitin that stimulates type-I and type-II dependent innate immune response in response to viral infection [33]. Due to the infection, the remains of viral protein are also present in human blood serum which correspond to 872 cm−1 [34]. Raman shift of 1004 cm−1 is observed for lectin which is a carbohydrates binding protein. Mannose-binding lectin is one such molecule which on attachment with virus mediates lectin complement pathway that kills virus [35]. 1169 cm−1 peak corresponds to lipids where 1250 cm−1 is assigned to ammonia whose level increases in infected individuals, as liver damaged by HCV infection fails to detoxify ammonia [36]. Lipids are associated with proteins that stimulate destruction process of hepatocytes. Due to this destruction, the concentration of various biomolecules such as lipids, enzymes, proteins etc. are changed in infected individuals. These identified peaks correlate with diagnostically significant Raman spectrum region (Fig. 2, section 3.1.) and also show agreement with [34,37] and Bilal et al., findings which have reported the correlation of 718, 872, 1004, 1169, 1250 cm−1 with HCV infection [36].
Fig. 5.
Decision surface of kNN for 1000 and 1250 cm−1 Raman shift (2 features space). Blue crosses depict infected individuals while black dots show normal individuals.
Fig. 6.
An example of the decision tree (base learner in RF ensemble) generated by RF. Node values correspond to Raman shifts (718, 872, 1004, 1169, 1250) that are correlated with the diagnostically significant Raman peaks. Decision tree is defined by 15 splits whereas terminal nodes show outcome class, i.e, infected (−1) and normal (1).
3.8 ROC based analysis
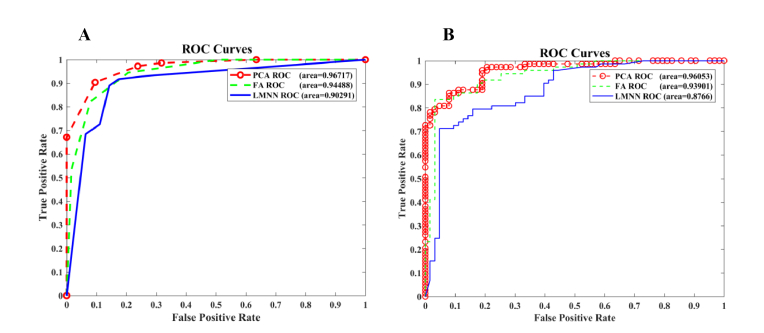
Diagnostic power of RS-PCA-Prox classification system to separate HCV infected from healthy individuals is apparent from ROC as shown in Fig. 7. ROC curve defines the tradeoff between sensitivity vs 1-specificity by specifying the true positive rate against the false positive rate for the different possible probable thresholds of a diagnostic test. The more close the AUC to one is, the more reliable diagnostic test is, however as curve comes to the 45-degree diagonal, the randomness increases and becomes less accurate [38]. It is clearly depicted from Fig. 7A that the performance of kNN on PCA based transformed feature space in terms of area under the ROC curve is 0.96, which is better in comparison to the performance of kNN on FA and LMNN based transformed features. Similarly, RF also shows best results on PCA based transformed feature space (Fig. 7B).
Fig. 7.
Receiver operating characteristic curve for kNN and RF on 60% test dataset, (A) ROC curve for kNN classification system, (B) ROC curve for RF classification system.
4. Conclusion
This work presents the use of Raman spectroscopy in combination with different dimensionality reduction techniques (PCA, FA, and LMNN) and classifiers (kNN, RF, LDA, SVM) for the detection of HCV infection. It is shown that biomolecular information provided by Raman spectrum can be exploited by machine learning algorithms for enhancing diagnostic abilities of Raman spectroscopy. Major spectral deviations are caused by variation in the intensity level of lectin, chitin, lipids, ammonia and viral protein as a consequence of hepatitis C infection. Variation in the ratio of phospholipid and lipids concentration is noted in HCV infected individuals, as these are associated with enzymes that are activated during destruction process of hepatocytes in hepatitis [37]. When the virus attacks the host, the immune system of a human is activated against the virus. In this response, chitin is released which enhances viral, type-I and type-II dependent immune response [33]. Similarly, mannose-binding lectin proteins are produced by the liver in HCV infected individuals that upon attachment with HCV, initiate complement cascade pathway. Some of the biomolecular changes are disease associated, such as liver damage due to hepatitis that raises the level of ammonia in patients [40]. The biochemical characterization of the concentration of these biological molecules is used as an important marker during the development of machine learning system for detection of HCV infection. It can be observed that application of the proximity based approach to Raman spectral data is a valuable and promising tool with an overall accuracy of 95% for the proposed RS-PCA-Prox detection system. The corresponding sensitivity and specificity are calculated as 0.97 and 0.94 respectively (Table 1). Performance measures depict that proximity based approach (kNN) optimizes the design of RS-PCA-Prox system for spectrum pattern recognition and discrimination of infected individuals as compared to RF and SVM (Table 1, Table 3-5). This work suggests that in comparison to FA and LMNN, PCA based transformation of Raman spectrum data is more appropriate for the training of machine learning based classification system. PCA projects the data from a higher dimension to lower dimension space by using linear transformation function and retains maximum variation of features, whereas FA assumes common factor for all instances that models the variance of the features and removes correlated features due to which it loses the variance of some features [27,39]. LMNN based feature transformation affects classifier’s performance by causing overfitting of the model on the training data and decreases the performance of the classifier on test data by 17% in terms of accuracy (accuracy: 77.83%) (Table 2) and discrimination power, (AUC: 0.90) (Fig. 7(A)).
Acknowledgments
We acknowledge Pakistan Institute of Engineering and Applied Science (PIEAS) for healthy research environment which leads to the research work presented in this article. We are also grateful to Mrs. Fatima Batool and Muhammad Irfan, Agri-biophotonics Laboratory, National Institute for Lasers & Optronics, for scientific assistants of our group, for supporting us in conducting this research work.
Disclosures
The authors declare that there are no conflicts of interest related to this article.
References and links
- 1.Messina J. P., Humphreys I., Flaxman A., Brown A., Cooke G. S., Pybus O. G., Barnes E., “Global distribution and prevalence of hepatitis C virus genotypes,” Hepatology 61(1), 77–87 (2015). 10.1002/hep.27259 [DOI] [PMC free article] [PubMed] [Google Scholar]
- 2.Henderson D. K., “Managing Occupational Risks for Hepatitis C Transmission in the Health Care Setting,” Clin. Microbiol. Rev. 16(3), 546–568 (2003). 10.1128/CMR.16.3.546-568.2003 [DOI] [PMC free article] [PubMed] [Google Scholar]
- 3.Firdaus R., Saha K., Biswas A., Sadhukhan P. C., “Current molecular methods for the detection of hepatitis C virus in high risk group population: A systematic review,” World J. Virol. 4(1), 25–32 (2015). 10.5501/wjv.v4.i1.25 [DOI] [PMC free article] [PubMed] [Google Scholar]
- 4.Uliana C. V., Riccardi C. S., Yamanaka H., “Diagnostic tests for hepatitis C: recent trends in electrochemical immunosensor and genosensor analysis,” World J. Gastroenterol. 20(42), 15476–15491 (2014). 10.3748/wjg.v20.i42.15476 [DOI] [PMC free article] [PubMed] [Google Scholar]
- 5.Ghany M. G., Strader D. B., Thomas D. L., Seeff L. B., American Association for the Study of Liver Diseases , “Diagnosis, management, and treatment of hepatitis C: An update,” Hepatology 49(4), 1335–1374 (2009). 10.1002/hep.22759 [DOI] [PMC free article] [PubMed] [Google Scholar]
- 6.Neugebauer U., Clement J. H., Bocklitz T., Krafft C., Popp J., “Identification and differentiation of single cells from peripheral blood by Raman spectroscopic imaging,” J. Biophotonics 3(8-9), 579–587 (2010). 10.1002/jbio.201000020 [DOI] [PubMed] [Google Scholar]
- 7.Krafft C., Steiner G., Beleites C., Salzer R., “Disease recognition by infrared and Raman spectroscopy,” J. Biophotonics 2(1-2), 13–28 (2009). 10.1002/jbio.200810024 [DOI] [PubMed] [Google Scholar]
- 8.Villa-Manriquez J. F., Castro-Ramos J., Gutierrez-Delgado F., Lopez-Pacheco M. A., Villanueva-Luna A. E., “Raman spectroscopy and PCA-SVM as a non-invasive diagnostic tool to identify and classify qualitatively glycated hemoglobin levels in vivo,” J. Biophotonics 6, 1–6 (2016). [DOI] [PubMed] [Google Scholar]
- 9.Khan S., Ullah R., Khan A., Wahab N., Bilal M., Ahmed M., “Analysis of dengue infection based on Raman spectroscopy and support vector machine (SVM),” Biomed. Opt. Express 7(6), 2249–2256 (2016). 10.1364/BOE.7.002249 [DOI] [PMC free article] [PubMed] [Google Scholar]
- 10.Wang W., Zhao J., Short M., Zeng H., “Real-time in vivo cancer diagnosis using Raman spectroscopy,” J. Biophotonics 8(7), 527–545 (2015). 10.1002/jbio.201400026 [DOI] [PubMed] [Google Scholar]
- 11.Khan S., Ullah R., Javaid S., Shahzad S., Ali H., Bilal M., Saleem M., Ahmed M., “Raman Spectroscopy Combined with Principal Component Analysis for Screening Nasopharyngeal Cancer in Human Blood Sera,” Appl. Spectrosc. 71(11), 2497–2503 (2017). 10.1177/0003702817723928 [DOI] [PubMed] [Google Scholar]
- 12.Khan S., Ullah R., Khan A., Sohail A., Wahab N., Bilal M., Ahmed M., “Random Forest-Based Evaluation of Raman Spectroscopy for Dengue Fever Analysis,” Appl. Spectrosc. 71(9), 2111–2117 (2017). 10.1177/0003702817695571 [DOI] [PubMed] [Google Scholar]
- 13.Lasch P., Kneipp J., (Wiley-Interscience, 2008). [Google Scholar]
- 14.Camerlingo C., Zenone F., Perna G., Capozzi V., Cirillo N., Gaeta G. M., Lepore M., “An investigation on micro-Raman spectra and wavelet data analysis for pemphigus vulgaris follow-up monitoring,” Sensors (Basel) 8(6), 3656–3664 (2008). 10.3390/s8063656 [DOI] [PMC free article] [PubMed] [Google Scholar]
- 15.Kiefer W., Mazzolini A. P., Stoddart P. R., “Recent Advances in linear and nonlinear Raman spectroscopy I,” J. Raman Spectrosc. 38(12), 1538–1553 (2007). 10.1002/jrs.1902 [DOI] [Google Scholar]
- 16.Lieber C. A., Mahadevan-Jansen A., “Automated Method for Subtraction of Fluorescence from Biological Raman Spectra,” Appl. Spectrosc. 57(11), 1363–1367 (2003). 10.1366/000370203322554518 [DOI] [PubMed] [Google Scholar]
- 17.Rohleder D., Kiefer W., Petrich W., Str S., “Quantitative analysis of serum and serum ultrafiltrate by means of Raman spectroscopy,” Analyst (Lond.) 129(10), 906–911 (2004). 10.1039/b408927h [DOI] [PubMed] [Google Scholar]
- 18.Ruberto S., “Raman spectroscopic investigation of chondroitinase ABC treatment after spinal cord injury in an organotypic model,” thesis (2013).
- 19.Galli R., Uckermann O., Koch E., Schackert G., Kirsch M., Steiner G., “Effects of tissue fixation on coherent anti-Stokes Raman scattering images of brain,” J. Biomed. Opt. 19(7), 071402 (2014). 10.1117/1.JBO.19.7.071402 [DOI] [PubMed] [Google Scholar]
- 20.Van Der Maaten L. J. P., Postma E. O., Van Den Herik H. J., “Dimensionality Reduction: A Comparative Review,” J. Mach. Learn. Res. 10, 1–41 (2009). [Google Scholar]
- 21.Browne M. W., “Cross-Validation Methods,” J. Math. Psychol. 44(1), 108–132 (2000). 10.1006/jmps.1999.1279 [DOI] [PubMed] [Google Scholar]
- 22.Y. Li, C. Yan, W. Liu, and M. Li, “A principle component analysis-based random forest with the potential nearest neighbor method for automobile insurance fraud identification,” Appl. Soft Comput. J., in press, 1–10 (2017). 10.1016/j.asoc.2017.07.027 [DOI]
- 23.Liaw A., Wiener M., “Classification and Regression by randomForest,” R News 2, 18–22 (2002). [Google Scholar]
- 24.P. Cunningham and S. J. Delany, “K -Nearest Neighbour Classifiers,” Mult. Classif. Syst. 1–17 (2007).
- 25.Li M., Yuan B., “2D-LDA: A statistical linear discriminant analysis for image matrix,” Pattern Recognit. Lett. 26(5), 527–532 (2005). 10.1016/j.patrec.2004.09.007 [DOI] [Google Scholar]
- 26.Bhatia S., Prakash P., Pillai G. N., “SVM Based Decision Support System for Heart Disease Classification with Integer-Coded Genetic Algorithm to Select Critical Features,” Proc. World Congr. Eng. Comput. Sci. (2008). [Google Scholar]
- 27.Abdi H., Williams L. J., “Principal component analysis,” Wiley Interdiscip. Rev. Comput. Stat. 2(4), 433–459 (2010). 10.1002/wics.101 [DOI] [Google Scholar]
- 28.Gregson K., “Factor analysis,” Work Study 42(1), 10–11 (1993). 10.1108/EUM0000000002688 [DOI] [Google Scholar]
- 29.Weinberger K. Q., Saul L. K., “Distance Metric Learning for Large Margin Nearest Neighbor Classification,” J. Mach. Learn. Res. 10, 207–244 (2009). [Google Scholar]
- 30.Psychogios N., Hau D. D., Peng J., Guo A. C., Mandal R., Bouatra S., Sinelnikov I., Krishnamurthy R., Eisner R., Gautam B., Young N., Xia J., Knox C., Dong E., Huang P., Hollander Z., Pedersen T. L., Smith S. R., Bamforth F., Greiner R., McManus B., Newman J. W., Goodfriend T., Wishart D. S., “The human serum metabolome,” PLoS One 6(2), e16957 (2011). 10.1371/journal.pone.0016957 [DOI] [PMC free article] [PubMed] [Google Scholar]
- 31.Kiefer W., Mazzolini A. P., Stoddart P. R., “Recent Advances in linear and nonlinear Raman spectroscopy I,” J. Raman Spectrosc. 38(12), 1538–1553 (2007). 10.1002/jrs.1902 [DOI] [Google Scholar]
- 32.Peng Y., Wu Z., Jiang J., “A novel feature selection approach for biomedical data classification,” J. Biomed. Inform. 43(1), 15–23 (2010). 10.1016/j.jbi.2009.07.008 [DOI] [PubMed] [Google Scholar]
- 33.Lee C. G., Da Silva C. A., Dela Cruz C. S., Ahangari F., Ma B., Kang J., He C., Takyar S., Elias J. A., “NIH Public Access,” 1–28 (2013).
- 34.Nawaz H., Rashid N., Saleem M., Asif Hanif M., Irfan Majeed M., Amin I., Iqbal M., Rahman M., Ibrahim O., Baig S. M., Ahmed M., Bonnierg F., Byrnee H. J., “Prediction of viral loads for diagnosis of hepatitis C infection in human plasma samples using raman spectroscopy coupled with partial least squares regression analysis,” J. Raman Spectrosc. 48(5), 697–704 (2017). 10.1002/jrs.5108 [DOI] [Google Scholar]
- 35.Turner M. W., “The role of mannose-binding lectin in health and disease,” Neth. J. Med. 62, 4–9 (2004). [DOI] [PubMed] [Google Scholar]
- 36.Bilal M., Bilal M., Saleem M., Bilal M., Saleem M., Bilal M., Bilal M., Saleem M., Bilal M., “Raman spectroscopy – based screening of hepatitis C and associated molecular changes,” Laser Phys. Lett. 14(9), 095602 (2017). 10.1088/1612-202X/aa7d37 [DOI] [Google Scholar]
- 37.Saade J., Pacheco M. T. T., Rodrigues M. R., Silveira L., “Identification of hepatitis C in human blood serum by near-infrared Raman spectroscopy,” Spectrosc. Int. J. 22(5), 387–395 (2008). 10.1155/2008/419783 [DOI] [Google Scholar]
- 38.Haka A. S., Shafer-Peltier K. E., Fitzmaurice M., Crowe J., Dasari R. R., Feld M. S., “Diagnosing breast cancer by using Raman spectroscopy,” Proc. Natl. Acad. Sci. U.S.A. 102(35), 12371–12376 (2005). 10.1073/pnas.0501390102 [DOI] [PMC free article] [PubMed] [Google Scholar]
- 39.Kamadi V. S. R. P. V., Allam A. R., Thummala S. M., Rao P. V. N., “A computational intelligence technique for the effective diagnosis of diabetic patients using principal component analysis (PCA) and modified fuzzy SLIQ decision tree approach,” Appl. Soft Comput. 49, 137–145 (2016). 10.1016/j.asoc.2016.05.010 [DOI] [Google Scholar]
- 40.Khan A., Ayub M., Khan W. M., “Hyperammonemia Is Associated with Increasing Severity of Both Liver Cirrhosis and Hepatic Encephalopathy,” Int. J. Hepatol. 2016, 6741754 (2016). 10.1155/2016/6741754 [DOI] [PMC free article] [PubMed] [Google Scholar]


