Abstract
Complete removal of a glioblastoma multiforme (GBM), a highly malignant brain tumor, is challenging due to its infiltrative characteristics. Therefore, utilizing imaging agents such as fluorophores to increase the contrast between GBM and normal cells can help neurosurgeons to locate residual cancer cells during image guided surgery. In this work, Raman tag based labeling and imaging for GBM cells in vitro is described and evaluated. The cell membrane of a GBM adsorbs a substantial amount of functionalized Raman tags through overexpression of the epidermal growth factor receptor (EGFR) and “broadcasts” stronger pre-defined Raman signals than normal cells. The average ratio between Raman signals from a GBM cell and autofluorescence from a normal cell can be up to 15. In addition, the intensity of these images is stable under laser illuminations without suffering from the severe photo-bleaching that usually occurs in fluorescent imaging. Our results show that labeling and imaging GBM cells via robust Raman tags is a viable alternative method to distinguish them from normal cells. This Raman tag based method can be used solely or integrated into an existing fluorescence system to improve the identification of infiltrative glial tumor cells around the boundary, which will further reduce GBM recurrence. In addition, it can also be applied/extended to other types of cancer to improve the effectiveness of image guided surgery.
OCIS codes: (170.5660) Raman spectroscopy, (180.5655) Raman microscopy, (160.4236) Nanomaterials, (170.1530) Cell analysis, (280.1415) Biological sensing and sensors
1. Introduction
Glioblastoma multiforme (GBM) is a highly malignant brain tumor which is categorized as a grade IV tumor by the WHO. After conventional treatment (i.e. surgery, radiation therapy), the median survival of the patients is approximately 13 months [1-2]. The recurrence of GBM is associated with the completeness of the GBM resection [1-2]. The complete removal of GBM through surgery is challenging due to the invasive nature of GBM tumors whose finger-like tentacles aggressively infiltrate the normal tissue [3]. Therefore, the boundary of the GBM tumor is usually not clearly defined. This becomes the main obstacle to effective GBM treatment. Gross-total resection of GBM is not always possible, especially for the GBM tumor occurring at functional regions of the brain. Therefore, to precisely locate the GBM cells and distinguish them from normal tissue is crucial for effective treatment.
Recently, the US FDA approved an imaging agent, ALA HCl (aminolevulinic acid hydrochloride), for fluorescence guided surgery to improve the accuracy of the GBM resection. Through metabolism, the injected ALA will lead to selective accumulation of PP-IX (Protoporphyrin IX) in GBM cells. This phenomenon is also observed in different kinds of tumors. PP-IX produces fluorescence when illuminated by blue light in the 375-440 nm range. Although the complete mechanism of PP-IX accumulation in GBM (and some other tumors) is still not fully understood [4–9], ALA induced fluorescence has been utilized to improve the GBM resection in the past two decades [10–12].
However, fluorescent labels are normally fragile and can easily be photo-bleached. Once the targeted fluorescent signals decay, the contrast will be reduced due to the autofluorescence from organelles or other components of the tissue, especially under short wavelength (i.e. blue light) excitation. In addition, the penetration depth of blue light is relatively shallow compared to red light and near-infrared excitation. In addition, the photo-toxicity of large amounts of fluorophores is still a concern. Furthermore, the broadband nature of fluorescence is not suitable for multiplexed imaging.
Therefore, various imaging methods other than fluorescence imaging have recently been applied to brain tumor surgery such as OCT (optical coherence tomography), Raman imaging, intraoperative MRI, intraoperative ultrasound etc [13–21]. Among them, Raman imaging provides good spatial resolution and spectral features distinguishable from background autofluorescence. Thus, label-free and Raman tag based methods have been widely used for cell or tissue identification [22–25]. For the Raman tag based imaging, SERS substrates of the tags in most of the previous studies can be divided into three categories: single spherical particles, star-shaped particles, and random particle clusters. The single spherical particles provide limited SERS enhancement. For example, for a 50 nm gold nanoparticle at visible regime, SERS enhancement is on the order ~200. The star-shaped particles can provide high but shape-sensitive enhancement. The random particle clusters provide an unpredictable number of hot spots. These low or unstable SERS sources will limit their clinical applications. In addition, the contrast between the labeled tumor and the normal cells is not fundamentally estimated in the previous studies.
In this work, the robust and brilliant Raman tags based on core-satellite assemblies we recently reported [26] are functionalized with antibodies to label GBM cells. The preparation of these tags is straightforward and efficient. Those tags have the stable number of hot spots with extremely high SERS enhancement on the order of 109. In addition, the tags are stable through multiple surface modification. The specific binding between Raman tags and fixed/living GBM cells are demonstrated. The imaging intensity contrast between the targeted tumor cells and normal cells are experimentally assessed. Finally, the stability of the Raman image is evaluated.
2. Methods
2.1 Raman tags preparation
The backbone of a Raman tag was composed of a 50 nm core and several 20 nm satellite gold nanoparticles through the polyelectrolyte linker, PAH(poly(allylamine hydrochloride), Sigma). For the Raman reporter embedded tags, the reporter molecules coated core particles via thiol bonds before the attachment of PAH and satellite particles. The detailed steps were described in the previous report [26]. After the formation of core-satellite assemblies (CSA), the silica shell was formed by hydrolysis of TEOS (tetraethyl orthosilicate, Showa). The 1 mL solution containing CSA and unlinked satellite particles was centrifuged at 700 g for 15 min. After removal of 950 uL supernatant containing unlinked satellite particles, 150 uL water, 856 uL ethanol and 23 uL of 5 mM APTMS ((3-Aminopropyl)trimethoxysilane, Alfa Aesar) dissolved in ethanol were added. The amino terminal of APTMS was attached to the surface of CSA to form an anchor layer where silica would grow. The mixed solution was shaken for 15 min and then 58 uL of 4 mM TEOS (dissolved in ethanol) was added. The solution was shaken again for 15 min. The 23.4 uL of 24.85 mM NaOH was added to keep the pH value basic for the formation of silica. The solution was shaken again for 15 min. The 40.45 uL of 2.96 mM APTMS was added to increase the formation of the amino group on the surface of silica shell. The whole solution was incubated at 35°C and 800 rpm for 24 hr.
2.2 Surface modifications of Raman tags
The following surface modifications were performed in order to link anti-EGFR and silica shell of the Raman tags. In the first step, the amino group (-NH2) provided by APTMS was replaced by the carboxyl group (-COOH). The solution containing Raman tags was centrifuged at 700 g (for fifteen minutes) three times to remove the residual chemicals used for silica formation. The particle aggregates were resuspended in 291 uL DMF (Dimethylformamide, Alfa Aesar). Under a nitrogen environment, 208 uL of 0.1 M SA (Succinic anhydride, Acros Organics) was prepared in DMF and added to the colloidal solution. The mixed solution was incubated at 35 °C and 800 rpm. After 24 hr, the solution was centrifuged at 9900 g for 20 min to remove excess SA and the solvent was replaced by 250 uL DI water. The solution was centrifuged at 700 g for 15 min twice and then resuspended in 200 uL DI water. The solution was centrifuged at 700 g for 15 min and then resuspended in 200 uL DI water twice. After the third centrifugation, the aggregates were resuspended in the solution described below.
In the second step, the anti-EGFR was linked to the surface of Raman tags through an amide bond. This process was catalyzed by EDC (N-Ethyl-N’-(3-dimethylaminopropyl)carbodiimide hydrochloride, Sigma-Aldrich) and sulfo-NHS (N-Hydroxysulfosuccinimide sodium salt, Sigma-Aldrich). First, 0.1 M MES (2-(N-morpholino)ethanesulfonic acid, Sigma-Aldrich) buffer and 1x PBS buffer (0.01 M, pH 7.2) were prepared. The 125 uL of 8 mM EDC (in 0.1 M MES buffer) were added in order to dissolve the particle aggregates from the last centrifuge. Then, 125 uL of 20 mM sulfo-NHS (in 0.1 M MES buffer) was added. The particle solution was incubated at room temperature, 400 rpm for one hour to form an active ester bond. Then, the particle solution was centrifuged at 9900 g for 10 min for three times and resuspended by 250 uL of PBS buffer. After the last centrifuge, 235 uL of PBS buffer was added to resuspend the particles and then 15 uL of 0.5 mg/mL, EGFR antibodies were added. The mixed solution was incubated at 4°C, 80 rpm. After 16 hrs, the particle was centrifuged at 9900 g for 10 min three times and then finally resuspended in 200 uL of PBS buffer.
2.3 Cell culture
The GBM cells (CNS-1) were incubated in the Dulbecco’s modified eagle medium (DMEM) with 1% antibiotic-antimycotic solution, 0.1% gentamycin sulphate solution and 10% fetal bovine serum (FBS). The incubator was controlled under 37°C, 5% CO2 and 90% humidity. For normal cells (human astrocytes, HA), Geltrex basement membrane matrix stock solution was diluted 100x with DMEM and added to petri dishes. Every centimeter square of bottom surface needs 200 uL of the mixed solution. After one hour, the bottom surface was rinsed with 1x PBS buffer. The human astrocytes were cultured in a dish with DMEM containing 0.1% gentamycin sulphate solution, 1% N-2 supplement and 10% fetal bovine serum. The medium in the dish was replaced every two days. The incubation condition was the same as CNS-1.
Before the optical characterization, the cultured cells were transferred to the ITO-coated quartz substrates. First, the cells was rinsed with PBS buffer and then immersed in 500 uL of 0.05% Trypsin to detach from the dish. The 40000 cells were injected onto an ITO-quartz substrate in the 35 mm dish. The 2 mL FBS free medium was added. The 19 hr incubation was performed for the attachment of cells to the substrate.
2.4 Cell labeling
Both fixed and living cells were label by Raman tags. For labeling fixed cells, after the attachment to ITO-coated quartz substrates, live cells were rinsed with PBS buffer, immersed in 2 mL of 4% paraformaldehyde (fixing agents) for 15 min and then rinsed with PBS buffer three times (5 min for each time). Then 25 mM NH4Cl (dissolved in PBS buffer) were added to minimize the background fluorescence from paraformaldehyde. After 15 min, the fixed cells were rinsed with PBS buffer three times and then immersed in blocking buffer (1% BSA in PBS buffer) for 2 hr. Then, cells were immersed in the 2 mL of diluted Raman tags solution at 4°C and 50 rpm. After 12 hr, the sample was rinsed with PBS buffer four times, dehydrated by ethanol gradient and then observed by SEM.
For labeling living cells labeling, after the cell attachment to ITO-quartz substrates, the original cultured medium was replaced by 2 mL blocking buffer. After 4 hr incubation, the buffer was removed and 2 mL of the diluted Raman tag solutions was added for labeling. After 1 hr incubation, the fixing and dehydration procedures described above were performed on the sample for the SEM observation.
2.5 Optical characterization
The Raman images and spectra were acquired by a custom Raman microscope modified from Olympus BX51. The excitation source is a HeNe laser at 632.8 nm and three objectives were used: 10x (Olympus MPLFLN 10xBDP, NA = 0.25), 50x (Olympus LMPLFLN 50xBD, NA = 0.5) and 100x (Olympus MPLFLN 100xBDP, NA = 0.9). The diameters of laser spot from 10x, 50x and 100x objectives are 260 um, 50 um and 25 um respectively with laser power ~10 mW. The elastic scattered light was eliminated by the longpass filter (BLP01-633R-25, Semrock) and remaining Stokes Raman signals or background autofluorescence were captured by the spectrometer (SR303i, Andor) equipped with a 1200/mm grating and a CCD (iXon 888, Andor). The imaging chip was working at −60°C for the suppression of the noise and the EM gain is disable.
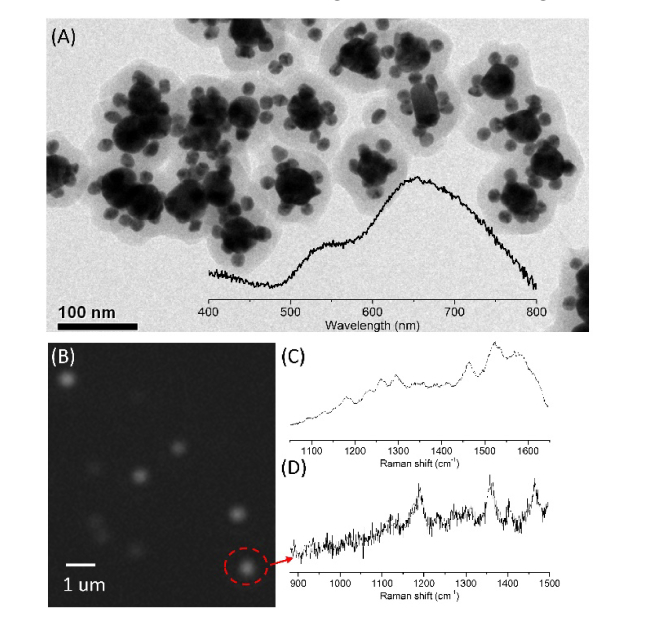
The 100x objective was used for characterization of Raman tags in Fig. 1 Raman tags were deposited on a quartz substrate which barely has background fluorescence under 632.8 nm excitation. Therefore, the spectrum of single Raman tags or small clusters of Raman tags can be obtained in Fig. 1(C)(D). The entrance slit of the spectrometer is 200 um.
Fig. 1.
(A) TEM image of the Raman tags. (Inset) Extinction spectrum of the plasmonic core-satellite assemblies (B) Raman image of tags on ITO-coated quartz substrates. Raman spectrum of intrinsic (C) and Cy5-embedded (D) Raman tags. The spectrum in (D) is taken from the spot encircled by the red dashed line in (B).
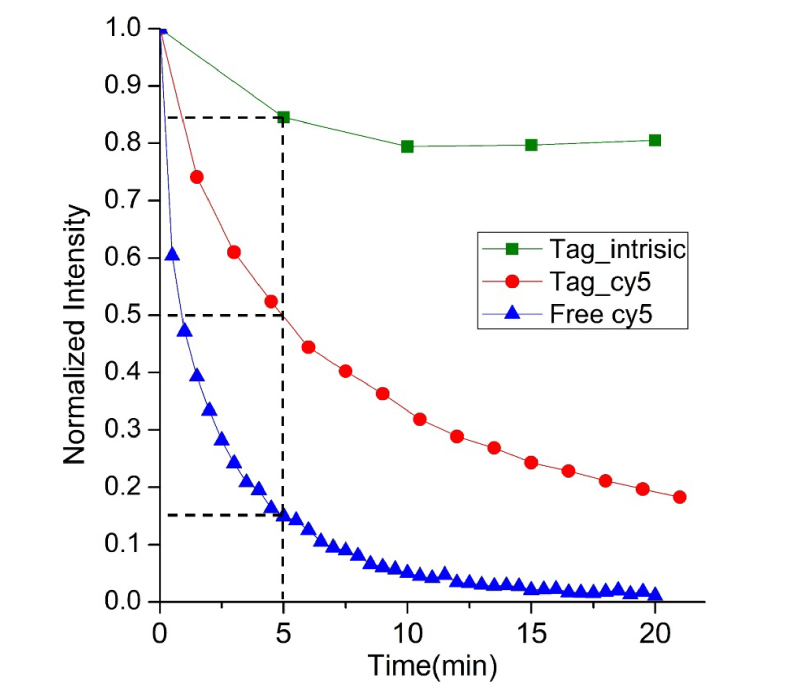
The 10x objective was used for acquiring broadband images or spectra of the whole cells labeled by Raman tags. The broadband Raman and autofluorescence images such as Fig. 5 were utilized to calculate intensity contrast between GBM and normal cells. The Raman image stability shown in Fig. 7 was evaluated by monitoring certain peaks of the Raman spectrum obtained from the whole single cells. The spectra of three different samples were utilized: the cells labeled with intrinsic Raman tags (monitored at 1587 cm−1, integration time = 60 s, slit = 1000 um), the cells labeled with Cy5-embedded Raman tags (monitored at 1190 cm−1 integration time = 0.3 s, slit = 1000 um), and free Cy5 molecules (monitored at 666 nm, integration time = 0.25 s, slit = 200 um).
Fig. 5.
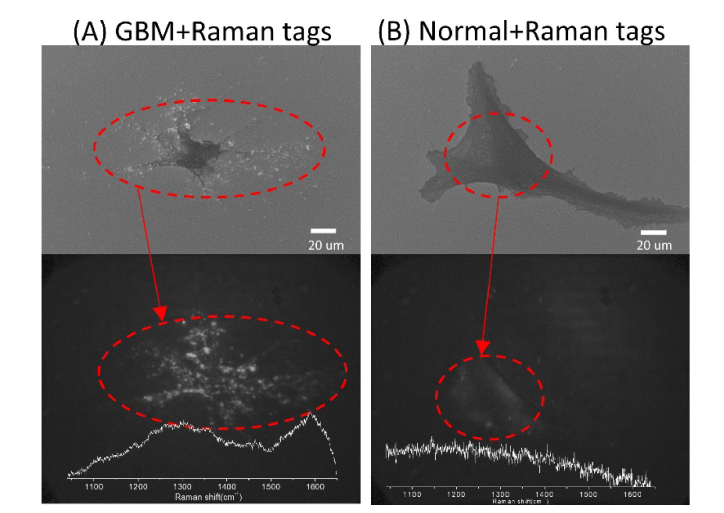
(A) SEM image, broadband Raman image, and corresponding spectrum of a GBM cell labeled by intrinsic Raman tags. Please note that the resolution of the spectrum is degraded (compared to Fig. 1(C)) due to the increased size of the slit at the entrance of the spectrometer for collecting the whole cell’s signals in one acquisition. However, the main spectral features around 1300 cm−1 and 1587 cm−1 can still be recognized. (B) SEM image, broadband autofluorescence image, and corresponding spectrum of a normal cell labeled by intrinsic Raman tags.
Fig. 7.
Raman intensity of GBM cells labeled with intrinsic Raman tags (green) and Cy5 embedded Raman tag (red) and fluorescence intensity of free Cy5 (blue) within the 20 min laser illumination.
The 50x objective was used for the point-scanning single band Raman image in Fig. 6. The output laser power was reduced from 10 mW to 0.5 mW. Therefore, the incident intensity is lower than images or spectra collected by the 10x objective. The size of the whole image is 350 um*350 um constructed by 7 um scanning step. The slit size is 1000 um. The major peak at 1190 cm−1 was extracted to reconstruct the single band Raman image.
Fig. 6.
(A) Bright field image, (B) single band Raman (1190 cm−1) image, and (C) overlay image of GBM cells labeled by Cy5-embedded Raman tags.
3. Results and discussion
3.1 Properties of the Raman tags
Raman tag design described in our recent report [26] provides an efficient way to produce a variety of robust and brilliant Raman tags. In Fig. 1(A), the TEM image shows that a Raman tag consists of a gold core-satellite assembly (CSA) and a silica shell. The linker molecules and Raman reporters are embedded within the gaps between core and satellite particles. The electromagnetic SERS enhancement within the gaps is on the order of 109. Therefore, either linker molecules (citrate ion, PAH) or Raman reporters (e.g. Cy5) generate traceable Raman signals. The 20 nm silica shell provides the protection for the CSA and also the surface for the antibody functionalization. In the inset of Fig. 1(A), the extinction spectrum of Raman tag suspension shows that the resonance wavelength of the CSA plasmonic backbone of Raman tags is ~650 nm, which is compatible with the excitation laser (632.8 nm). The Raman images of Raman tags deposited on an ITO-coated quartz wafer is shown in Fig. 1(B). Each bright spot contains emission from several Raman bands associated with molecules within the gaps of the tags. In Fig. 1(C)(D), two Raman spectra are obtained from two kinds of Raman tags respectively. In Fig. 1(C) the spectrum is from the “intrinsic” Raman tags containing linker molecules (citrate ion, PAH) only while the spectrum in Fig. 1(D) is from Raman tags that have additional Raman reporters, Cy5 molecules, which contribute different and stronger Raman peaks.
3.2 Functionalization of Raman tags
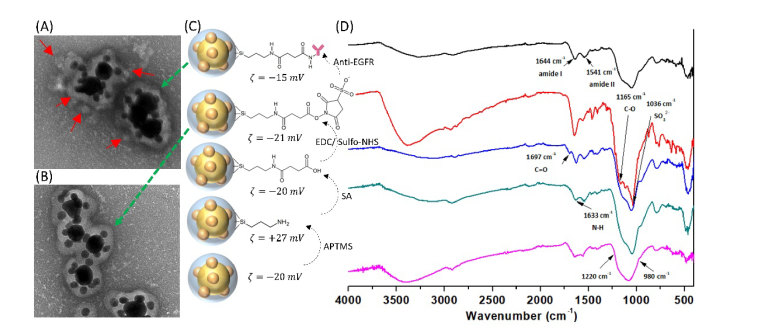
Overexpression of EGFR (epidermal growth factor receptor) is the distinguishing feature of various kinds of tumors, including GBM [27, 28]. Therefore, functionalized Raman tags with the anti-EGFR antibody can be numerously attached to the GBM tumor cells. Multiple surface modifications are necessary to link silica surface of the Raman tags and anti-EGFR. Although there are several chemical routes to achieve this linkage [29], only a few of them can be directly applied to the colloidal system. The chemical modification of the nanoparticle surface may easily cause random aggregates during the process due to the abrupt change of the surface charge and/or exchange of the solvent. Therefore, the zeta potential of the colloids is monitored after each functionalization step.
The antibody functionalized Raman tags are shown in Fig. 2(A). Compared to the tags without antibodies in Fig. 2(B), there are obvious antibodies around the surface of the silica shells. The chemical structure of the surface after each functionalization step and the corresponding zeta-potential are shown in Fig. 2(C). Although the absolute value of a zeta-potential of around 20 mV is not high enough for the long term storage of the colloids, this stability is enough for the time scale of the modification process and cell labeling. The detailed steps are described in the Methods section. The FTIR is used to ensure the effectiveness of each modification step, Fig. 2(D). The dip between 980 cm−1 and 1220 cm−1 is from the silica. The vibration modes within this region result from the Si-O-Si and Si-O-H bond structures [30]. Therefore, this broad dip can be observed from all five spectra. The 1633 cm−1 is from the N-H bond of the APTMS, which is used for both the anchor layer and the surface functionalization of the amino bond. After the SA modification, the C = O bond at 1697 cm−1 is observed. The vibrations from C-O bond of the ester group and from SO32- group are observed after modification of the sulfo-NHS [31]. Finally, the dip at 1644 cm−1 from amide I and 1541 cm−1 from amide II are contributed by the antibodies. The hydrodynamic sizes of Raman tags before and after antibody conjugation are 200 nm and 230 nm respectively. The difference between these two sizes may indicate the adsorption the anti-EGFR. However, these two sizes are much larger than the size measured before any surface modification (~160 nm) and also larger than the physical size presented by TEM. Therefore, slight particle aggregation probably occurs during multiple surface modification.
Fig. 2.
TEM images (negative staining) of Raman tags coated with (A) and without (B) anti-EGFR. Some of the anti-EGFR are highlighted by the red arrows. (C) Surface chemical structures, zeta potential and (D) the corresponding FTIR spectra of the intrinsic Raman tags after each functionalization step.
3.3 Specific binding between Raman tags and GBM cells
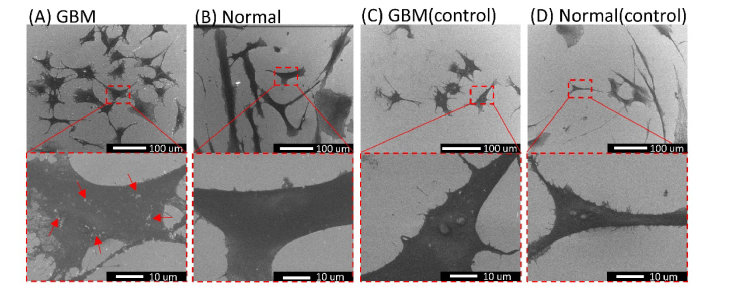
The considerable amount of functionalized Raman tags are supposed to specifically bind with GBM cells whose membranes have substantially more EGFR than normal cells. To verify this, the GBM cells (CNS-1) and normal cells (human astrocytes, HA) are separately incubated in the solution containing Raman tags coated with anti-EGFR. For the controls, the Raman tags without anti-EGFR coating (Fig. 2(B)) are used instead. The quantity of Raman tags adsorbed on the cells is directly observed by the SEM images. As shown in Fig. 3(A)(B), the GBM cells adsorb a substantial amount of functionalized Raman tags while only few tags are attached to the cell membranes of the normal HA cells. For the controls, adsorption of the Raman tags without anti-EGFR to either GBM or normal cells is not observed in Fig. 3(C)(D). Therefore, the specific binding between anti-EGFR functionalized Raman tags and GBM cells is verified in the fixed cells system.
Fig. 3.
SEM images of the fixed GBM (A) and normal (B) cells after being incubated with Raman tags coated with anti-EGFR. (C) and (D) are the controls using Raman tags without anti-EGFR, respectively. The zoom-in images are shown in the second row. Some of the Raman tags are highlighted by red arrows.
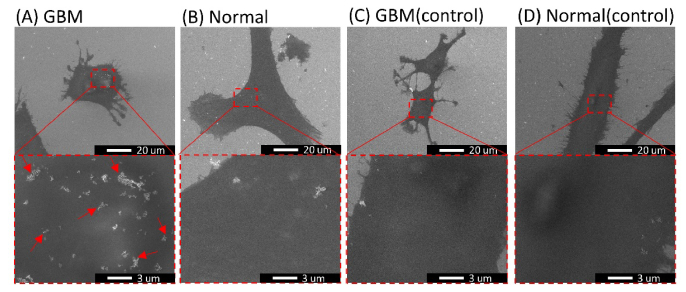
In addition to the fixed cells, the verification of the Raman tags specifically bound with the living GBM cells can make this Raman tag based method more practical. In Fig. 4(A)(B), same with the fixed cell system, it is clear that the living GBM cells adsorb substantial amount of the Raman tags coated with anti-EGFR than normal cells. For the controls in Fig. 4(C)(D), the Raman tags without anti-EGFR are not attached to either GBM or normal cells. This differentiation indicates that this Raman tags based method may be further applied to the practical surgery.
Fig. 4.
SEM images of the living GBM (A) and normal (B) cells after being incubated with Raman tags coated with anti-EGFR. (C) and (D) are the respectively controls using Raman tags without anti-EGFR. The zoom-in images are shown in the second row. Some of the Raman tags are highlighted by red arrows.
3.4 Imaging of labeled cells and the tumor-normal ratio (TNR)
The considerable amount of antibodies functionalized Raman tags are attached to the GBM cells, compared to the normal cells. We further investigate that if the difference in the quantity of the adsorbed Raman tags can be directly observed through the contrast of the broadband Raman images which can be applied to the image guided surgery. As shown in Fig. 5(A), the GBM cell labeled with abundant Raman tags in the SEM image has the corresponding optical image containing bright dots emitted by the Raman tags. However, for the normal cell in Fig. 5(B), there are barely any Raman tags adsorbed on the cells in the SEM image. In the corresponding optical image, only weak autofluorescence is observed.
In order to quantitatively evaluate the imaging intensity contrast between the labeled GBM and normal cells, the GBM cells in broadband Raman images and normal cells in the autofluorescence images are delineated first by the clear outlines obtained from the corresponding bright-field images. Then, the intensity within the cell outlines are integrated, divided by area of the cells and then subtracted by the average background intensity in order to obtain the average Raman intensity, IGBM, or average autofluorescence intensity, Inormal. Under the same excitation conditions, for the cell labeling with intrinsic Raman tags, the tumor-normal ratio (TNR), IGBM/Inormal is ~5 while for using Cy5 embedded Raman tags, the TNR is ~15. In addition, the image collection time for cells labeled with intrinsic Raman tags and Cy5 embedded Raman tags is 10 s and 0.1 s, respectively. These results indicate that the Raman imaging based on these robust and brilliant tags has potential for real-time imaging.
In addition to the broadband Raman and autofluorescence images used for TNR calculation, the point-scanning single band Raman image from the cells labeled by Cy5-embedded Raman tags is also demonstrated in Fig. 6. The overlay image clearly shows that the Raman tags can effectively indicate the location of the GBM cells.
3.5 Stability of the Raman imaging
In order to apply Raman tag based imaging to further clinical systems, the image stability of the labeled cells is investigated. Our previous report [26] shows that the intrinsic Raman tags or Raman tags embedded with non-fluorescent reporters are more stable than the tags containing fluorescent reporters. For the cells labeled with Raman tags, the image intensity acquired from the whole cells shows a similar trend in Fig. 7. After the first five-minute illumination, the relative intensities drops by 15%, 50% and 85% for the images of the cell with intrinsic Raman tags, cell with Cy5-embedded Raman tags and free Cy5 respectively. For the following 15 min, the intensity of the cell with intrinsic Raman tags is steadily kept at 80%. We suspect that the initial 15% drop results from the background fluorescence which is bleached in the first five min. For the cell with Cy5 embedded tags, the intensity keeps decreasing to 20% over 20 min. For the free Cy5 molecules, the relative intensity is below 5% after 10 min of excitation. This results show that both types of Raman tag provide better stability than fluorophores.
4. Conclusion
In this report, GBM cells are labeled by functionalized Raman tags to increase imaging contrast to the normal cells. The properties of Raman tags and detailed functionalization steps are described. A substantial amount of functionalized Raman tags selectively bind with the fixed and living GBM cells rather than normal cells and is clearly verified by SEM and Raman images. Through Raman images, the average Raman intensity from GBM cells is 5x to 15x higher than the background autofluorescence from normal cells, which means that long-pass filtered images can clearly distinguish between tumor cells and normal cells. The stability of the Raman image shows that both intrinsic and fluorophore-embedded Raman tags may be better candidates than fluorophores as imaging agents. The work demonstrated here is at the individual cell level, and it can be further improved and extended to the tissue level to magnify the imaging contrast between GBM tissue and normal tissue, especially at the tumor boundaries. For the potential clinical application, the solution containing our Raman tags can be used to coat the inner surface of the cavity created by the primary GBM resection. The residual GBM cells exist on that surface may be imaged and distinguishable from normal cells.
Our antibody functionalization process for Raman tags can be generally applied to other silica coated colloids. In addition, the specific binding between functionalized Raman tags and living/fixed GBM cells indicates that the Raman tag labeling cannot only be used for intraoperative imaging but also ex vivo tissue staining. Furthermore, Raman imaging based on these robust tags can be used solely or easily integrated into conventional fluorescence imaging system to improve the effectiveness of the image guided surgery for resection of GBM or other tumors whose boundaries are also not clearly defined. Finally, the short integration time enable this Raman imaging to approach real-time imaging.
Acknowledgments
S.-Y. Chen would like to thank Prof. Chien-Chung Jeng and Prof. Chao-Yu Chen for the equipment supports and Ying-An Chen for the initial trials.
Funding
Ministry of Science and Technology, Taiwan, R.O.C. (MOST 106-2221-E-006-171/ MOST 103-2320-B-006-017); Ministry of Education, Taiwan, R.O.C., under the program “The Aim for the Top University Project” in the National Cheng Kung University (NCKU).
Disclosures
The authors declare that there are no conflicts of interest related to this article.
References and links
- 1.McGirt M. J., Chaichana K. L., Gathinji M., Attenello F. J., Than K., Olivi A., Weingart J. D., Brem H., Quiñones-Hinojosa A. R., “Independent association of extent of resection with survival in patients with malignant brain astrocytoma,” J. Neurosurg. 110(1), 156–162 (2009). 10.3171/2008.4.17536 [DOI] [PubMed] [Google Scholar]
- 2.Chaichana K. L., Jusue-Torres I., Navarro-Ramirez R., Raza S. M., Pascual-Gallego M., Ibrahim A., Hernandez-Hermann M., Gomez L., Ye X., Weingart J. D., Olivi A., Blakeley J., Gallia G. L., Lim M., Brem H., Quinones-Hinojosa A., “Establishing percent resection and residual volume thresholds affecting survival and recurrence for patients with newly diagnosed intracranial glioblastoma,” Neuro-oncol. 16(1), 113–122 (2014). 10.1093/neuonc/not137 [DOI] [PMC free article] [PubMed] [Google Scholar]
- 3.Uckermann O., Galli R., Tamosaityte S., Leipnitz E., Geiger K. D., Schackert G., Koch E., Steiner G., Kirsch M., “Label-Free Delineation of Brain Tumors by Coherent Anti-Stokes Raman Scattering Microscopy in an Orthotopic Mouse Model and Human Glioblastoma,” PLoS One 9(9), e107115 (2014). 10.1371/journal.pone.0107115 [DOI] [PMC free article] [PubMed] [Google Scholar]
- 4.Peng Q., Berg K., Moan J., Kongshaug M., Nesland J. M., “5-aminolevulinic acid-based photodynamic therapy: Principles and experimental research,” Photochem. Photobiol. 65(2), 235–251 (1997). 10.1111/j.1751-1097.1997.tb08549.x [DOI] [PubMed] [Google Scholar]
- 5.Uehlinger P., Zellweger M., Wagnières G., Juillerat-Jeanneret L., van den Bergh H., Lange N., “5-Aminolevulinic acid and its derivatives: physical chemical properties and protoporphyrin IX formation in cultured cells,” J. Photochem. Photobiol. B 54(1), 72–80 (2000). 10.1016/S1011-1344(99)00159-1 [DOI] [PubMed] [Google Scholar]
- 6.Krieg R. C., Messmann H., Rauch J., Seeger S., Knuechel R., “Metabolic characterization of tumor cell-specific protoporphyrin IX accumulation after exposure to 5-aminolevulinic acid in human colonic cells,” Photochem. Photobiol. 76(5), 518–525 (2002). [DOI] [PubMed] [Google Scholar]
- 7.Ishizuka M., Abe F., Sano Y., Takahashi K., Inoue K., Nakajima M., Kohda T., Komatsu N., Ogura S., Tanaka T., “Novel development of 5-aminolevurinic acid (ALA) in cancer diagnoses and therapy,” Int. Immunopharmacol. 11(3), 358–365 (2011). 10.1016/j.intimp.2010.11.029 [DOI] [PubMed] [Google Scholar]
- 8.Koizumi N., Harada Y., Minamikawa T., Tanaka H., Otsuji E., Takamatsu T., “Recent advances in photodynamic diagnosis of gastric cancer using 5-aminolevulinic acid,” World J. Gastroenterol. 22(3), 1289–1296 (2016). 10.3748/wjg.v22.i3.1289 [DOI] [PMC free article] [PubMed] [Google Scholar]
- 9.Kim S., Kim J. E., Kim Y. H., Hwang T., Kim S. K., Xu W. J., Shin J. Y., Kim J. I., Choi H., Kim H. C., Cho H. R., Choi A., Chowdhury T., Seo Y., Dho Y. S., Kim J. W., Kim D. G., Park S. H., Kim H., Choi S. H., Park S., Lee S. H., Park C. K., “Glutaminase 2 expression is associated with regional heterogeneity of 5-aminolevulinic acid fluorescence in glioblastoma,” Sci. Rep. 7(1), 12221 (2017). 10.1038/s41598-017-12557-3 [DOI] [PMC free article] [PubMed] [Google Scholar]
- 10.Stummer W., Stocker S., Wagner S., Stepp H., Fritsch C., Goetz C., Goetz A. E., Kiefmann R., Reulen H. J., “Intraoperative detection of malignant gliomas by 5-aminolevulinic acid-induced porphyrin fluorescence,” Neurosurgery 42(3), 518–525, discussion 525–526 (1998). 10.1097/00006123-199803000-00017 [DOI] [PubMed] [Google Scholar]
- 11.Stummer W., Pichlmeier U., Meinel T., Wiestler O. D., Zanella F., Reulen H. J., ALA-Glioma Study Group , “Fluorescence-guided surgery with 5-aminolevulinic acid for resection of malignant glioma: a randomised controlled multicentre phase III trial,” Lancet Oncol. 7(5), 392–401 (2006). 10.1016/S1470-2045(06)70665-9 [DOI] [PubMed] [Google Scholar]
- 12.Ross J. L., Cooper L. A. D., Kong J., Gutman D., Williams M., Tucker-Burden C., McCrary M. R., Bouras A., Kaluzova M., Dunn W. D., Jr, Duong D., Hadjipanayis C. G., Brat D. J., “5-Aminolevulinic Acid Guided Sampling of Glioblastoma Microenvironments Identifies Pro-Survival Signaling at Infiltrative Margins,” Sci. Rep. 7(1), 15593 (2017). 10.1038/s41598-017-15849-w [DOI] [PMC free article] [PubMed] [Google Scholar]
- 13.Garzon-Muvdi T., Kut C., Li X., Chaichana K. L., “Intraoperative imaging techniques for glioma surgery,” Future Oncol. 13(19), 1731–1745 (2017). 10.2217/fon-2017-0092 [DOI] [PMC free article] [PubMed] [Google Scholar]
- 14.Ni D., Zhang J., Bu W., Xing H., Han F., Xiao Q., Yao Z., Chen F., He Q., Liu J., Zhang S., Fan W., Zhou L., Peng W., Shi J., “Dual-Targeting Upconversion Nanoprobes across the Blood-Brain Barrier for Magnetic Resonance/Fluorescence Imaging of Intracranial Glioblastoma,” ACS Nano 8(2), 1231–1242 (2014). 10.1021/nn406197c [DOI] [PubMed] [Google Scholar]
- 15.Gao X., Yue Q., Liu Z., Ke M., Zhou X., Li S., Zhang J., Zhang R., Chen L., Mao Y., Li C., “Guiding Brain-Tumor Surgery via Blood-Brain-Barrier-Permeable Gold Nanoprobes with Acid-Triggered MRI/SERRS Signals,” Adv. Mater. 29(21), 1603917 (2017). 10.1002/adma.201603917 [DOI] [PubMed] [Google Scholar]
- 16.Jermyn M., Mok K., Mercier J., Desroches J., Pichette J., Saint-Arnaud K., Bernstein L., Guiot M. C., Petrecca K., Leblond F., “Intraoperative brain cancer detection with Raman spectroscopy in humans,” Sci. Transl. Med. 7(274), 274ra19 (2015). 10.1126/scitranslmed.aaa2384 [DOI] [PubMed] [Google Scholar]
- 17.Ji M., Lewis S., Camelo-Piragua S., Ramkissoon S. H., Snuderl M., Venneti S., Fisher-Hubbard A., Garrard M., Fu D., Wang A. C., Heth J. A., Maher C. O., Sanai N., Johnson T. D., Freudiger C. W., Sagher O., Xie X. S., Orringer D. A., “Detection of human brain tumor infiltration with quantitative stimulated Raman scattering microscopy,” Sci. Transl. Med. 7(309), 309ra163 (2015). 10.1126/scitranslmed.aab0195 [DOI] [PMC free article] [PubMed] [Google Scholar]
- 18.Indrasekara A. S., Paladini B. J., Naczynski D. J., Starovoytov V., Moghe P. V., Fabris L., “Dimeric Gold Nanoparticle Assemblies as Tags for SERS-Based Cancer Detection,” Adv. Healthc. Mater. 2(10), 1370–1376 (2013). 10.1002/adhm.201200370 [DOI] [PubMed] [Google Scholar]
- 19.Kircher M. F., de la Zerda A., Jokerst J. V., Zavaleta C. L., Kempen P. J., Mittra E., Pitter K., Huang R., Campos C., Habte F., Sinclair R., Brennan C. W., Mellinghoff I. K., Holland E. C., Gambhir S. S., “A brain tumor molecular imaging strategy using a new triple-modality MRI-photoacoustic-Raman nanoparticle,” Nat. Med. 18(5), 829–834 (2012). 10.1038/nm.2721 [DOI] [PMC free article] [PubMed] [Google Scholar]
- 20.Karabeber H., Huang R., Iacono P., Samii J. M., Pitter K., Holland E. C., Kircher M. F., “Guiding Brain Tumor Resection Using Surface-Enhanced Raman Scattering Nanoparticles and a Hand-Held Raman Scanner,” ACS Nano 8(10), 9755–9766 (2014). 10.1021/nn503948b [DOI] [PMC free article] [PubMed] [Google Scholar]
- 21.Huang R., Harmsen S., Samii J. M., Karabeber H., Pitter K. L., Holland E. C., Kircher M. F., “High precision imaging of microscopic spread of Glioblastoma with a targeted ultrasensitive SERRS molecular imaging probe,” Theranostics 6(8), 1075–1084 (2016). 10.7150/thno.13842 [DOI] [PMC free article] [PubMed] [Google Scholar]
- 22.Vanna R., Ronchi P., Lenferink A. T., Tresoldi C., Morasso C., Mehn D., Bedoni M., Picciolini S., Terstappen L. W., Ciceri F., Otto C., Gramatica F., “Label-free imaging and identification of typical cells of acute myeloid leukaemia and myelodysplastic syndrome by Raman microspectroscopy,” Analyst (Lond.) 140(4), 1054–1064 (2015). 10.1039/C4AN02127D [DOI] [PubMed] [Google Scholar]
- 23.Lin D., Qiu S., Huang W., Pan J., Xu Z., Chen R., Feng S., Chen G., Li Y., Short M., Zhao J., Fawzy Y., Zeng H., “Autofluorescence and white light imaging-guided endoscopic Raman and diffuse reflectance spectroscopy for in vivo nasopharyngeal cancer detection,” J. Biophotonics e201700251 (2018), doi:. 10.1002/jbio.201700251 [DOI] [PubMed]
- 24.Sun L., Sung K. B., Dentinger C., Lutz B., Nguyen L., Zhang J., Qin H., Yamakawa M., Cao M., Lu Y., Chmura A. J., Zhu J., Su X., Berlin A. A., Chan S., Knudsen B., “Composite organic-inorganic nanoparticles as Raman labels for tissue analysis,” Nano Lett. 7(2), 351–356 (2007). 10.1021/nl062453t [DOI] [PubMed] [Google Scholar]
- 25.Kneipp J., Kneipp H., Wittig B., Kneipp K., “Novel optical nanosensors for probing and imaging live cells,” Nanomedicine (Lond.) 6(2), 214–226 (2010). 10.1016/j.nano.2009.07.009 [DOI] [PubMed] [Google Scholar]
- 26.Chang Y. C., Huang L. C., Chuang S. Y., Sun W. L., Lin T. H., Chen S. Y., “Polyelectrolyte induced controlled assemblies for the backbone of robust and brilliant Raman tags,” Opt. Express 25(20), 24767–24779 (2017). 10.1364/OE.25.024767 [DOI] [PubMed] [Google Scholar]
- 27.Watanabe K., Tachibana O., Sata K., Yonekawa Y., Kleihues P., Ohgaki H., “Overexpression of the EGF receptor and p53 mutations are mutually exclusive in the evolution of primary and secondary glioblastomas,” Brain Pathol. 6(3), 217 (1996). 10.1111/j.1750-3639.1996.tb00848.x [DOI] [PubMed] [Google Scholar]
- 28.Snuderl M., Fazlollahi L., Le L. P., Nitta M., Zhelyazkova B. H., Davidson C. J., Akhavanfard S., Cahill D. P., Aldape K. D., Betensky R. A., Louis D. N., Iafrate A. J., “Mosaic Amplification of Multiple Receptor Tyrosine Kinase Genes in Glioblastoma,” Cancer Cell 20(6), 810–817 (2011). 10.1016/j.ccr.2011.11.005 [DOI] [PubMed] [Google Scholar]
- 29.Hermanson G. T., (Acad. Press, 2013) [Google Scholar]
- 30.Zhan S., Yang Y., Shen Z., Shan J., Li Y., Yang S., Zhu D., “Efficient removal of pathogenic bacteria and viruses by multifunctional amine-modified magnetic nanoparticles,” J. Hazard. Mater. 274, 115–123 (2014). 10.1016/j.jhazmat.2014.03.067 [DOI] [PubMed] [Google Scholar]
- 31.Ding W. D., Cai J., Yu Z. Y., Wang Q. H., Xu Z. N., Wang Z. N., Gao C. J., “Fabrication of an aquaporin-based forward osmosis membrane through covalent bonding of a lipid bilayer to a microporous support,” J. Mater. Chem. A Mater. Energy Sustain. 3(40), 20118–20126 (2015). 10.1039/C5TA05751E [DOI] [Google Scholar]


