Abstract
A novel image processing algorithm based on a modified Bayesian residual transform (MBRT) was developed for the enhancement of morphological and vascular features in optical coherence tomography (OCT) and OCT angiography (OCTA) images. The MBRT algorithm decomposes the original OCT image into multiple residual images, where each image presents information at a unique scale. Scale selective residual adaptation is used subsequently to enhance morphological features of interest, such as blood vessels and tissue layers, and to suppress irrelevant image features such as noise and motion artefacts. The performance of the proposed MBRT algorithm was tested on a series of cross-sectional and enface OCT and OCTA images of retina and brain tissue that were acquired in-vivo. Results show that the MBRT reduces speckle noise and motion-related imaging artefacts locally, thus improving significantly the contrast and visibility of morphological features in the OCT and OCTA images.
OCIS codes: (100.0100) Image processing, (110.4500) Optical coherence tomography
1. Introduction
Optical Coherence Tomography (OCT) is a non-invasive, high-resolution medical imaging modality that can resolve morphological features in biological tissue as small as individual cells, at imaging depths in the order of 1mm below the tissue surface [1]. Over the past 25 years, OCT has found numerous clinical applications in ophthalmology, cardiology, dermatology, etc. [2]. An extension of OCT, named OCT angiography (OCTA), is able to image non-invasively the vasculature of biological tissue by removing the imaging data corresponding to static tissue and emphasizing the regions that exhibit tissue motion [3]. OCTA has demonstrated great potential for characterization of vascular-related ocular diseases such as glaucoma [4], age-related macular degeneration [5], and diabetic retinopathy [2]. Quantitative analysis of OCT and OCTA images, such as segmentation and thickness measurement of tissue layers, pattern analysis to identify regions of tissue where the morphology has been affected by a pathology from regions of healthy tissue, segmentation and sizing of blood and lymph vasculature, etc., has a significant clinical value as it can assist physicians with the diagnosis and treatment of various diseases. However, morphological features of interest in OCT and OCTA are masked or compromised by speckle noise, motion artefacts and shadow artefacts generated by superficial blood vessels over deeper tissue layers due to scattering and absorption of light by the blood cells.
Numerous methods have been proposed to enhance the image quality in OCT images. System modifications, including adaptive OCT with [6]/without [7,8] a close loop wavefront sensor, OCT with a moving diffuser to modulate speckle noise [9], and OCT with motion tracker to reduce motion artefact [10] could improve morphological or vascular visualization of OCT images. However, such improvements require additional instrumentation or more complex design of the imaging systems and are difficult to implement in commercial clinical instruments. Exogenous agents such as gold nanorods [11] and intralipid [12–14] could dynamically increase the contrast of vascular; however, contrast agent injection has risks like infection and allergic reaction. Many computational approaches are also widely explored. Speckle noise reduction algorithms, such as Gaussian filter, linear least-square estimation [15], Bayesian estimation [16,17], conditional random field [18], adaptive median filtering [19], anisotropic diffusion [20], wavelet filter [21,22], curvelet filter [23], maximum a posterior estimation [24], compressive sensing [25,26], principle component analysis [27] and artificial neural network [28] deal mostly with the properties of the noise in images and therefore lack the ability to enhance the contrast of specific tissue structures in the image of various shapes and sizes. Numerical adaptive optics approaches, such as deconvolution [29,30], digital refocusing [31], sub-aperture estimation [32] and solving inverse scattering problem [33], estimate and compensate the image aberrations, therefore can enhance the visualization of features of interest. These approaches require good phase stability of the system and dense scanning pattern, so their transition to the clinic use systems is difficult and filed of view is limited in in-vivo imaging.
The Frangi filter [34] approach is widely applied to enhance vessel-like shapes in 2D and 3D OCT images by using second derivative information of the images. However, its performance is strongly dependent on the presence of morphological features of different sizes (scales) in the same image. For example, the effectiveness of a Frangi filter designed for one scale can be affected by presence of morphological features of other scales. Moreover, the Frangi filter is very susceptible to noise contamination, especially at smaller scales (for example, capillaries in the human retina that have cross-sections of ~10 µm to 20 µm). Furthermore, the Frangi filter typically generates images artefacts that resemble small vessels in the OCT and OCTA images, which can compromise the quantitative analysis of blood vessel networks in OCT and OCTA images. Gabor filter is also used to enhance OCTA images; however, this method may artificially increase the size of the vessel [35], and similar to Frangi filter, different kernel sizes can interfere with each other as lacking of prior knowledge.
Multi-scale decomposition has gained high popularity in the recent years in physiological signal processing. Wavelet decomposition [36] uses wavelet transform to decompose the physiological signal into different scales, where the noise component is usually in the finest scale and can be isolated during signal reconstruction. One limitation of this approach is that the decomposition procedure is based on deterministic functions, therefore, basis-related artefacts could be associated with different wavelet function selections. Alexander et al. [37] proposed a new approach from Bayesian perspective to decompose the physiological signal into different unique scales, and its implementation on noisy electrocardiographical (ECG) signal showed significant noise reduction while preserving the useful signal features. This method, called Bayesian residual transform (BRT), has the advantage of isolating residual information at each scale from other scales, and each scale is calculated based on its own statistical characteristics.
Here we present, for the first time, enhancement of morphological and vascular features in OCT and OCTA images based on a modified version of the BRT approach (MBRT). Similar to ECG signal in 1D, in the MBRT approach, the 2D OCT original images are decomposed into several residual images at different scales. Afterwards, different weights are assigned to the residual images by a scale-selective residual adaption. Morphological and vascular features of interest are emphasized by empirically assigning larger weights to them, and the final enhanced image is assembled by summing up all the weighted residual images. In this manuscript, we describe the MBRT approach in detail and present enhanced images that were acquired in-vivo from human and rats with different customized OCT systems and a commercial system, and therefore with different spatial resolutions, image acquisition rates and noise levels. The vascular images from customized systems were also processed with a Frangi filter and Gabor filter, and compared with the MBRT enhanced versions.
2. Methods
2.1 Bayesian residual transform
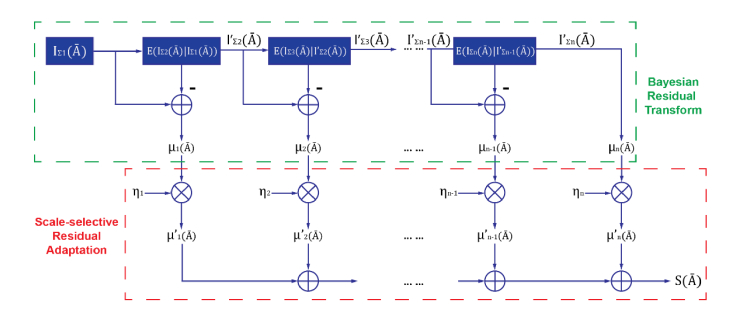
The full derivation of one dimensional Bayesian residual transform has been presented previously [37], and a modified version (MBRT), based on two dimensional images, is presented graphically in Fig. 1.
Fig. 1.
Illustration of structure enhancement using modified Bayesian Residual Transform
An OCT or OCTA image contains structures with different scales, from finest scale such as speckle noise, to coarsest scale, such as major blood vessels and retinal layers with relative uniform scattering potentials. Therefore, let denote coordinate (x,y) in a image, and can be decomposed to a series of residual images (), with incremental scale, each of which represents information at a specific scale:
| (1) |
where denotes the summation of residual images with scales ranged from k to N (k≤N). Therefore, the equation can be also modified to:
| (2) |
Computing µ1 can be considered as solving an inversing problem:
| (3) |
In general, residual image with kth scale information can be expressed as:
| (4) |
which can be solved by a non-parametric Nadaraya-Watson kernel regression approach [38,39], and by using a Gaussian kernel with a scale , the inversing problem can be computed as following:
| (5) |
| (6) |
Now an image is decomposed into several residual images at different scales, and since each residual image is independent to other residual images, and the original image can be reconstructed by simply summing up all residual images, i.e. inverse BRT. Structural enhancement was achieved by scale-selective residual adaptation: scale coefficient was applied to the corresponding residual image in order to enhance/suppress the structural information at the unique scale of the image:
| (7) |
and the structure enhanced image is computed as the sum of scaled residual images:
| (8) |
This non-iterative image decomposition using BRT method was using MALTAB with digital imaging processing package, with Nadaraya-Watson kernel regression (Eq. (6) written in C + + and called by MATLAB Executable, working on an Intel Core i7-4930K Processor PC with 16 GB RAM.
The proposed structure enhancement was compared with the most used structure enhancement algorithms (Frangi filter and Gabor filter) on the OCTA images acquired from customized OCT systems. The algorithm was also applied on MATLAB, and the Frangi filter kernel sizes were set to match the sizes of the vascular in the retina (2 × 2 to 6 × 6 pixels) and brain (3 × 3 to 15 × 15 pixels). Gabor filter used Gaussian kernels with 9 equally spaced orientations [0-2π], 0.1 spatial frequency, and kernel sizes 6 × 6 to 60 × 60 pixels for rat retinal vascular images and 6 × 6 to 100 × 100 pixels for rat brain images. The Gabor filter local optimization scheme followed the method proposed by Hendargo et al. [35].
In order to provide quantitative comparison of the proposed MBRT method with Frangi and Gabor filters, two indices were introduced: dice similarity coefficient (DSC) [40] and vascular connectivity. The ground-truth vascular plexus was manually segmented, and then compared with binarized images processed by all three methods. The binarization thresholds were then automatically decided using Otsu’s method [41]. The DSC was defined as:
| (9) |
where TP, FP, and FN are the true positive, the false positive, and the false negative pixels. The vascular connectivity was calculated similarly to the approach proposed by Jia et al. [42]: the binarized images were skeletonized, and the vascular connectivity was defined as the ratio of the connected pixel numbers to the total pixel numbers in the skeletonized images.
2.2 OCT and OCTA images
The performance of the proposed MBRT method was first applied to a test image composed of Newton’s rings of different sizes. Then the method was applied to a series of OCT and OCTA images acquired in-vivo from the rat retina and brain, as well as, from the human cornea and retina. The rat retina and brain imaging studies were approved by the University of Waterloo Animal Research Ethics Committee and adhered to the ARVO statement for use of animals in ophthalmic and vision research. The rat retina and brain images were acquired with a SD-OCT system that operates in the 1060 nm spectral region and provides ~3.5 µm axial and ~5 µm lateral resolution in retinal tissue with ~100 dB SNR for 1.7 mW optical power of the imaging beam [43,44]. Cross-sectional retinal OCT images with distinctive retinal layers were acquired to examine the algorithm’s behavior on images with layered structure. OCT images were acquired from the rat retina at the ONH and its vicinity (3.4 mm × 3.4 mm; 512 A-scans × 512 positions × 4 scans/position) OCTA images were generated from this data by a maximum projection in depth. In a similar way, OCTA images were acquired from the tumorous rat brain (5 mm x 5 mm; 1000 A-scans × 1000 positions × 5 scans/position). The brain tumor was induced by injection of human brain tumor cells through a small craniotomy 18 days before imaging.
The human cornea imaging study was approved by the Research Ethics Committee at the University of Waterloo and adhered to the tents of the declaration of Helsinki. The human corneal OCT images were acquired with a fiberoptic, SD-OCT operating in the 800 nm spectral range, that provided ~0.95 µm axial and ~4 µm lateral resolution in corneal tissue at 34,000 A-scan/s image acquisition rate [45]. Cross-sectional images (1000 Ascan × 4096 pixel/Ascan) were acquired in-vivo from the corneas of healthy human subjects. The human retina vascular images were acquired with a commercial swept-source OCT (SS-OCT) system (PLEX Elite 9000, Zeiss, Germany). The scanning area on the macula is 3 mm × 3 mm and 6 mm × 6 mm. The human retinal images processed by MBRT were not compared with other filters as the extracted images from the commercial system were already processed by the built-in, proprietary algorithm(s).
3. Results and discussions
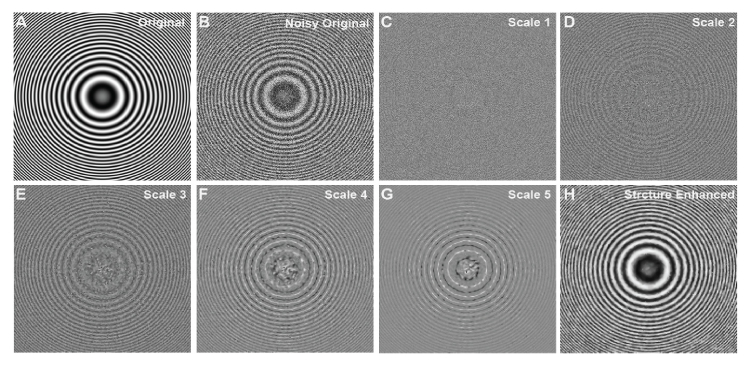
To evaluate the proposed algorithm on a 2D image with multiple scales, a Newtown’s rings phantom image containing multiple concentric rings of graded scales was created (Fig. 2(A)). A zero-mean Gaussian noise (variance: 0.7) was added on the original image (Fig. 2(B)). The noisy image was decomposed to 5 different scales from finest to coarsest (Fig. 2(C)-(G)) and then reconstructed using BRT algorithm. It is easy to observe that the concentric ring structures were well described from scale 2 to 5, where the scale contains mostly the background noise. The final structure enhanced image (Fig. 1(H)) emphasized the scales from scale 2 to 5, and the visibility of the concentric rings were largely improved from the noisy image.
Fig. 2.
Example of BRT based multi-scale image decomposition and reconstruction on a Newton’s ring phantom image. (A) Original phantom Image. (B) Noise contaminated phantom image with zero-mean Gaussian noise. (C-G) BRT-based image decompositions into different scales, from the finest scale to the coarsest scale. (H) Structure enhanced image with the visibility of graded rings largely improved.
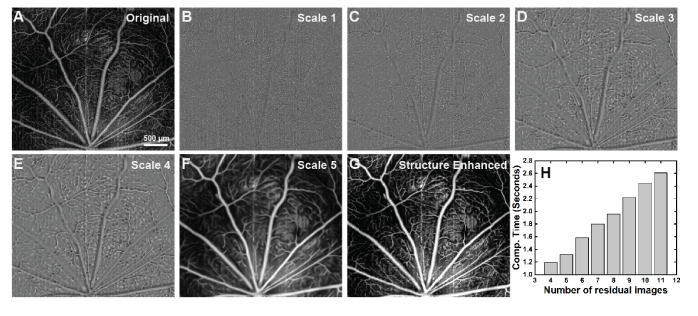
Next, an example of the proposed method based on modified BRT were implemented on the OCTA images of rat’s retina (Fig. 3). Max projection over certain depth in retinal tissue (0-35 µm) was utilized to generate en-face OCTA images on the rat’s retinal GCL + NFL layer. This layer contains first-order retinal arterioles and venues (size ~30-50 µm) and their branching capillaries with variable sizes (5-30 µm). The original image (Fig. 3(A)) was decomposed into 5 different residual images with even scale interval (Fig. 3(B)-(G)), where structures of large arterioles and venues were extracted from scale 4-5, and structure of small capillaries were extracted from scale 2-4. Scale one contains mostly the statistical noise information, mixed with only a little capillary structure information. Therefore, when the final image is computed, the weights are set to [0,1,1,3,1] from scale 1-5, respectively. The contrasts of the original and reconstructed images were adjusted so that the total image values are equal. Processing time on this OCTA image with size 1000 × 1000 pixels is plotted in Fig. 2(H) as a function of decomposed residual image numbers. Linear increase from 1.2 seconds to 2.6 seconds is expected with decomposed image numbers from 4 to 11.
Fig. 3.
Example of BRT based multi-scale image decomposition and reconstruction on rat’s OCTA image from retinal GCL + NFL layer. (A) Original Image. (B-F) BRT-based image decompositions into different scales, from the finest scale to the coarsest scale. Structural characteristics at different scales are well extracted. (G) Structure enhanced image using scale selective residual adaption. (H) Computational (Comp.) time for image decomposition and reconstruction as a function of decomposed residual image numbers. Range from 1.2 s to 2.6 s with 4-11 decomposed residual images.
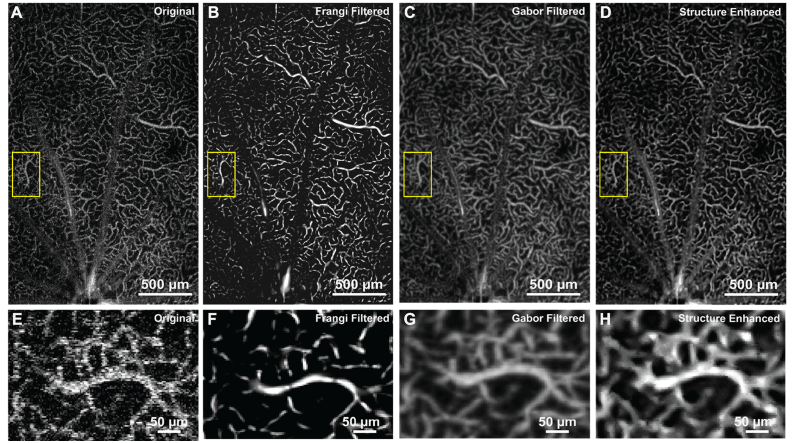
Figure 4 shows qualitative comparison of the original and processed maximum projection OCTA images from the OPL, using both Frangi and Gabor filters as well as the MBRT to enhance the retinal vasculature. This OPL has the highest capillary density among three inner retinal vascular layers (GCL + NFL, IPL and OPL) and the diameter of the capillaries is relatively uniform, therefore, it is a good sample to evaluate the performance of the MBRT algorithm on enhancing image features of approximately the same size. The original image and the images processed with the Frangi and Gabor filters and the MBRT are shown in Fig. 4(A)-(D) respectively. Regions of interest in those images marked with the yellow rectangles are magnified for quantitative comparison in Fig. 4(E)-(H). In the original image, although the general vascular distribution can still be visualized, the useful vascular structure has low CNR, contaminated by speckle noise and the shadow artefacts. Frangi filter can pick-up the vesselness of the vascular image and enhance its contrast, however, from magnified view (Fig. 4(F)), it is easy to observe that the algorithm is underestimating the boundary of the vessel, and continuity of the vessels are not preserved. Both vessel diameter bias and discontinuity associated with the Frangi filter will jeopardize further vessel quantification, e.g. diameter measurement and perfusion density calculation. The Gabor filter preserves and enhances the vascular features by maximizing the vascular orientation. However, as seen in the magnified view (Fig. 4(G)), its performance on the looped and bifurcated structure is relatively poor, as the local optimization is applied to a single direction. In Fig. 4(H), it is easy to observe that the background noise is well suppressed, while the sharpness of the vascular boundary is preserved. Again, in the processed image, the non-blood perfusion area is much clear and the capillaries were well preserved and even enhanced.
Fig. 4.
Application to OCTA image on rat’s retinal OPL layer. (A-D) Original image and BRT-based image reconstruction. The view of interested is labelled in yellow rectangles and magnified to (E-H).
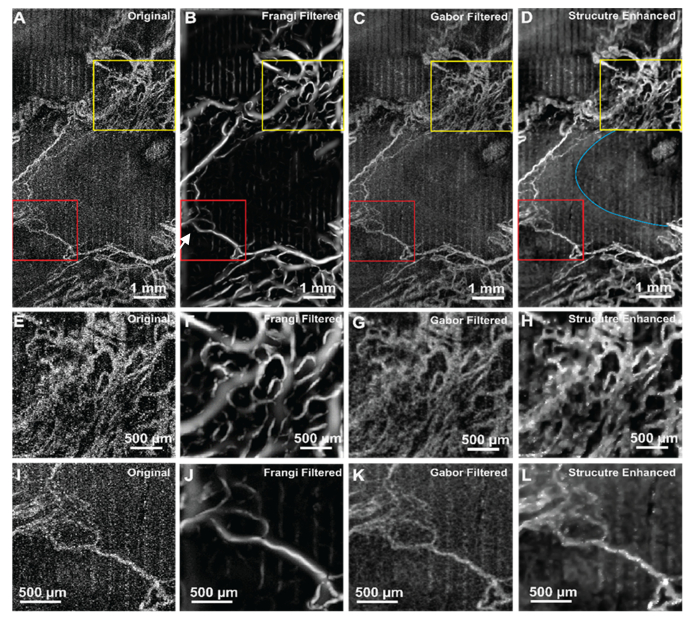
Figure 5 shows the performance of a Frangi filter, Gabor filter and the MBRT for enhancing the visibility of the tumorous vascular structure in the rat brain. Figure 5(A)-(D) illustrated the noisy original, Frangi filtered, Gabor filtered and proposed structure enhanced images, respectively. Figure 5(E)-(H) and Fig. 5(I)-(L) are the magnified view of the yellow and red colored rectangles. The growth of vascular around the tumor is irregular, which can be represented as vascular with large variation in size and abnormal orientations in the image [46]. The avascular area at the center of the images (white arrow) is the region of a cyst, where the scattering potential is different from the surrounding tissue. In the originate image (Fig. 5(A)), the vascular structure is not pronounced and contaminated by both speckle noise and motion artefact, displayed as vertical stripes in the max projected image. Frangi filtered image overestimates and underestimates the vascular structure. Specifically, with complex perfusion distribution (Fig. 5(E)), the Frangi filter artificially generated some vascular structure that are not present the original image. The Gabor filter generally enhanced the visualization and continuity of the vasculature. However, the noise level is more pronounced and therefore obscures the small blood vessels. Moreover, as both filter iterations do not take into consideration the a priori knowledge, the small scale structures are interfering with the large scale structures. MBRT enhanced morphological images (Fig. 5(D), (H), (L)) shown improved visibility and the continuity of the vasculature. The vessels’ boundaries are clear, which enables more precise measurement of the vessels size and density. The boundary of the cyst is sharper, allowing unambiguous segmentation of the cyst area (blue curved line). Overall, the proposed MBRT algorithm could be helpful in studies investigating brain tumor growth by offering a more precise evaluation of the morphological and vascular changes in brain tissue associated with the tumor.
Fig. 5.
Application of the MBRT to OCTA image of rat tumorous brain. (A-D) Original image, Frangi filtered, Gabor filtered and proposed structure enhanced images. The view of interested is labelled in yellow and red rectangles and magnified to (E-H) and (I-L) respectively. Blue curved line labels the boundary of a cyst region.
Table 1 shows the DSC and vascular connectivity of images processed by all three algorithms (N = 9). MBRT method has on average 28% and 4% improvement of DSC compared to the Frangi and Gabor filters. Manal segmented images have almost perfect vascular connectivity (0.99 ± 0.01). MBRT preserves best the vascular connectivity among all three methods, and is on average 21% and 2% more efficient in vascular connectivity compared to the by Frangi and Gabor filters, respectively. Moreover, the computational times of Frangi and Gabor filters are on average ~1.1x and ~3.5x longer than of the MBRT.
Table 1. DSC and vascular connectivity of three methods and manual segmentation (N = 9).
| Manual Segmentation | Frangi Filter | Gabor Filter | MBRT | |
|---|---|---|---|---|
| DSC | N/A | 0.67 ± 0.09 | 0.83 ± 0.11 | 0.86 ± 0.10 |
| Vascular Connectivity | 0.99 ± 0.01 | 0.78 ± 0.11 | 0.93 ± 0.03 | 0.95 ± 0.03 |
| Computational Time (seconds) | N/A | ~2.8 | ~8.8 | ~2.5 |
Data are presented as Mean ± Standard Deviation.
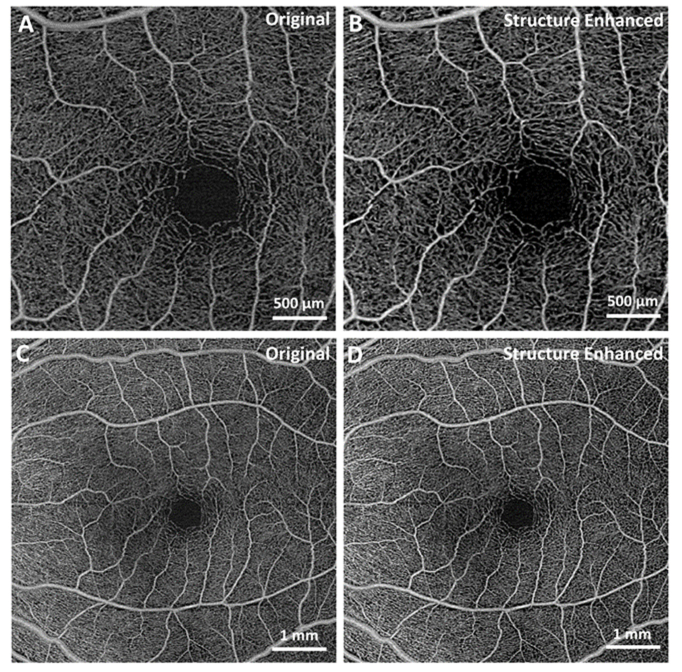
Next, the MBRT algorithm was applied to retinal images acquired from a healthy subject with a commercial SS-OCT system. Figure 6(A), (C) are the extracted images of human macula area with sizes 3mm × 3mm and 6mm × 6mm, and structure enhanced images are shown in Fig. 6(B), (D). It is easy to observe that the central avascular area boundary gets sharper while the structure of the vascular is well preserved. Enhanced contrast of major blood vessels will make further analysis, e.g. vascular segmentation and skeletonization, easier and unambiguous.
Fig. 6.
Enhancement of the vasculature in OCT images of the human retina using MBRT, acquired with a commercial SS-OCT system. (A,C) Extracted original images of healthy human macula with sizes 3mm × 3mm and 6mm × 6mm. (B,D) MBRT enhanced images. Note that the original OCT images were already pre-processed with built-in filters into the commercial SS-OCT system.
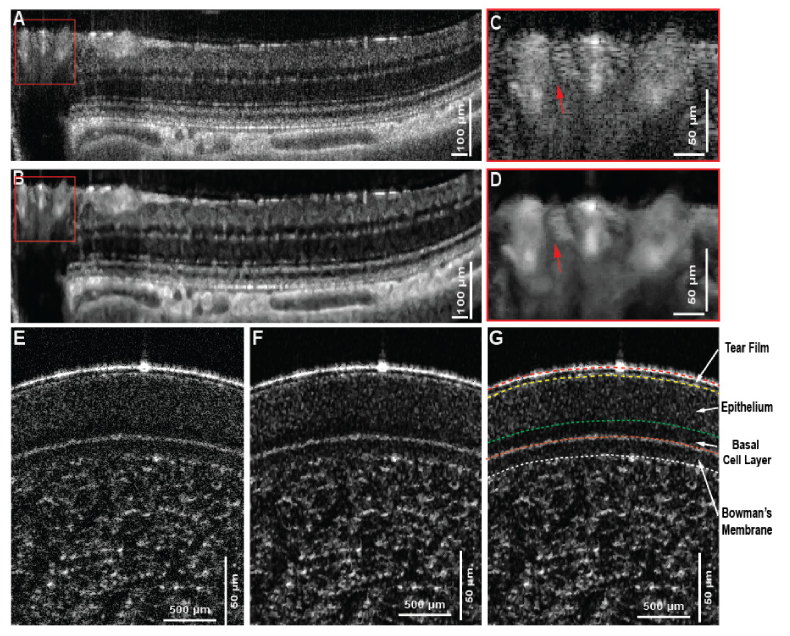
Finally, the feasibility of the proposed MBRT algorithm was tested on a series of cross-sectional morphological OCT images. Figure 7(A) shows a large view of the rat’s retina acquired near the ONH. Distinctive small features, including capillaries and external limiting membrane (ELM), and large features, like retinal blood vessels and choroidal vessels can be characterized in the original image. However, the layer segmentation algorithm would fail because of speckle noise and discontinuity of some thin retinal layers. Figure 7(B) shows the reconstructed image with much cleaner retinal layer and choroidal vessel boundary, and the magnified view of the retinal blood vessel area enables the unambiguous segmentation of a small blood vessel (red arrows in Fig. C and D).
Fig. 7.
Application to cross-sectional OCT images of rat’s retina and human cornea. (A-B) Original image and the reconstructed image using MBRT approach that represent the layered retinal structure near the ONH, shown as the yellow line in (C). The magnified view of the blood vessel region shows the unambiguous recognition of a blood vessel after image reconstruction using MBRT approach. (D-E) original and structure enhanced image using modified MBRT. Layered structure is improved so that the layer segmentation can be easily implemented afterward in (F). It’s note that the basal cell layer is much more prominent after the structure enhancement and can be confidently isolated from the rest of the epithelium layer.
Note that the image is processed in such way that the features with large scales are enhanced, therefore, the small features, such as the ELM are suppressed. The in-vivo human corneal image (Fig. 7(E)) was acquired with an OCT system that utilizes a supercontinuum laser, with a noise level significantly higher compared to the noise of the superluminence diode (SLD) light source used to acquire the images from the rat retina and brain (Fig. 7(A)-(D) and Fig. 5 respectively). Furthermore, the scales-associated noise varies along the depth, and as such, a careful selection of the MBRT coefficients is required to isolate the relevant morphological information from the variable unwanted scales. Figures 7(E)-(G) show the original and reconstructed image of the human cornea, respectively, while Fig. 7(G) shows the segmented cornea layers based on reconstructed image. It is clear that the proposed MBRT enhanced image improves the visibility of the different layers and thus allowing for easier and more precise manual segmentation, especially in the case of the basal cell layer where distinctive scattering pattern can be differentiated from the rest of the epithelium.
4. Conclusion
We have developed a modified residual Bayesian transform for image decomposition to multiple scales and enhancement of morphological and vascular features in the images, achieved by using a scale-selective residual adaption. Images acquired in-vivo from human subjects and test animals with a number of OCT systems with different spatial resolution and image acquisition rates, were used to test the general feasibility of the proposed algorithm on OCT and OCTA images. Comparison of the MBRT method with Frangi filter and Gabor filter showed superior performance of the MBRT in terms of preserving complex vascular and morphological features in the OCT images.
Acknowledgments
We would like to thank Nancy Gibson and Jean Flanagan from University of Waterloo for assistance with the animal handling. We also would like to thank Leopold Schmetterer from the Singapore Eye Research Institute (SERI) for providing the human retina images acquired with the commercial SS-OCT system.
Funding
Natural Sciences and Engineering Research Council of Canada (NSERC, grant # 312037 and # 03966), Canada Research Chair (grant # 229272) and University of Waterloo Research Incentive Fund.
Disclosures
The authors declare that there are no conflicts of interest related to this article.
References and links
- 1.Drexler W., Fujimoto J. G., (Springer Science & Business Media, 2008). [Google Scholar]
- 2.de Barros Garcia J. M. B., Isaac D. L. C., Avila M., “Diabetic retinopathy and OCT angiography: clinical findings and future perspectives,” Int. J. Retina Vitreous 3(1), 14 (2017). 10.1186/s40942-017-0062-2 [DOI] [PMC free article] [PubMed] [Google Scholar]
- 3.de Carlo T. E., Romano A., Waheed N. K., Duker J. S., “A review of optical coherence tomography angiography (OCTA),” Int. J. Retina Vitreous 1(1), 5 (2015). 10.1186/s40942-015-0005-8 [DOI] [PMC free article] [PubMed] [Google Scholar]
- 4.Scripsema N. K., Garcia P. M., Bavier R. D., Chui T. Y. P., Krawitz B. D., Mo S., Agemy S. A., Xu L., Lin Y. B., Panarelli J. F., Sidoti P. A., Tsai J. C., Rosen R. B., “Optical Coherence Tomography Angiography Analysis of Perfused Peripapillary Capillaries in Primary Open-Angle Glaucoma and Normal-Tension Glaucoma,” Invest. Ophthalmol. Vis. Sci. 57(9), OCT611 (2016). 10.1167/iovs.15-18945 [DOI] [PubMed] [Google Scholar]
- 5.Keane P. A., Patel P. J., Liakopoulos S., Heussen F. M., Sadda S. R., Tufail A., “Evaluation of Age-related Macular Degeneration With Optical Coherence Tomography,” Surv. Ophthalmol. 57(5), 389–414 (2012). 10.1016/j.survophthal.2012.01.006 [DOI] [PubMed] [Google Scholar]
- 6.Liu Z., Kurokawa K., Zhang F., Lee J. J., Miller D. T., “Imaging and quantifying ganglion cells and other transparent neurons in the living human retina,” Proc. Natl. Acad. Sci. U.S.A. 114(48), 12803–12808 (2017). 10.1073/pnas.1711734114 [DOI] [PMC free article] [PubMed] [Google Scholar]
- 7.Polans J., Cunefare D., Cole E., Keller B., Mettu P. S., Cousins S. W., Allingham M. J., Izatt J. A., Farsiu S., “Enhanced visualization of peripheral retinal vasculature with wavefront sensorless adaptive optics optical coherence tomography angiography in diabetic patients,” Opt. Lett. 42(1), 17–20 (2017). 10.1364/OL.42.000017 [DOI] [PMC free article] [PubMed] [Google Scholar]
- 8.Jian Y., Lee S., Ju M. J., Heisler M., Ding W., Zawadzki R. J., Bonora S., Sarunic M. V., “Lens-based wavefront sensorless adaptive optics swept source OCT,” Sci. Rep. 6(May), 27620 (2016). 10.1038/srep27620 [DOI] [PMC free article] [PubMed] [Google Scholar]
- 9.Liba O., Lew M. D., Sorelle E. D., Dutta R., Sen D., Moshfeghi D. M., Chu S., De La Zerda A., “Speckle-modulating optical coherence tomography in living mice and humans,” Nat. Commun. 8(May), 1–12 (2017). [DOI] [PMC free article] [PubMed] [Google Scholar]
- 10.Zhang Q., Huang Y., Zhang T., Kubach S., An L., Laron M., Sharma U., Wang R. K., “Wide-field imaging of retinal vasculature using optical coherence tomography-based microangiography provided by motion tracking,” J. Biomed. Opt. 20(6), 066008 (2015). 10.1117/1.JBO.20.6.066008 [DOI] [PMC free article] [PubMed] [Google Scholar]
- 11.Liba O., SoRelle E. D., Sen D., de la Zerda A., “Contrast-enhanced optical coherence tomography with picomolar sensitivity for functional in vivo imaging,” Sci. Rep. 6, 23337 (2016). 10.1038/srep23337 [DOI] [PMC free article] [PubMed] [Google Scholar]
- 12.Bernucci M. T., Merkle C. W., Srinivasan V. J., “Investigation of artifacts in retinal and choroidal OCT angiography with a contrast agent,” Biomed. Opt. Express 9(3), 1020–1040 (2018). 10.1364/BOE.9.001020 [DOI] [PMC free article] [PubMed] [Google Scholar]
- 13.Merkle C. W., Leahy C., Srinivasan V. J., “Dynamic contrast optical coherence tomography images transit time and quantifies microvascular plasma volume and flow in the retina and choriocapillaris,” Biomed. Opt. Express 7(10), 4289–4312 (2016). 10.1364/BOE.7.004289 [DOI] [PMC free article] [PubMed] [Google Scholar]
- 14.Pan Y., You J., Volkow N. D., Park K., Du C., “Ultrasensitive detection of 3D cerebral microvascular network dynamics in vivo,” Neuroimage 103, 492–501 (2014). 10.1016/j.neuroimage.2014.08.051 [DOI] [PMC free article] [PubMed] [Google Scholar]
- 15.Frost V. S., Stiles J. A., Shanmugan K. S., Holtzman J. C., “A Model for Radar Images and Its Application to Adaptive Digital Filtering of Multiplicative Noise,” IEEE Trans. Pattern Anal. Mach. Intell. 4(2), 157–166 (1982). 10.1109/TPAMI.1982.4767223 [DOI] [PubMed] [Google Scholar]
- 16.Wong A., Mishra A., Bizheva K., Clausi D. A., “General Bayesian estimation for speckle noise reduction in optical coherence tomography retinal imagery,” Opt. Express 18(8), 8338–8352 (2010). 10.1364/OE.18.008338 [DOI] [PubMed] [Google Scholar]
- 17.Cameron A., Lui D., Boroomand A., Glaister J., Wong A., Bizheva K., “Stochastic speckle noise compensation in optical coherence tomography using non-stationary spline-based speckle noise modelling,” Biomed. Opt. Express 4(9), 1769–1785 (2013). 10.1364/BOE.4.001769 [DOI] [PMC free article] [PubMed] [Google Scholar]
- 18.Boroomand A., Wong A., Li E., Cho D. S., Ni B., Bizheva K., “Multi-penalty conditional random field approach to super-resolved reconstruction of optical coherence tomography images,” Biomed. Opt. Express 4(10), 2032–2050 (2013). 10.1364/BOE.4.002032 [DOI] [PMC free article] [PubMed] [Google Scholar]
- 19.Hopfield J. J., Mcclelland J. L., “An Adaptive Weighted Median Filter for Speckle Suppression in Medical Ultrasonic Images,” IEEE Trans. Circ. Syst. 36(1), 129–135 (1989). 10.1109/31.16577 [DOI] [Google Scholar]
- 20.Yu Y., Acton S. T., Member S., “Speckle Reducing Anisotropic Diffusion,” IEEE Trans. Image Process. 11(11), 1260–1270 (2002). 10.1109/TIP.2002.804276 [DOI] [PubMed] [Google Scholar]
- 21.Adler D. C., Ko T. H., Fujimoto J. G., “Speckle reduction in optical coherence tomography images by use of a spatially adaptive wavelet filter,” Opt. Lett. 29(24), 2878–2880 (2004). 10.1364/OL.29.002878 [DOI] [PubMed] [Google Scholar]
- 22.Mayer M. A., Borsdorf A., Wagner M., Hornegger J., Mardin C. Y., Tornow R. P., “Wavelet denoising of multiframe optical coherence tomography data,” Biomed. Opt. Express 3(3), 572–589 (2012). 10.1364/BOE.3.000572 [DOI] [PMC free article] [PubMed] [Google Scholar]
- 23.Jian Z., Yu Z., Yu L., Rao B., Chen Z., Tromberg B. J., “Speckle attenuation in optical coherence tomography by curvelet shrinkage,” Opt. Lett. 34(10), 1516–1518 (2009). 10.1364/OL.34.001516 [DOI] [PMC free article] [PubMed] [Google Scholar]
- 24.Lopes A., Nezry E., Touzi R., Laur H., “Structure detection and statistical adaptive speckle filtering in SAR images,” Int. J. Remote Sens. 14(9), 1735–1758 (1993). 10.1080/01431169308953999 [DOI] [Google Scholar]
- 25.Xu D., Vaswani N., Huang Y., Kang J. U., “Modified compressive sensing optical coherence tomography with noise reduction,” Opt. Lett. 37(20), 4209–4211 (2012). 10.1364/OL.37.004209 [DOI] [PMC free article] [PubMed] [Google Scholar]
- 26.Fang L., Li S., Nie Q., Izatt J. A., Toth C. A., Farsiu S., “Sparsity based denoising of spectral domain optical coherence tomography images,” Biomed. Opt. Express 3(5), 927–942 (2012). 10.1364/BOE.3.000927 [DOI] [PMC free article] [PubMed] [Google Scholar]
- 27.Luan F., Wu Y., “Application of RPCA in optical coherence tomography for speckle noise reduction,” Laser Phys. Lett. 10(3), 035603 (2013). 10.1088/1612-2011/10/3/035603 [DOI] [Google Scholar]
- 28.Avanaki M. R. N., Laissue P. P., Eom T. J., Podoleanu A. G., Hojjatoleslami A., “Speckle reduction using an artificial neural network algorithm,” Appl. Opt. 52(21), 5050–5057 (2013). 10.1364/AO.52.005050 [DOI] [PubMed] [Google Scholar]
- 29.Yasuno Y., Sugisaka J., Sando Y., Nakamura Y., Makita S., Itoh M., Yatagai T., Huang D., Swanson E. A., Lin C. P., Schuman J. S., Stinson W. G., Chang W., Hee M. R., Flotte T., Gregory K., Puliafito C. A., Fujimoto J. G., Povazay B., Bizheva K., Unterhuber A., Hermann B., Sattmann H., Fercher A. F., Drexler W., Apolonski A., Wadsworth W. J., Knight J. C., St Russell P. J., Vetterlein M., Scherzer E., “Non-iterative numerical method for laterally superresolving Fourier domain optical coherence tomography,” Opt. Express 24(3), 1221–1223 (1999). [DOI] [PubMed] [Google Scholar]
- 30.Ralston T. S., Marks D. L., Kamalabadi F., Boppart S. A., “Deconvolution methods for mitigation of transverse blurring in optical coherence tomography,” IEEE Trans. Image Process. 14(9), 1254–1264 (2005). 10.1109/TIP.2005.852469 [DOI] [PubMed] [Google Scholar]
- 31.Liu G., Zhi Z., Wang R. K., “Digital focusing of OCT images based on scalar diffraction theory and information entropy,” Biomed. Opt. Express 3(11), 2774–2783 (2012). 10.1364/BOE.3.002774 [DOI] [PMC free article] [PubMed] [Google Scholar]
- 32.Kumar A., Drexler W., Leitgeb R. A., “Subaperture correlation based digital adaptive optics for full field optical coherence tomography,” Opt. Express 21(9), 10850–10866 (2013). 10.1364/OE.21.010850 [DOI] [PubMed] [Google Scholar]
- 33.Ralston T. S., Marks D. L., Boppart S. A., Carney P. S., “Inverse scattering for high-resolution interferometric microscopy,” Opt. Lett. 31(24), 3585–3587 (2006). 10.1364/OL.31.003585 [DOI] [PubMed] [Google Scholar]
- 34.Ro W. J. N. K. L. V. M. A. V., Frangi F., “Multiscale vessel enhancement filtering,” Med. Image Comput. Comput. Assist. Interv. 1496, 130–137 (1998). [Google Scholar]
- 35.Hendargo H. C., Estrada R., Chiu S. J., Tomasi C., Farsiu S., Izatt J. A., “Automated non-rigid registration and mosaicing for robust imaging of distinct retinal capillary beds using speckle variance optical coherence tomography,” Biomed. Opt. Express 4(6), 803–821 (2013). 10.1364/BOE.4.000803 [DOI] [PMC free article] [PubMed] [Google Scholar]
- 36.Mallat S. G., “A theory for multiresolution signal decomposition: the wavelet representation,” IEEE Trans. Pattern Anal. Mach. Intell. 11(7), 674–693 (1989). 10.1109/34.192463 [DOI] [Google Scholar]
- 37.Wong A., Wang X. Y. U., “A Bayesian Residual Transform for Signal Processing,” IEEE Access 3(1109), 709–717 (2015). 10.1109/ACCESS.2015.2437873 [DOI] [Google Scholar]
- 38.Nadaraya E. A., “On Estimating Regression,” Theory Probab. Appl. 9(1), 141–142 (1964). 10.1137/1109020 [DOI] [Google Scholar]
- 39.Watson G. S., “Smooth regression analysis,” Indian J. Stat. 26(4), 359–372 (1964). [Google Scholar]
- 40.Li A., You J., Du C., Pan Y., “Automated segmentation and quantification of OCT angiography for tracking angiogenesis progression,” Biomed. Opt. Express 8(12), 5604–5616 (2017). 10.1364/BOE.8.005604 [DOI] [PMC free article] [PubMed] [Google Scholar]
- 41.Otsu N., “A Threshold Selection Method from Gray-Level Histograms,” IEEE Trans. Syst. Man Cybern. 9(1), 62–66 (1979). 10.1109/TSMC.1979.4310076 [DOI] [Google Scholar]
- 42.Jia Y., Tan O., Tokayer J., Potsaid B., Wang Y., Liu J. J., Kraus M. F., Subhash H., Fujimoto J. G., Hornegger J., Huang D., “Split-spectrum amplitude-decorrelation angiography with optical coherence tomography,” Opt. Express 20(4), 4710–4725 (2012). 10.1364/OE.20.004710 [DOI] [PMC free article] [PubMed] [Google Scholar]
- 43.Tan B., Mason E., MacLellan B., Bizheva K. K., “Correlation of Visually Evoked Functional and Blood Flow Changes in the Rat Retina Measured With a Combined OCT+ERG System,” Invest. Ophthalmol. Vis. Sci. 58(3), 1673–1681 (2017). 10.1167/iovs.17-21543 [DOI] [PubMed] [Google Scholar]
- 44.Hariri S., Moayed A. A., Dracopoulos A., Hyun C., Boyd S., Bizheva K., “Limiting factors to the OCT axial resolution for in-vivo imaging of human and rodent retina in the 1060 nm wavelength range,” Opt. Express 17(26), 24304–24316 (2009). 10.1364/OE.17.024304 [DOI] [PubMed] [Google Scholar]
- 45.Bizheva K., Tan B., MacLelan B., Kralj O., Hajialamdari M., Hileeto D., Sorbara L., “Sub-micrometer axial resolution OCT for in-vivo imaging of the cellular structure of healthy and keratoconic human corneas,” Biomed. Opt. Express 8(2), 800–812 (2017). 10.1364/BOE.8.000800 [DOI] [PMC free article] [PubMed] [Google Scholar]
- 46.Vakoc B. J., Fukumura D., Jain R. K., Bouma B. E., “Cancer imaging by optical coherence tomography: preclinical progress and clinical potential,” Nat. Rev. Cancer 12(5), 363–368 (2012). 10.1038/nrc3235 [DOI] [PMC free article] [PubMed] [Google Scholar]


