

Abstract
Background
The CheckMate 141 trial found that nivolumab improved survival for patients with recurrent or metastatic head and neck cancer (HNC). Despite the improved survival, nivolumab is much more expensive than standard therapies. This study assesses the cost-effectiveness of nivolumab for the treatment of HNC.
Methods
We constructed a Markov model to simulate treatment with nivolumab or standard single-agent therapy for patients with recurrent or metastatic platinum-refractory HNC. Transition probabilities, including disease progression, survival, and probability of toxicity, were derived from clinical trial data, while costs (in 2017 US dollars) and health utilities were estimated from the literature. Incremental cost-effectiveness ratios (ICERs), expressed as dollar per quality-adjusted life-year (QALY), were calculated, with values of less than $100 000/QALY considered cost-effective from a health care payer perspective. We conducted one-way and probabilistic sensitivity analyses to assess model uncertainty.
Results
Our base case model found that treatment with nivolumab increased overall cost by $117 800 and improved effectiveness by 0.400 QALYs compared with standard therapy, leading to an ICER of $294 400/QALY. The model was most sensitive to the cost of nivolumab, though nivolumab only became cost-effective if the cost per cycle decreased from $13 432 to $3931. The model was not particularly sensitive to assumptions about survival. If one assumed that all patients alive at the end of the CheckMate 141 trial were cured of their disease, nivolumab was still not cost-effective (ICER $244 600/QALY).
Conclusion
While nivolumab improves overall survival, at its current cost it would not be considered a cost-effective treatment option for patients with HNC.
With a worldwide incidence of 550 000 cases and 380 000 deaths per year, squamous cell carcinoma of the head and neck (SCCHN) represents a major global cause of cancer-associated morbidity and death (1,2). While most patients present with locally contained or loco-regional disease, more than half of patients will suffer loco-regional disease progression or develop metastatic disease (3). Up until recently, the standard of care for patients with recurrent or metastatic platinum-resistant disease included single- or multi-agent systemic therapy; however, guidelines could not clearly endorse any one treatment strategy (4), and overall these regimens offer little chance for prolonged survival.
Cancer immunotherapy represents an exciting branch of cancer treatment, with numerous agents showing activity in a number of cancers. For head and neck cancer (HNC), the recently reported CheckMate 141 study found a survival advantage for patients with platinum-resistant recurrent or metastatic disease who received the antiprogrammed death 1 (PD-1) monoclonal antibody nivolumab (5). In this clinical trial, patients were randomized to receive nivolumab or conventional single-agent therapy (methotrexate, docetaxel, or cetuximab—given at the discretion of the treating physician). The trial found that nivolumab extended the median overall survival by 2.4 months and improved patient quality of life compared with patients treated with standard therapy.
Nivolumab is one therapy among the wave of new immunotherapies for cancer patients, and while these treatments hold great promise, they may place unprecedented financial burdens on patients and society (6,7). The literature defining the cost-effectiveness of this novel class of cancer treatments is limited (7,8), with no known reports in HNC. In a time when pharmaceutical prices are increasing exponentially (9–11), defining value of these promising therapies for patients and society is more important than ever. The question of value is particularly relevant from a global perspective given the high incidence of HNC among socioeconomically disadvantaged regions of the world (2). The purpose of this study was to perform a cost-effectiveness analysis of nivolumab compared with standard therapy for patients with recurrent or metastatic squamous cell carcinoma of the head and neck. Using this methodology, we aim to compare therapies while considering differences in survival, cost, and patient quality of life.
Methods
Decision Model
We compared the cost-effectiveness of nivolumab with single-agent therapy for patients with platinum-resistant recurrent or metastatic squamous cell carcinoma of the head and neck. We created a Markov model to simulate treatments, adverse events, quality of life, costs, and survival among simulated patients. The state transition diagram (Figure 1) shows how patients move through the Markov model. The three main health states were stable disease, cancer progression, and death. Our cost-effectiveness model used a one-month cycle length extending over a 30-year time horizon. The Markov models were constructed and analyzed with TreeAge Pro 2016 (TreeAge Software, Williamstown, MA). The design and reporting of this cost-effectiveness analysis follow standard guidelines published elsewhere (12).
Figure 1.
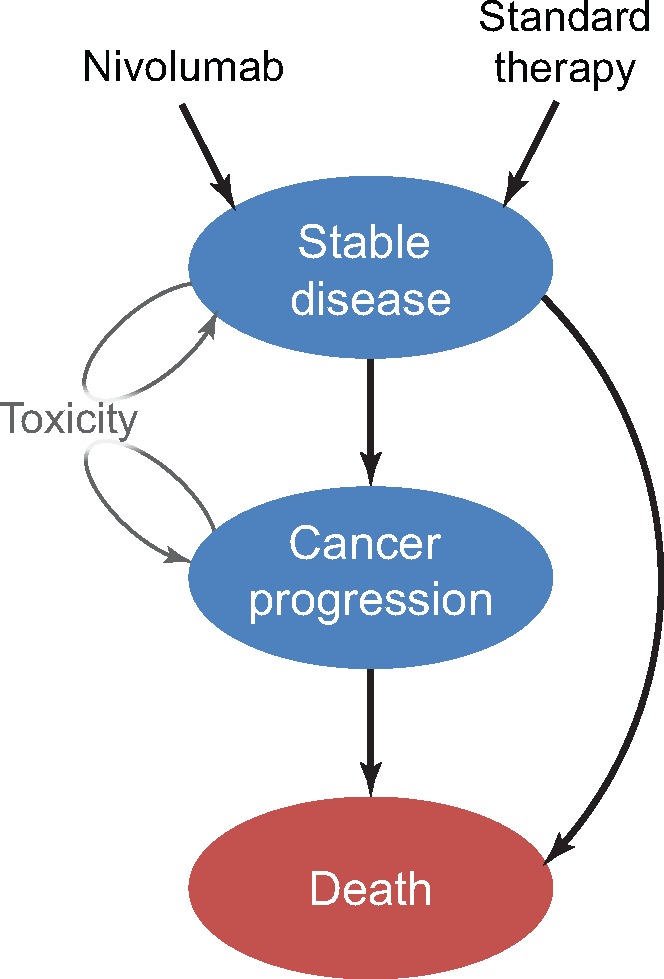
State transition diagram. The three main health states are represented by ovals and include “stable disease,” “cancer progression,” and “death.” Arrows represent possible transitions from one health state to the next. Patients may experience toxicity and remain in their same state after a decrement in utility and additional cost.
Treatment Details
We used the CheckMate 141 trial as a construct to model the different treatment groups. Patients in the standard therapy group received one of three drugs studied in the CheckMate trial, including methotrexate (40–60 mg/m2 weekly), docetaxel (30–40 mg/m2 weekly), or cetuximab (400 mg/m2 loading dose followed by 250 mg/m2 weekly). Patients received only one drug, and we assumed that the distribution of drugs matched that of the trial (41% on methotrexate, 47% on docetaxel, and 12% on cetuximab). Patients in the nivolumab group received treatment every two weeks at a dose of 3 mg/kg. The optimal length of nivolumab treatment among long-term responders is unknown; therefore, we evaluated different scenarios and assessed how these assumptions impacted the cost-effectiveness of this treatment. Our base case analysis followed the CheckMate 141 protocol, whereby patients received nivolumab until disease progression. We also tested scenarios where patients received nivolumab through disease progression, though we limited the duration to a maximum of one to two years. Patients in either treatment group who progressed were assumed to have exhausted treatment options and incurred the costs of supportive care. Patients who died incurred the cost of palliative care during the month before death.
Model Probabilities
We assumed that all patients entered the model and received either nivolumab or an alternative single-agent therapy. After initiating therapy, patients could experience a treatment-related adverse event, disease progression, or death. Probabilities of these events were derived directly from the CheckMate 141 trial. Regarding survival, the Checkmate trial reported survival through 15 months after initiation of treatment, and we estimated monthly probabilities of disease progression and death to generate model-predicted survival that mimicked the Kaplan-Meier curves provided in the study (Figure 2). Survival for responders to immunotherapy beyond the range reported in clinical trials remains unknown due to the limited clinical trial follow-up with newer immunotherapy agents. We hypothesized that our cost-effectiveness analyses could be sensitive to assumptions about long-term survival; therefore, we estimated long-term survival across a range of scenarios. In our base case survival scenario, we assumed that survival after 15 months would follow survival estimates of a generalized population with metastatic HNC. Monthly conditional survival probabilities after 15 months in this scenario were obtained from the Surveillance, Epidemiology, and End Results (SEER) database (13). An alternative and more optimistic survival scenario assumed that patients alive after 15 months were “cured” of HNC, and their risk of death went back to their normal age-adjusted mortality risk obtained from the US Social Security Death Index (14).
Figure 2.
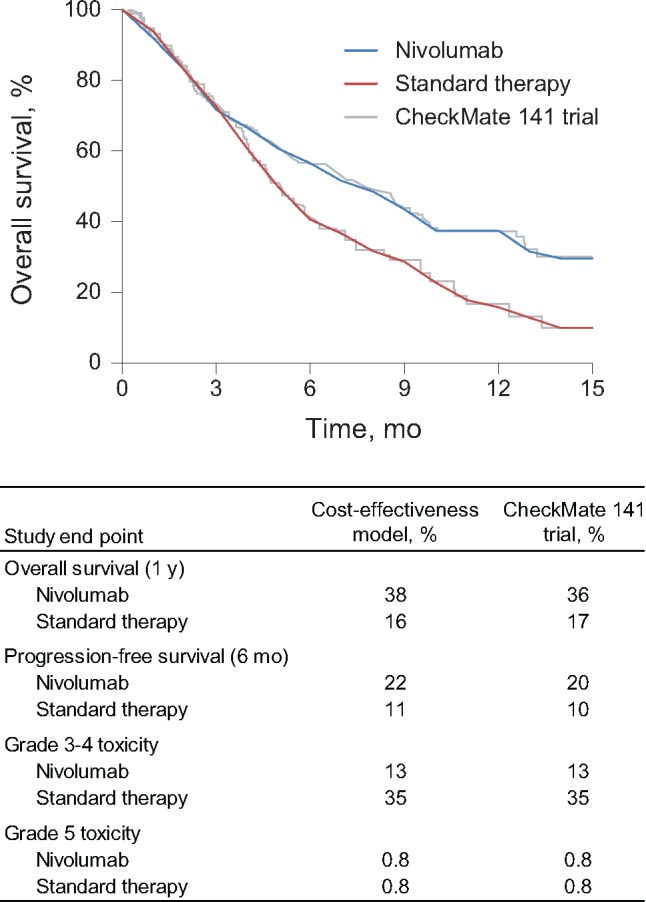
Model validation. This figure shows the cost-effectiveness model validation results. The top panel (plot) shows how our model (smooth curves) predicts survival compared with the CheckMate 141 trial (superimposed). The bottom panel (table) shows how our model predicts overall survival, progression-free survival, grade 3–4 toxicity, and grade 5 toxicity compared with the CheckMate 141 trial.
Costs
Our primary analysis measured cost-effectiveness from a third party payer perspective, though we assessed cost-effectiveness from a societal perspective in a sensitivity analysis (15). The cost of systemic agents was determined through the standard approach of using the average wholesale price (AWP) with a 7% reduction, while also incorporating the costs of drug administration (16–23). Drugs were administered weekly or biweekly in the Checkmate 141 trial. Our model cycle length was one month; therefore, we present the monthly cost of administering each drug as opposed to the cost per chemotherapy cycle. Costs for treatment-related toxicities were derived from the literature and taken as a weighted average of the most common treatment-related toxicities reported in the CheckMate 141 trial (24–27). Aside from treatment-related mortality, we only included the grade 3–4 treatment-related toxicities, and not grade 1–2 toxicities. A summary of parameters used to calculate toxicity costs and utilities are included in Supplementary Tables 1 and 2 (available online). All costs were adjusted to 2017 US dollars via the Consumer Price Index.
Outcome Measures
Effectiveness was measured in quality-adjusted life-years (QALYs), which reflects the product of a patient’s health utility over time. Health utility measures quality of life and ranges from 0 (death) to 1 (perfect health). Health utility scores were obtained from the literature (26,28–33), using prospectively acquired utility measurements whenever possible. All patients started with the same health utility score for stable recurrent HNC. Each patient’s utility decreased for progressive disease, and every time a patient experienced an adverse event, they incurred a health utility deduction. The different disease progression and toxicity rates between the nivolumab and standard therapy groups led to different health utility scores. Specific values of the health utilities and utility decrements, and the respective literature sources used in this study, are included in Table 1.
Table 1.
Parameters for cost-effectiveness model*
| Parameter | Value (95% CI) | Distribution | Citation |
|---|---|---|---|
| Costs in 2017 USD | |||
| Chemo/immunotherapy Infusion | 136 (87 to 199) | Gamma | Medicare |
| Drug costs (per cycle)†‡ | |||
| Nivolumab | 13 432 (9213 to 19 408) | Gamma | AWP (13–20) |
| Cetuximab§ | |||
| Month 1 | 14 653 (10 069 to 22 987) | Gamma | AWP (13–20) |
| Month 2 | 12 734 (8278 to 18 062) | Gamma | AWP (13–20) |
| Docetaxel | 4844 (3215 to 6859) | Gamma | AWP (13–20) |
| Methotrexate | 36.68 (23.57 to 52.54) | Gamma | AWP (13–20) |
| Drug toxicity costs‖ | |||
| Nivolumab | 1677 (1109 to 2460) | Gamma | |
| Standard therapy | 4947 (3251 to 7056) | Gamma | |
| Cancer progression per month | |||
| Year 1 | 4619 (3022 to 6642) | Gamma | Blumen et al., 2016 (55) |
| Year 2+ | 2555 (1677 to 3620) | Gamma | Blumen et al., 2016 (55) |
| Palliative care per month | 9836 (6643 to 14 299) | Gamma | Enomoto et al., 2015 (56) |
| Societal costs¶ | |||
| Caregiver | 522 (328 to 728) | Gamma | Li et al., 2013 (57) |
| Patient time | 1224 (829 to 1795) | Gamma | Hopkins et al., 2010 (58) |
| Parking/meals/travel | 315 (202 to 446) | Gamma | de Almeida et al., 2016 (59) |
| Health utilities | |||
| Stable disease per year | 0.517 (0.497 to 0.537) | Beta | van der Linden et al., 2015 (28) |
| Disease progression per year | 0.280 (0.260 to 0.300) | Beta | Retèl et al., 2011 (29) |
| Drug toxicity utility toll | |||
| Nivolumab | 0.0070 (0.00895 to 0.00514) | Beta | |
| Standard therapy | 0.0069 (0.009 to 0.00506) | Beta | |
| Death | 0 |
*All values are shown as per-month quantities. AWP = average wholesale price; CI = confidence interval; CPT = current procedural terminology; PFS = progression-free survival.
Infusion costs are applicable to nivolumab and docetaxel.
Drug costs are presented as 7% below the AWP.
The costs of cetuximab in the first month are higher due to a one-time loading dose.
The costs of toxicity for each arm are weighted based on the frequency of events derived from the CheckMate 141 trial using the costs derived from the literature for the individual toxicities included above (5). These costs include all care needed to treat each toxicity (including hospitalizations when necessary).
These costs are included in the societal perspective model only, which was run separately from the base case model run from the health care system perspective.
Statistical Analysis
We used a 3% annual discount rate for all costs and QALYs. The cost-effectiveness of nivolumab vs standard therapy was measured with an incremental cost-effectiveness ratio (ICER), which represents the incremental cost between the two treatment approaches divided by the incremental effectiveness (measured with QALY). Treatments were considered “cost-effective” if the ICER was under a willingness-to-pay threshold of $100 000/QALY. While this threshold varies by individual, region, health care system, and country, this particular value of $100 000/QALY was chosen because it is commonly used in cost-effectiveness research (34).
Our base case analysis used the best unbiased estimates of costs, health utilities, and transition probabilities to estimate the cost-effectiveness of nivolumab compared with alternative single-agent therapies. One-way deterministic sensitivity analyses were performed on each variable to identify factors that directly influenced cost-effectiveness. A probabilistic sensitivity analysis was also conducted to assess the impact of uncertainty in all transition probabilities, costs, and health utilities using a Monte Carlo simulation with 100 000 iterations. Cost estimates were modeled with gamma distributions, which are bound by the interval from 0 to infinity. All transition probabilities and health utilities were modeled with beta distributions, which are bound by the interval 0 to 1. Standard deviations for the probability of toxicity, progression, and death were obtained from the literature. The standard deviations of cost and health utilities were not ascertainable from the literature and were assumed to be 20% of the mean (35). We tested different values of our unknown standard deviations (range = 10%–40% of the mean), though this did not impact our results (data not shown).
Results
Base Case Analysis
Our base case cost-effectiveness analysis found that nivolumab increased the overall cost of treatment by $117 800, from $57 000 with standard therapy to $174 800 with nivolumab. Nivolumab increased effectiveness by 0.400 QALYs, from 0.396 on standard therapy to 0.796 on nivolumab. The ICER for nivolumab compared with standard therapy was $294 400/QALY, which would not be considered cost-effective at a threshold of $100 000/QALY. From a societal perspective, the cost-effectiveness analysis resulted in an even higher ICER for nivolumab at $373 000/QALY.
One-Way Sensitivity Analysis
In the one-way sensitivity analyses, our cost-effectiveness analysis was most sensitive to the cost of nivolumab. However, the monthly cost of nivolumab would need to decrease by 71%, or from $13 432 to $3931, before nivolumab would become cost-effective at a willingness to pay of $100 000/QALY (Figure 3). Among the standard therapy group, only 12% received cetuximab (the most expensive drug of the three drugs in the standard therapy group). If we assumed that 100% of the patients received cetuximab, the ICER decreased to $182 200/QALY. Our base case analysis assumed that patients took nivolumab until disease progression, though if nivolumab use was capped at 24 months, the ICER dropped to $182 100/QALY. When we capped nivolumab use at 12 months, the ICER decreased slightly to $161 300/QALY.
Figure 3.
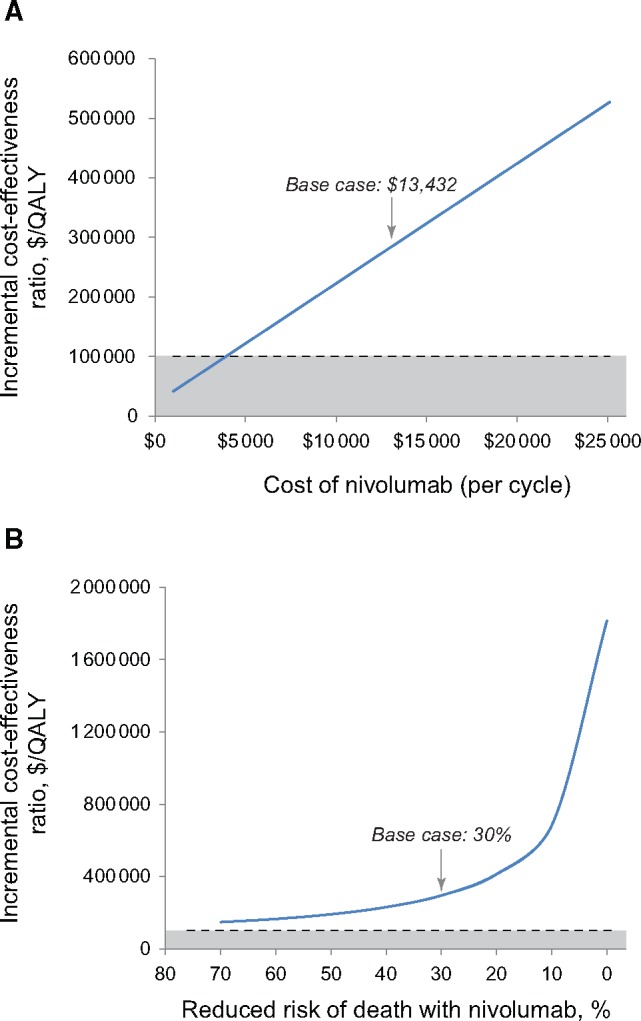
One-way sensitivity analyses. These plots represent the cost-effectiveness of nivolumab as measured with the increasing incremental cost-effectiveness ratio (ICER). The dashed line represents the willingness-to-pay threshold of $100,000 and the shaded region below the dashed line represents ICERs where nivolumab would be considered cost-effective. The top plot (A) demonstrates how the cost-effectiveness of nivolumab varies by the cost of nivolumab. The bottom plot (B) demonstrates how the cost-effectiveness of nivolumab varies with assumptions about the risk of death for nivolumab compared with standard therapy. QALY = quality-adjusted life-year.
Our model was also particularly sensitive to assumptions about survival. The Checkmate 141 trial found that patients on nivolumab had a 30% decreased risk of death compared with those receiving standard therapy (hazard ratio [HR] = 0.70) (5). If we assume that nivolumab decreased the risk of death by 50% (HR = 0.50), the ICER decreased to $191 600/QALY (Figure 3). Our base case analysis assumed that survival beyond the range reported in the CheckMate study would follow SEER data. If we assumed a more optimistic outcome in which patients alive at the end of the study were cured of their disease, the ICER of nivolumab decreased modestly to $244 600/QALY. Even when the cost-effectiveness model assumed that nivolumab cured patients and we capped nivolumab use at 12 months, nivolumab still was not considered cost-effective, with an ICER of $147 800/QALY. Supplementary Table 3 (available online) summarizes the results of these sensitivity analyses.
Probabilistic Sensitivity Analysis
We conducted a probabilistic sensitivity analysis over 100 000 iterations to vary distributions of cost, survival, and utility simultaneously. This analysis demonstrated the relative stability of our cost-effectiveness analysis results. At a willingness-to-pay threshold of $100 000/QALY, we found that standard therapy would be cost-effective 99.999% of the time (Figure 4). If we increased the willingness-to-pay threshold to $200 000/QALY, the likelihood of nivolumab becoming cost-effective increased slightly, though standard therapy remained the most cost-effective treatment option 86% of the time (Figure 4).
Figure 4.
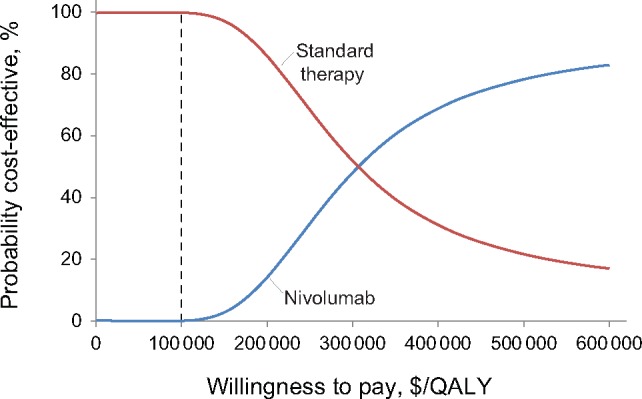
Cost-effectiveness acceptability curve. This plot shows the results of a probabilistic sensitivity analysis comparing the cost-effectiveness of nivolumab with standard therapy for recurrent/metastatic squamous cell carcinoma of the head and neck. QALY = quality-adjusted life-year.
Discussion
The United States spent 3.2 trillion USD on health care in 2015, representing 17.8% of the United States’ GDP according to the National Health Expenditures Account (36). This proportion is expected to rise to 20% over the next decade, growing 1.2% per year faster than the GDP (9). Cancer treatment costs, totaling $87.8 billion in 2014 (37), represent a sizeable portion of overall spending and are projected to increase. The cost of treating HNC, for instance, has increased substantially over the past decades. In 1998, the estimated cost of care was $2547 per month (38), which increased to $10 902 by 2008 (39). The cost of systemic therapy represents a key driver of this cost increase (40), and the introduction of immunotherapy stands to increase these costs further.
Countries with defined health care budgets take active efforts to curb rising health costs. England, for example, recently published guidelines indicating that it would not support use of nivolumab in HNC due to the high cost (41). The United States lacks a governing body with the impetus to constrain costs, and as such has the highest per capita health care spending costs in the world (42). Cancer represents one of the fastest growing components of health care cost, largely attributable to expensive drugs, which raises the question of whether policy changes to control these prices may be necessary. Industry argues that the substantial cost of bringing a drug to market leads to high drug prices; however, in health economics the financial incentives of industry often fail to align with the goal of maximizing social benefit (43). While drug pricing policies in the United States have yet to be embraced, increasing drug costs may soon force the issue, rendering cost-effectiveness analyses such as this study necessary.
While increasing health care cost impacts society as a whole, one must consider the impact on the individual patient. Increasing deductibles, copayments, and coinsurance payments represent a substantial burden for cancer patients. The concept of financial toxicity has recently gained attention given that health care costs lead to patient distress (44) and decreased patient compliance and may act as a risk factor for early mortality (45,46). With HNC specifically, the magnitude of this issue is likely to grow. As of 2015, there were 14 monoclonal antibodies in clinical trials for the treatment of patients with HNC (47). Plus, the current trend to combine immunotherapy agents creates the potential for drug costs alone to top $200 000 per year (5,48).
To the best of our knowledge, this study represents the first cost-effectiveness study evaluating immunotherapy in HNC. The cost-effectiveness of nivolumab has been studied in metastatic melanoma (48,49), non–small cell lung cancer (NSCLC) (50,51), and renal cell carcinoma (52). In three of these studies, the authors found nivolumab to be not cost-effective compared with standard therapies with ICERs ranging from $140 601/QALY(50) to $278 706/QALY (48). Two studies found nivolumab to be cost-effective; the first compared nivolumab with ipilimumab in NSCLC (49), and the second used nivolumab + ipilimumab as second line in comparison with a series of mostly immunotherapy treatment options in metastatic melanoma (48). Of note, the two studies that found nivolumab to be a cost-effective treatment option both compared nivolumab with other costly, targeted therapies, whereas our study compared nivolumab with less costly standard therapies. This difference in comparator arms likely explains the difference in findings related to the cost-effectiveness of nivolumab.
A key observation in our study regards the lack of model sensitivity to assumptions about survival. We tested a range of assumptions about the survival benefits of nivolumab, and even in the optimistic scenarios where nivolumab cured patients, the treatment failed to cross the threshold for cost-effectiveness. While prolonged survival leads to gains in QALY, the parallel increases in cost due to prolonged costly treatment among responders precluded this from translating into cost-effectiveness. Newer systemic agents at high price points could create a paradigm where cost-effectiveness is not achievable.
While not particularly sensitive to assumptions about survival, this cost-effectiveness analysis did demonstrate a modest degree of sensitivity to assumptions about nivolumab cost and duration of use. As one would expect, shortening the duration of treatment pushes nivolumab much closer to cost-effectiveness. We lack a clear understanding of the required duration of treatment among responders (53); therefore, if immunotherapy treatments can produce prolonged survival after discontinuation, these agents might translate into cost-effective treatment options at their current price. On the other hand, a subset of patients will respond to immunotherapy after initial disease progression (54), and current protocols allow for continued nivolumab after progression. If patients stay on nivolumab after disease progression, this would further increase costs, and nivolumab could become even less cost-effective. Future research into the unanswered question of treatment duration will help indirectly address the issue of immunotherapy value.
This analysis has limitations worth mentioning. The CheckMate 141 trial found that nivolumab was more effective in patients with a baseline PD-L1 of 1% or higher, and found a larger absolute survival benefit among patients with p16-positive tumors. Despite these findings, current guidelines in patients with advanced or recurrent HNC do not require PD-L1 biomarker analysis or consideration of p16 status when making treatment decisions regarding nivolumab (4). Improved patient selection may improve survival and potentially make nivolumab a cost-effective treatment. On the other hand, biomarker testing increases overall health care costs. The cost-effectiveness of biomarker-driven therapy deserves additional research. With this project specifically, our sensitivity analysis demonstrates that improvements in survival only modestly improve cost-effectiveness, which suggests that improved patient selection for nivolumab would unlikely produce a cost-effective treatment under $100 000/QALY.
Another limitation relates to the sources of data used to inform the cost-effectiveness model. We used data from the Checkmate 141 trial whenever possible, though we obtained health utility data and cost estimates from a variety of sources. While mis-estimation could influence our results, in general our model was not particularly sensitive to health utility values or costs other than the cost of nivolumab. Finally, as noted above, we lack information on long-term survival and optimal duration of nivolumab. Despite the extensive sensitivity analyses presented in this manuscript, if real-life survival or nivolumab use was to vary substantially from the values in these analyses, the true cost-effectiveness could differ from our findings.
While nivolumab substantially improves overall survival in patients with recurrent and metastatic HNC, this therapy is not a cost-effective treatment option at its current cost under a wide array of assumptions. While innovations in immunotherapy are promising, we must critically examine the financial and social impact of these therapies on patients and the health care system.
Funding
This study was supported by the National Institutes of Health (grant number 1TL1TR001443) to KRT and KTC.
Notes
The funder had no role in the design of the study; the collection, analysis, or interpretation of the data; the writing of the manuscript; or the decision to submit the manuscript for publication.
The authors have no conflicts of interest to report.
Supplementary Material
References
- 1. Ferlay J, Soerjomataram I, Dikshit R et al. , Cancer incidence and mortality worldwide: Sources, methods and major patterns in GLOBOCAN 2012. Int J Cancer. 2015;136(5):E359–E386. [DOI] [PubMed] [Google Scholar]
- 2. Fitzmaurice C, Allen C, Barber R, Barregard L, Bhutta Z.. Global, regional, and national cancer incidence, mortality, years of life lost, years lived with disability, and disability-adjusted life-years for 32 cancer groups, 1990 to 2015: A systematic analysis for the Global Burden of Disease Study. JAMA Oncol. 2017;3(4):524–548. [DOI] [PMC free article] [PubMed] [Google Scholar]
- 3. Pignon J, le Maître A, Maillard E, Bourhis J.. Meta-analysis of chemotherapy in head and neck cancer (MACH-NC): An update on 93 randomised trials and 17,346 patients. Radiother Oncol. 2009;92(1):4–14. [DOI] [PubMed] [Google Scholar]
- 4. Adelstein D, Gillison ML, Pfister DG et al. , NCCN guidelines insights: Head and neck cancers, version 2.2017. J Natl Compr Canc Netw. 2017;15(6):761–770. [DOI] [PubMed] [Google Scholar]
- 5. Ferris RL, Blumenschein G, Fayette J et al. , Nivolumab for recurrent squamous-cell carcinoma of the head and neck. N Engl J Med. 2016;375(19):1856–1867. [DOI] [PMC free article] [PubMed] [Google Scholar]
- 6. Shih Y-CT, Elting LS, Pavluck AL, Stewart A, Halpern MT.. Immunotherapy in the initial treatment of newly diagnosed cancer patients: Utilization trend and cost projections for non-Hodgkin’s lymphoma, metastatic breast cancer, and metastatic colorectal cancer. Cancer Invest. 2010;28(1):46–53. [DOI] [PubMed] [Google Scholar]
- 7. Geynisman DM, Chien C-R, Smieliauskas F, Shen C, Shih Y-CT.. Economic evaluation of therapeutic cancer vaccines and immunotherapy: A systematic review. Hum Vaccin Immunother. 2014;10(11):3415–3424. [DOI] [PMC free article] [PubMed] [Google Scholar]
- 8. De Souza JA, Santana IA, De Castro G, De Lima Lopes G, Tina Shih YC.. Economic analyses in squamous cell carcinoma of the head and neck: A review of the literature from a clinical perspective. Int J Radiat Oncol Biol Phys. 2014;89(5):989–996. [DOI] [PubMed] [Google Scholar]
- 9.Centers for Medicare and Medicaid Services. National health expenditure projections 2015-2025. 2016. https://www.cms.gov/Newsroom/MediaReleaseDatabase/Press-releases/2016-Press-releases-items/2016-07-13.html. Accessed January 12, 2017.
- 10. Warren JL, Yabroff KR, Meekins A, Topor M, Lamont EB, Brown ML.. Evaluation of trends in the cost of initial cancer treatment. J Natl Cancer Inst. 2008;100(12):888–897. [DOI] [PMC free article] [PubMed] [Google Scholar]
- 11. Howard DH, Bach PB, Berndt ER, Conti RM.. Pricing in the market for anticancer drugs. J Econ Perspect. 2015;29(1):139–162. [DOI] [PubMed] [Google Scholar]
- 12. Sanders GD, Neumann PJ, Basu A et al. , Recommendations for conduct, methodological practices, and reporting of cost-effectiveness analyses. JAMA. 2016;316(10):1093. [DOI] [PubMed] [Google Scholar]
- 13.Surveillance, Epidemiology, and End Results (SEER) Program. SEER*Stat Database: Incidence - SEER 9 regs research data. linked to county attributes - Total U.S., 1969-2015 Counties, National Cancer Institute, DCCPS, Surveillance Research Program. 2016. https://seer.cancer.gov. Accessed November 14, 2016.
- 14. Bell F, Miller M. Life tables for the united states social security area 1900-2100. https://www.ssa.gov/oact/NOTES/as116/as116_Tbl_1.html. Accessed November 14, 2016.
- 15. Sanders GD, Neumann PJ, Basu A et al. , Recommendations for conduct, methodological practices, and reporting of cost-effectiveness analyses: Second Panel on Cost-Effectiveness in Health and Medicine. JAMA. 2016;316(10):1093–1103. [DOI] [PubMed] [Google Scholar]
- 16.Nivolumab: Drug information. UpToDate. Waltham, Mass: UpToDate; 2016. www.uptodate.com. Accessed December 14, 2016.
- 17.Nivolumab. CardinalHealth. Dublin, OH: CardinalHealth; 2016. www.cardinalhealth.com. Accessed December 14, 2016.
- 18.Cetuximab: Drug information. UpToDate. Waltham, Mass: UpToDate; 2016. www.uptodate.com. Accessed December 14, 2016.
- 19.Cetuximab. CardinalHealth. Dublin, OH: CardinalHealth; 2016. www.cardinalhealth.com. Accessed December 14, 2016.
- 20.Methotrexate: Drug information. UpToDate. Waltham, Mass: UpToDate; 2016. www.uptodate.com. Accessed December 14, 2016.
- 21.Methotrexate. CardinalHealth. Dublin, OH: CardinalHealth; 2016. www.cardinalhealth.com. Accessed December 14, 2016.
- 22.Docetaxel: Drug information. UpToDate. Waltham, Mass: UpToDate; 2016. www.uptodate.com. Accessed December 14, 2016.
- 23.Docetaxel. CardinalHealth. Dublin, OH: CardinalHealth; 2016. www.cardinalhealth.com. Accessed December 14, 2016.
- 24. Niraula S, Amir E, Vera-Badillo F, Seruga B, Ocana A, Tannock I.. Risk of incremental toxicities and associated costs of new anticancer drugs. J Clin Oncol. 2014;32(32):3634–3642. [DOI] [PubMed] [Google Scholar]
- 25. Smith D, Adams J, Johnston S.. A comparative economic analysis of pegylated liposomal doxorubicin versus topotecan in ovarian cancer in the USA and the UK. Ann Oncol. 2002;13:1590–1597. [DOI] [PubMed] [Google Scholar]
- 26. Hornberger J, Hirsch F, Li Q, Page R.. Outcome and economic implications of proteomic test-guided second- or third-line treatment for advanced non-small cell lung cancer: Extended analysis of the PROSE trial Lung Cancer. Lung Cancer. 2015;88(2):223–230. [DOI] [PubMed] [Google Scholar]
- 27. van den Hurk CJ, van den Akker-van Marle M, Breed W, van de Poll-Franse L, Nortier J, Coebergh J.. Cost-effectiveness analysis of scalp cooling to reduce chemotherapy-induced alopecia. Acta Oncol (Madr). 2014;53(1):80–87. [DOI] [PubMed] [Google Scholar]
- 28. van der Linden N, van Gils C, Pescott C, Buter J, Vergeer M, Groot C.. Real-world cost-effectiveness of cetuximab in locally advanced squamous cell carcinoma of the head and neck. Eur Arch Otorhinolaryngol. 2015;272(8):2007–2016. [DOI] [PubMed] [Google Scholar]
- 29. Retèl V, van der Molen L, Hilgers F et al. , A cost-effectiveness analysis of a preventive exercise program for patients with advanced head and neck cancer treated with concomitant chemo-radiotherapy. BMC Cancer. 2011;11(475). [DOI] [PMC free article] [PubMed] [Google Scholar]
- 30. Freeman K, Connock M, Cummins E et al. , Fluorouracil plasma monitoring: Systematic review and economic evaluation of the My5-FU assay for guiding dose adjustment in patients receiving fluorouracil chemotherapy by continuous infusion. Heal Technol Assessments. 2015;19(91):1–321. [DOI] [PMC free article] [PubMed] [Google Scholar]
- 31. Schremser K, Rogowski W, Adler-Reichel S, Tufman A, Huber R, Stollenwerk B.. Cost-effectiveness of an individualized first-line treatment strategy offering erlotinib based on EGFR mutation testing in advanced lung adenocarcinoma patients in Germany. Pharmacoeconomics. 2015;33(11):1215–1228. [DOI] [PubMed] [Google Scholar]
- 32. Beusterien K, Davies J, Leach M et al. , Population preference values for treatment outcomes in chronic lymphocytic leukaemia: A cross-sectional utility study. Heal Qual Life Outcomes. 2010;8(50). [DOI] [PMC free article] [PubMed] [Google Scholar]
- 33. Wolowacz S, Cameron D, Tate H, Bagust A.. Docetaxel in combination with doxorubicin and cyclophosphamide as adjuvant treatment for early node-positive breast cancer: A cost-effectiveness and cost-utility analysis. J Clin Oncol. 2008;26(6):925–933. [DOI] [PubMed] [Google Scholar]
- 34. Braithwaite RS, Meltzer DO, King JT Jr, Leslie D, Roberts MS.. What does the value of modern medicine say about the $50,000 per quality-adjusted life-year decision rule? Med Care. 2008;46(4):349–356. [DOI] [PubMed] [Google Scholar]
- 35. Acevedo JR, Fero KE, Wilson B et al. , Cost-effectiveness analysis of elective neck dissection in patients with clinically node-negative oral cavity cancer. J Clin Oncol. In press. [DOI] [PMC free article] [PubMed] [Google Scholar]
- 36.National Health Expenditures 2015. Highlights. https://www.cms.gov/Research-Statistics-Data-and-Systems/Statistics-Trends-and-Reports/NationalHealthExpendData/Downloads/highlights.pdf. Accessed July 24, 2017.
- 37. American Cancer Society. Economic impact of cancer. https://www.cancer.org/cancer/cancer-basics/economic-impact-of-cancer.html. Accessed July 24, 2017.
- 38. Lang K, Menzin J, Earle C, Jacobson J, Hsu J.. The economic cost of squamous cell cancer of the head and neck: Findings from linked SEER-Medicare data. Arch Otolaryngol Head Neck Surg. 2004;130(11):1269–1275. [DOI] [PubMed] [Google Scholar]
- 39. Kim Le T, Winfree K, Yang H et al. , Treatment patterns and economic burden of metastatic and recurrent locally-advanced head and neck cancer patients. J Med Econ. 2012;15(4):786–795. [DOI] [PubMed] [Google Scholar]
- 40. Wissinger E, Griebsch I, Lungershausen J, Foster T, Pashos CL.. The economic burden of head and neck cancer: A systematic literature review. Pharmacoeconomics. 2014;32(9):865–882. [DOI] [PMC free article] [PubMed] [Google Scholar]
- 41.Nivolumab for treating squamous cell carcinoma of the head and neck after platinumbased chemotherapy. 2017. https://www.nice.org.uk/guidance/gid-ta10080/documents/appraisal-consultation-document. Accessed July 24, 2017.
- 42. World Health Organization. Global Health Expenditure Database. http://data.worldbank.org/indicator/SH.XPD.TOTL.ZS?year_high_desc=true. Accessed July 24, 2017.
- 43. Bernstein J. Drug price controls are vital in a market that’s not free. NYTimes.com. https://www.nytimes.com/roomfordebate/2015/09/23/should-the-government-impose-drug-price-controls/drug-price-controls-are-vital-in-a-market-thats-not-free. Published September 23, 2015. Accessed August 5, 2017.
- 44. Abbott D, Voils C, Fisher D, Greenberg C, Safdar N.. Socioeconomic disparities, financial toxicity, and opportunities for enhanced system efficiencies for patients with cancer. J Surg Oncol. 2017;115(3):250–256. [DOI] [PubMed] [Google Scholar]
- 45. Zafar S, Peppercorn J, Schrag D et al. , The financial toxicity of cancer treatment: A pilot study assessing out-of-pocket expenses and the insured cancer patient’s experience. Oncologist. 2013;18(4):381–390. [DOI] [PMC free article] [PubMed] [Google Scholar]
- 46. Ramsey S, Bansal A, Fedorenko C et al. , Financial insolvency as a risk factor for early mortality among patients with cancer. J Clin Oncol. 2016;34(9):980–986. [DOI] [PMC free article] [PubMed] [Google Scholar]
- 47. Ferris RL. Immunology and immunotherapy of head and neck cancer. J Clin Oncol. 2015;33(29):3293–3304. [DOI] [PMC free article] [PubMed] [Google Scholar]
- 48. Kohn CG, Zeichner SB, Chen Q, Montero AJ, Goldstein DA, Flowers CR.. Cost-effectiveness of immune checkpoint inhibition in BRAF wild-type advanced melanoma. J Clin Oncol. In press. [DOI] [PMC free article] [PubMed] [Google Scholar]
- 49. Bohensky MA, Pasupathi K, Gorelik A, Kim H, Harrison JP, Liew D.. A Cost-effectiveness analysis of nivolumab compared with ipilimumab for the treatment of BRAF wild-type advanced melanoma in Australia. Value Heal. 2016;19(8):1009–1015. [DOI] [PubMed] [Google Scholar]
- 50. Goeree R, Villeneuve J, Goeree J, Penrod JR, Orsini L, Tahami Monfared AA.. Economic evaluation of nivolumab for the treatment of second-line advanced squamous NSCLC in Canada: A comparison of modeling approaches to estimate and extrapolate survival outcomes. J Med Econ. 2016;19(6):630–644. [DOI] [PubMed] [Google Scholar]
- 51. Matter-Walstra K, Schwenkglenks M, Aebi S et al. , A cost-effectiveness analysis of nivolumab versus docetaxel for advanced nonsquamous NSCLC including PD-L1 testing. J Thorac Oncol. 2016;11(11):1846–1855. [DOI] [PubMed] [Google Scholar]
- 52. Wan XM, Peng LB, Ma JA, Li YJ.. Economic evaluation of nivolumab as a second-line treatment for advanced renal cell carcinoma from US and Chinese perspectives. Cancer. In press. [DOI] [PubMed] [Google Scholar]
- 53. Bauml J, Cohen R, Aggarwal C.. Immunotherapy for head and neck cancer: Latest developments and clinical potential. Ther Adv Med Oncol. 2016;8(3):168–175. [DOI] [PMC free article] [PubMed] [Google Scholar]
- 54. Haddad R, Robert L, Blumenschein GJ. Treatment beyond progression with nivolumab in patients with recurrent or metastatic squamous cell carcinoma of the head and neck in the phase 3 Checkmate 141 study. Abstract CT157/23, ed. Poster presented at: American Association for Cancer Research Annual Meeting 2017; Washington, DC.
- 55. Blumen H, Fitch K, Polkus V.. Comparison of treatment costs for breast cancer, by tumor stage and type of service. Am Heal Drug Benefits. 2016;9(1):23–32. [PMC free article] [PubMed] [Google Scholar]
- 56. Enomoto L, Schaefer E, Goldenberg D, Mackley H, Koch W, Hollenbeak C.. The cost of hospice services in terminally ill patients with head and neck cancer. JAMA Otolaryngol Head Neck Surg. 2015;141(12):1066–1074. [DOI] [PubMed] [Google Scholar]
- 57. Li C, Zeliadt S, Hall I et al. , Burden among partner caregivers of patients diagnosed with localized prostate cancer within 1 year after diagnosis: An economic perspective. Support Care Cent. 2013;21(12):3461–3469. [DOI] [PMC free article] [PubMed] [Google Scholar]
- 58. Hopkins R, Goeree R, Long C.. Estimating the national wage loss from cancer in Canada. Curr Oncol. 2010;17(2):40–49. [DOI] [PMC free article] [PubMed] [Google Scholar]
- 59. de Almeida J, Moskowitz A, Miles B et al. , Cost-effectiveness of transoral robotic surgery versus (chemo)radiotherapy for early T classification oropharyngeal carcinoma: A cost-utility analysis. Head Neck. 2016;38(4):589–600. [DOI] [PubMed] [Google Scholar]
- 60. Lloyd A, Nafees B, Narewska J et al. , Health state utilities for metastatic breast cancer. Br J Cancer. 2006;95:683–690. [DOI] [PMC free article] [PubMed] [Google Scholar]
Associated Data
This section collects any data citations, data availability statements, or supplementary materials included in this article.