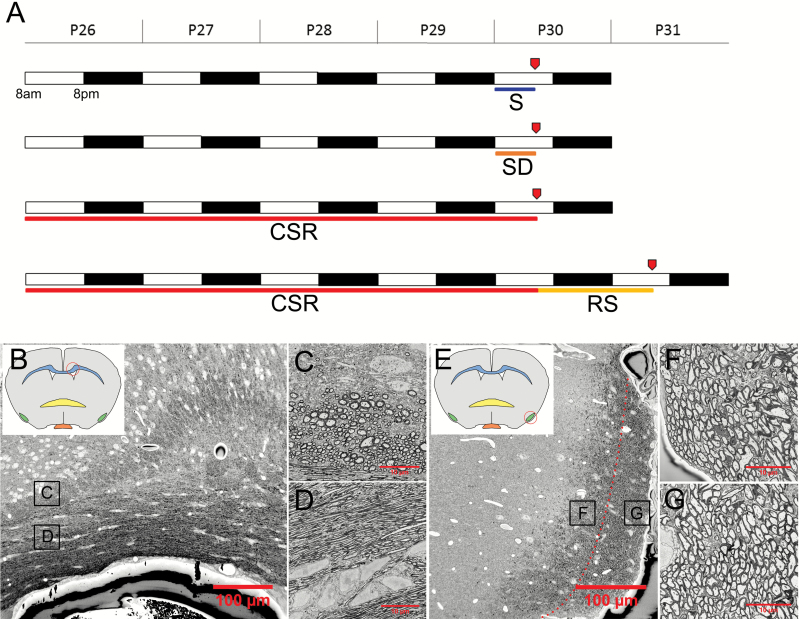
Figure 1.
(A) Experimental design (P, postnatal day). S (sleep), SD (acute sleep deprivation), CSR (chronic sleep restriction), and RS (recovery after CSR). Red arrows indicate the time of perfusion. (B) Coronal section of CC. (C) and (D) Region of interest (C) selected for the analysis. Note that fibers are almost all orthogonal in this region of CC, whereas the opposite is true for the region underneath (D), where most of the fibers are parallel. (E) Section of the LOT. Medial and lateral regions are separated by a red dotted line. (F) and (G) Medial (F) and lateral (G) LOT regions of interest selected for the analysis.

