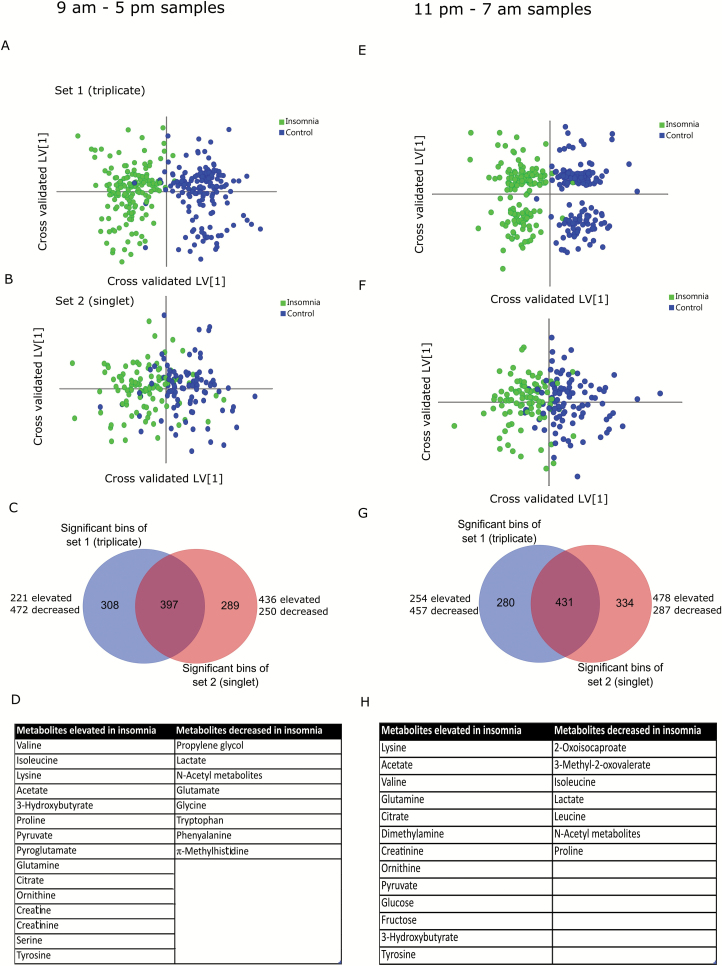
Figure 4.
Multivariate OPLS-DA analysis of insomnia and control samples over day (9 am–5 pm, A–D) and night (11 pm–7 am, E–H) samples. Cross-validated OPLS-DA scores plot showed significant clustering of insomnia and control samples over both triplicate (A/E) and singlet (B/D) sets. The bins were selected by overlap analysis (C/G) and metabolites were assigned by spectral profiling (D/H).

