Figure 6.
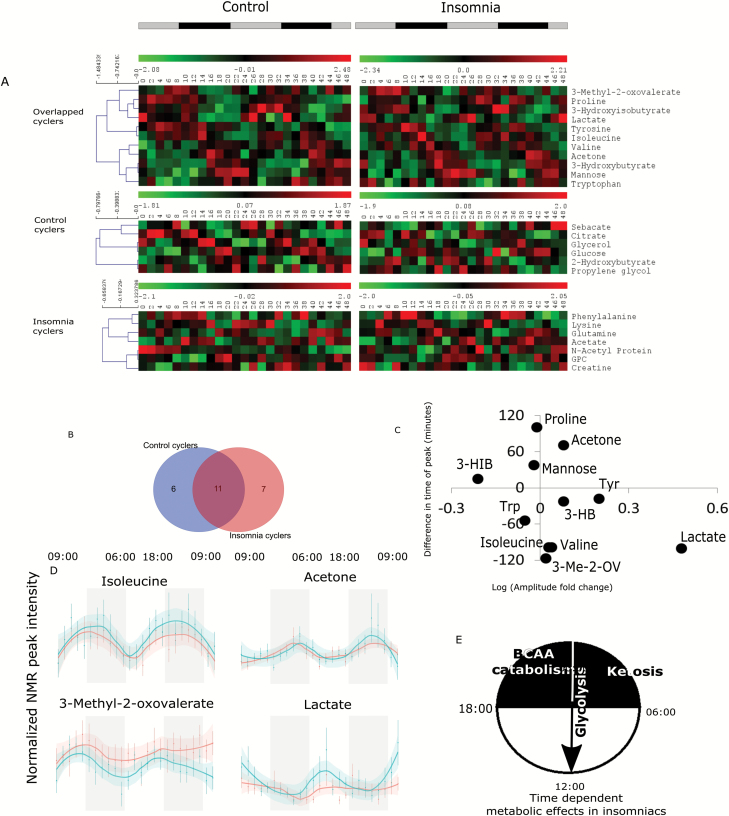
Analysis of metabolite rhythm in insomnia and control population using Metacycle 2D. Insomnia and control population was subjected to metabolite rhythm analysis separately. Control population showed 6 and insomnia population showed 7 unique cyclers, whereas 11 cyclers were common (A and B). Among the common cycling metabolites, many showed differences in fold change and amplitude (C). Representative time course plots are shown for four common metabolites (D, insomnia—blue, control—red). A proposed general metabolic state shift of insomniacs is shown over the diurnal day based on the time series analysis (E). 3-Me-2-OV = 3-methyl-2-oxovalerate; 3-HIB = 3-hydroxyisobutyrate; 3-HB = 3-hydroxybutyrate; Trp = tryptophan.

