Abstract
Background
Microarray experiments offer a potent solution to the problem of making and comparing large numbers of gene expression measurements either in different cell types or in the same cell type under different conditions. Inferences about the biological relevance of observed changes in expression depend on the statistical significance of the changes. In lieu of many replicates with which to determine accurate intensity means and variances, reliable estimates of statistical significance remain problematic. Without such estimates, overly conservative choices for significance must be enforced.
Results
A simple statistical method for estimating variances from microarray control data which does not require multiple replicates is presented. Comparison of datasets from two commercial entities using this difference-averaging method demonstrates that the standard deviation of the signal scales at a level intermediate between the signal intensity and its square root. Application of the method to a dataset related to the β-catenin pathway yields a larger number of biologically reasonable genes whose expression is altered than the ratio method.
Conclusions
The difference-averaging method enables determination of variances as a function of signal intensities by averaging over the entire dataset. The method also provides a platform-independent view of important statistical properties of microarray data.
Background
Comparative gene expression using microarrays plays an increasingly important role in analysis of biological control mechanisms, phenotyping, cell classification, and a variety of other applications (see [1-3], for review). There are now several commercial purveyors of microarray equipment and reagents, as well as companies that perform experiments on a contract basis. The output of microarray experiments typically consists of intensity measurements that are manipulated by scaling, background subtraction and other correction procedures, the details of which are often proprietary. In the case of experiments performed by contract, computer files are returned to the customer which contain lists of sequences, matched intensities and, in some instances, intensity ratios compared to internal references.
Representation of intensity data as ratios has considerable value for biologists. Seldom are absolute levels of mRNA expression of interest. Rather, the relative changes in expression of individual genes between two samples are more informative. But the use of ratios to characterize differences may have drawbacks. For example, estimates of significance are more difficult to determine. In addition, potential improvements in estimates of high signals compared to low signals may not be adequately represented by a ratio. Thus, a conservative evaluation of confidence levels is called for, limiting useful information that may be extracted from the intensity data.
Analytical approaches that rely on signal subtraction may have certain advantages [4-6]. Variances for such difference values are the sums of the variances for the individual measurements. Therefore, a simple, general method to estimate variance at specific signal intensities may permit more effective data analysis. In the absence of replicates, the intensity distributions for individual genes (and, therefore, the distribution mean (μ) and variance (σ2)) are unknown. For an experiment that examines two hybridizations that involve the same RNA sample, each gene is matched with two intensities, S1 and S2. The μ's for the distributions of each S are not known and range widely, reflecting low or high gene expression. However, for properly handled data, μ for the difference, S1 - S2 = ΔS, should be approximately zero for all intensity levels. If the intensities are distributed normally, then the ΔS distribution can be used in principle to determine σ2 for a given signal (σS2) because σS2 = σΔS2/2; that is, the variance of the difference of two identical distributions is twice the variance of the individual function.
Here we present results from investigation of two commercial microarray platforms, the Affymetrix system and the Incyte Genomics system. We show that the control data for both platforms, after proprietary manipulation procedures, are well behaved using some statistical measures. We further show that intensity differences can be used to supply variance estimates of these differences in a simple way, without the need for multiple replicate datasets. These variances can be applied to non-control data to estimate p values for specific changes in gene expression. The method described here is intended to supplement more elaborate analytical procedures that depend on larger numbers of independent observations.
Results
Reproducibility of intensity measurements
The two platforms were examined independently and all comparisons were limited to datasets within one platform. For the Affymetrix experiments, RNA samples from D. melanogastor heads were used; for Incyte experiments, human HEK293 cell line RNA (see Methods). Intensity measurements from the mRNA samples were analyzed using the data provided by the commercial groups; no scaling or background subtraction was performed other than the proprietary modifications to intensities carried out prior to distribution of the files to the customer.
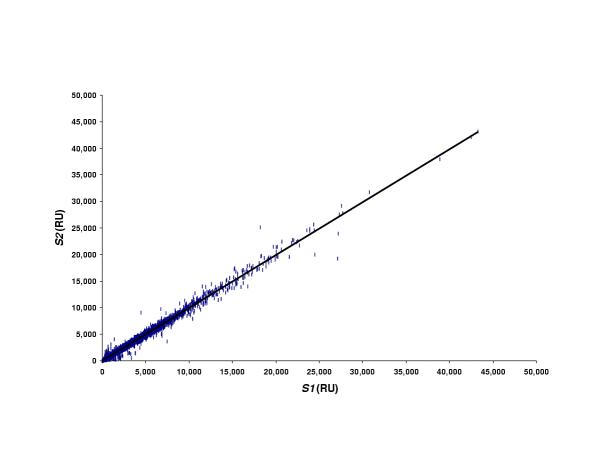
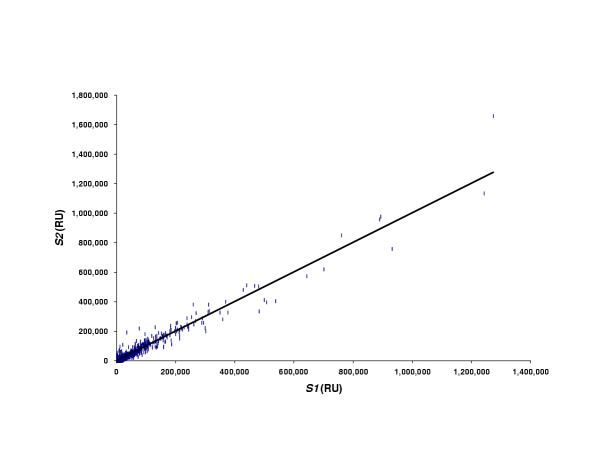
To investigate the general properties of the data, the intensities from two independent experiments using the same control RNA (S1 and S2) were plotted (Figs. 1, 2). In both cases, Affymetrix and Incyte, the data fit a straight line with slope approximately equal to one and intercept near zero. Thus, the data produced by both platforms were judged to be well behaved, with no obvious skewing or bias in the expression measurements.
Figure 1.
Scatter plot of control sample 1 intensities (S1) vs. sample 2 intensities (S2) for the Incyte platform; y = 0.995x + 13.988. RU, relative units.
Figure 2.
Scatter plot of control intensities (as in Fig. 1) for the Affymetrix platform; y = 1.003x + 54.79.
Distributions of intensity differences
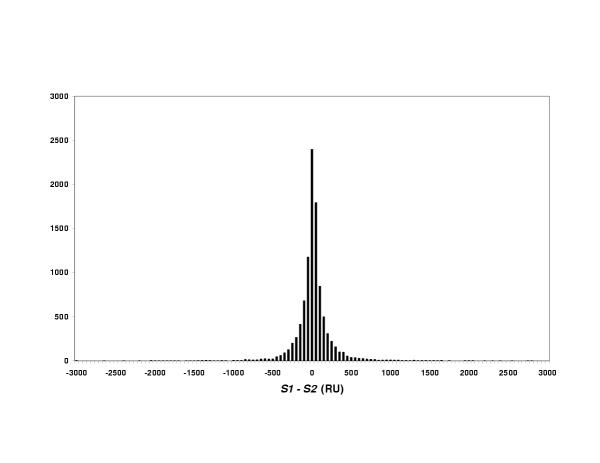
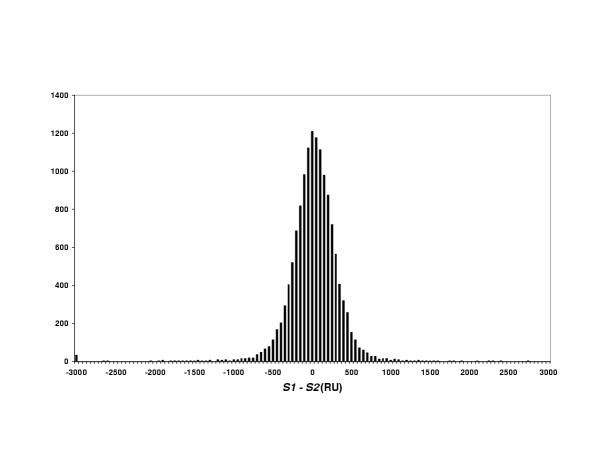
To analyze data scatter in a different way, intensities of the control RNAs within each data type were subtracted from one another and the differences (S1-S2) were graphed as a histogram (Figs. 3, 4). As expected from the intensity plots in Figure 1, the differences in each dataset were distributed as a bell-shaped curve with a mean near zero. The histograms revealed some outliers, suggesting possible divergence from the normal distribution. However, at least some of these outliers resulted from the non-continuous distribution of signal intensities in the datasets. Standard deviations of each histogram were different, probably due to differences in the detection methods, scaling, etc. used by the two groups. However, each histogram had general attributes of a Gaussian distribution (e.g., area as a function of z value (where z = (x - μ) /σ; not shown). Because a sum of Gaussians is also Gaussian, this finding was consistent with normally distributed individual intensity measurements.
Figure 3.
Histogram of control signal differences (S1-S2) for the Incyte platform. RU, relative units.
Figure 4.
Histogram of control signal differences for the Affymetrix platform. Affymetrix data were divided by 16.67 to allow comparison with Incyte data (Fig. 3) on the same scale.
Variance of intensity difference as a function of signal intensity
In many cases, measurement accuracies (and the signficance of individual measurements) are related in a straightforward way to the magnitude of the signal. Photon counts are such a case, and it is expected that higher signal strengths (intensities) should have smaller percentage errors compared to weaker signals. If such measurement errors could be estimated, confidence values could be calculated for specific differences.
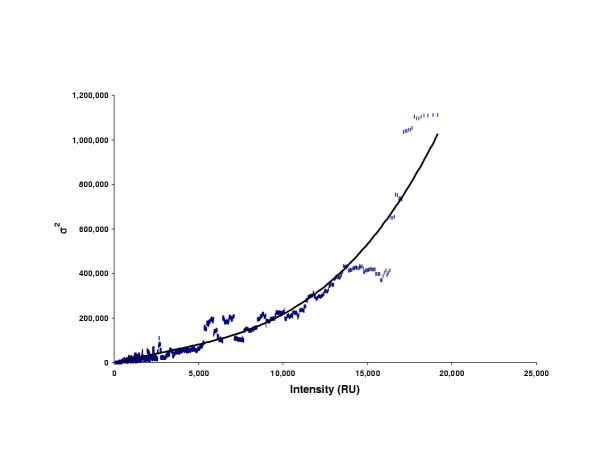
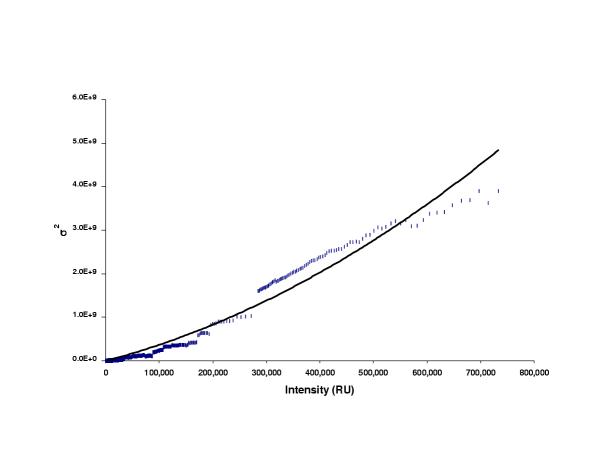
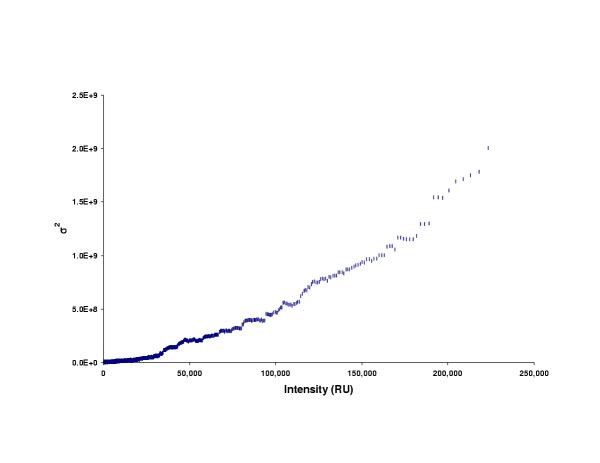
To obtain such estimates, an average intensity was calculated for each signal pair (= (S1+S2)/2). The averaged intensities were sorted in descending rank order and were averaged again, using a sliding window with 100 consecutive values incremented by one position at a time. The matching differences (ΔS) were also grouped in sets of 100 in the same way. However, instead of averaging, the ΔS sets were used to compute σΔS2. Plots revealed the relationship between the intensity and σS2 (=σΔS2/2; Figs. 5, 6). To these plots, various curves were fitted, including polynomials and straight lines, and goodness-of-fit values (R2) calculated. Linear fits to the signal vs. σS2 data did not produce acceptable approximations to the Incyte data (R2 = 0.789). However, quadratic and cubic polynomials fit the Incyte data reasonably well (R2 > 0.9). A linear equation fit the Affymetrix data well (R2 = 0.943), but visual inspection revealed a poor fit at lower intensities; thus a quadratic was used. Such polynomials provided a means to estimate σS2, and hence, z values for each difference. Notably, it was important to use data spanning the entire relevant intensity range; extrapolation from low intensity data to high-intensity data did not give reliable results (not shown). Functions were also fit to plots of average signal vs. σS. These plots suggested that the scatter in the data increased at a rate intermediate between σ and σ2, with the Affymetrix data more closely approximating proportionality to σ2 than the Incyte data (not shown).
Figure 5.
Scatter plot of average intensities ((S1+S2)/2) vs. variance (σ2) for the two control samples from the Incyte experiment. Average intensities were first sorted by magnitude, then averaged using a sliding window of 100 points; The same window was used to calculate σ2 for the corresponding sets of differences. A polynomial was fit to the data using least squares of form: y = 2 × 10-7x3 - 1.7 × 10-3x2 + 21.503x - 6548.3; R2 = 0.914. RU, relative units.
Figure 6.
Scatter plot of average intensities vs. variance for the two control samples from the Affymetrix platform as in Figure 5; fitted polynomial has form: y = 0.0046x2 + 3215.3x - 4 × 10⁻⁶; R2 = 0.967.
The fine structure of the signal vs. variance plots was also interesting. In both cases the plots were noisy, though the Affymetrix data was smoother than the Incyte data. Fine-structure patterns were not preserved among different experiments using one platform and, therefore, probably do not reflect any fundamental trend for a given platform (see Discussion). Quality of the Incyte data was arguably poorer than the Affymetrix data, based on the analysis of signal vs. σ2. However, other Incyte datasets displayed smoother behavior, though the general form of the intensity vs. σ2 data was similar (see Discussion).
Application of the method
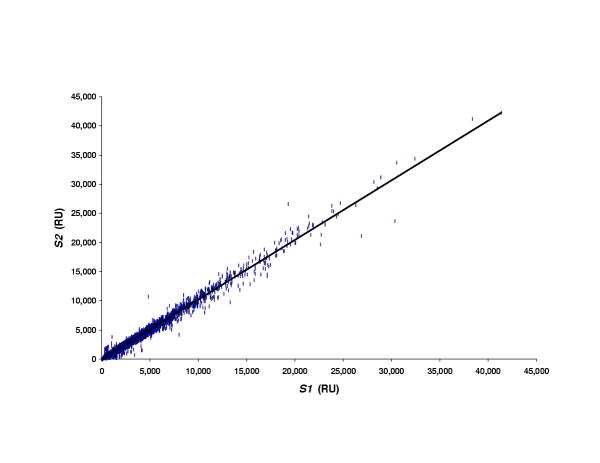
The algorithm described above was applied to a microarray experiment designed to compare gene expression in human cells harboring either a cadherin-derived inhibitor (Cad5CD) of the β-catenin pathway, or a dominant-negative Tcf inhibitor (TcfDN) of the pathway [7,8]. The biological interpretation of the results will be presented elsewhere (Pierce and Kamb, unpublished). Each RNA sample was compared to the control RNAs (made from cells without expressed inhibitors) used in the analysis of the Incyte platform described above. Plots of all single dye intensity combinations were fit well by unit slope lines through the origin (e.g., Fig. 7), and the ΔS histogram was approximately Gaussian (not shown), suggesting reasonable data quality. No dramatic differences in gene expression were detected; the single largest ratio was only 2.3-fold compared to the control. z values for the Cad5CD – Control and TcfDN – Control were compared, using σ computed from the cubic polynomial of Fig. 3A. All measurements with low averages ((S1+S2)/2 < 400), corresponding to about 20% of the total dataset were excluded.
Figure 7.
Scatter plot of Cad5CD signal vs. TcfDN signal. Fitted line has form: y = 1.027x - 45.668 with R2 = 0.986. RU, relative units.
Comparison of the two inhibitors using the difference-averaging method described above yielded many more significant differences than the Incyte group's suggested ratio threshold (intensity ratio < -1.7 or > 1.7; Table 1). For the application of the difference averaging method, |z| > 3 (corresponding to p < 0.01 for normally distributed data) was chosen as cutoff. All the ratio outliers, with a single exception that had low intensities in both experiments, were also present in the set of sequences selected based on z. The biological relevance of this set of selected points was suggested by inclusion of a gene, cyclinD1, known to be down-regulated by expression of TcfDN [9]. This gene (z < -3.4) displayed only a 1.3-fold suppression compared to the control, but its high measured intensities pushed it over the limit for significance using the signal difference-averaging method. Furthermore, for all but three of the sequences selected by |z| > 3, the sign of the difference was the same in both datasets, as expected based on the biological actions of the two inhibitors. Ratios as low as +/- 1.2 were deemed significant for |z| > 3 (not shown). Such low ratios may have biological significance, especially considering the steep dose/response of many signaling systems and the fact that microarray experiments provide population-averaged rather than single-cell measurements of mRNA changes [10].
Table 1.
Genes whose expression differs significantly from controls
| Method | Cutoff | Cad5CD | TcfDN | Both | Total | Total | |||
| Only | Only | (Same Sign) | |||||||
| Up | Down | Up | Down | Up | Down | ||||
| Ratio | 1.7 | 0 | 4 | 0 | 0 | 0 | 1 | 5 | 5 |
| Diff. | 3.0 | 5 | 12 | 9 | 26 | 2 | 15 | 69 | 66 |
Genes whose expression differs significantly from controls analyzed either by either by ratio or by the difference-averaging method (diff.). All 5 genes in the ratio set are present in the diff. set (see results). "Cutoff" is an intesity ratio for "Ratio" and a z value for "Diff." "Both" encompasses genes that are up- or down-regulated in both datasets (Cad5CD and TcfDN) for |z|>3.
Discussion
In using intensity ratios for comparison of gene expression levels, a choice must be made about data presentation. In particular, it is necessary to confront a mathematical problem inherent in expression ratios. Consider a comparison of two RNA samples, A and B, and associated intensity values for RNAs, an and bn. If, after background subtraction, one RNA (bi) is undetectable while ai yields a measurable signal, then ai / bi approaches infinity. Moreover, for ai > bi, ai / bi > 1; but for ai < bi, 0 < ai / bi < 1, resulting in an asymmetric representation of comparative intensity values. These situations can be rectified in arbitrary ways; for instance, by setting backgrounds to a non-zero value and using a logarithm transform of the ratio. Alternatively, introduction of a discontinuity along with sign/ratio inversion (e.g., for ai > bi, use ai / bi; for ai < bi, use -bi / ai) solves the problem. Such considerations do not arise if intensity differences are used.
Several algorithms have been developed to analyze microarray data both in the private and public sectors. Some attention has been devoted to the problem of estimating backgrounds, scaling data for dataset merging, and determining statistical significance of intensity differences or ratios. The most sophisticated published treatments for determination of significance use Bayesian probability methods, maximum likelihood procedures, or multiparameter fitting to analyze samples of gene expression data [4-6]. As pointed out by others, the lack of replicates of individual sequence intensities blocks the most direct route to estimates of variance. However, certain statistical treatments can provide estimates for the means and variances of small numbers of replicates (e.g., 4 in the case of Long et al. [6]) within microarray datasets. However, collection of even a few repeats can be technically impractical or prohibitively expensive. Nevertheless, repetition is the most reliable way to collect statistical information and the strategy described here is intended to supplement, not replace, such replication experiments.
The method of microarray data analysis presented here is platform-independent and can be used to explore data quality and to estimate variances. The calculated variances provide a statistical basis for interpreting significance of intensity differences. The relationship between intensity values (S) and σS2 is discerned using an averaging procedure that groups sets of points of related intensities to estimate σΔS2, and hence, σS2. The use of all data together to fit a function argues for a high degree of robustness in the procedure that should resist fluctuations in the intensity measurements caused by noise. Furthermore, local averaging of intensity differences and calculation of σS2 coupled with a global data fit provides the most reliable estimates for σS2 as a function of signal, assuming that variance is mainly a result of signal intensity and is not otherwise sequence-specific. The general smoothness of the plots supports this view. Within a given platform, the σ2 plots have similar general shapes that can be fitted well by low order polynomials. Higher order polynomials yield better R2 values, but are probably not justified due to the noise in the data. A general function is desired, not one that fits the idiosyncratic noise in a specific pairwise comparison. Despite its presumed robustness, the difference-averaging method is expected to perform better with higher quality data as input.
The estimators derived from this type of analysis can be used to evaluate the significance of intensity differences in non-control datasets, because they relate the magnitude of the intensity value, S, reported in the data file to the standard deviation of an intensity distribution with μ = S (Fig. 7). For example, a given pair of signals corresponding to measurements for one sequence (e.g., a gene) can be compared statistically by computing the variance for each signal using the function derived from the fitted data (e.g., a cubic polynomial in Fig. 5). The variance of the difference (S1-S2) is simply σ12 + σ22. The observation that distributions of intensity differences were approximately Gaussian in form suggests that z values may provide reliable estimates for p values. Only two replicates are required. In the case of two-dye experimental platforms such as Incyte, inter-chip variances can be estimated in the manner shown here. Intra-chip variances can be estimated in a similar way, using two dyes on a single chip. The inter-chip estimators for σ2 provide a conservative statistical measure of significance if applied to inter-chip experiments and provide a justification for determining significance of differences in merged datasets. Due to its simplicity, the approach does not require a sophisticated understanding of statistical principles. Furthermore, the entire analytical procedure can be performed inside a spreadsheet application such as Microsoft Excel.
The two microarray platforms tested here use different types of sequence on the chip. Affymetrix employs sets of oligonucleotides to interrogate a specific RNA. Incyte uses a single spotted DNA of substantially greater length. In contrast to Incyte data, the final intensity measurement in the Affymetrix case is a function of individual intensities derived from the oligonucleotides. The data from Affymetrix chips were, at least superficially, well behaved. The data from both platforms, especially Incyte's, appear to include noise other than the counting statistics type. The scatter does not scale with σ2. This behavior was not restricted to the dataset that was the principal subject of the present study; all other Incyte datasets analyzed, including those with a much smoother appearance, displayed similar dependence (not shown). Such noise may originate from variability in the spotting or detection.
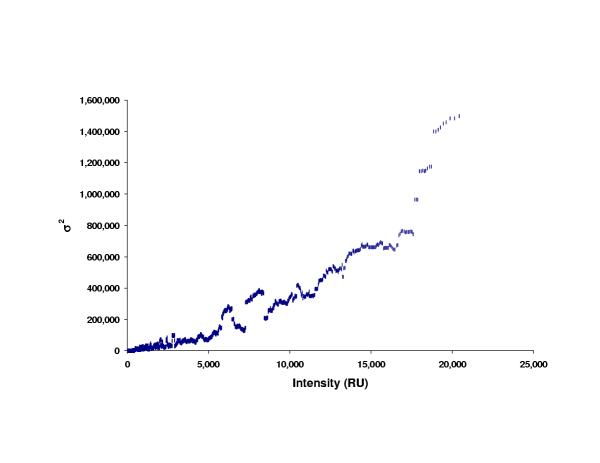
There are some peculiarities in both datasets regarding the fine structure of the S vs. σS2 plots (Figs. 5, 6). In particular, there are positions where sudden discontinuities arise. The explanation for some of these jumps may involve outliers; i.e., single poorly measured array points. However, in many cases the jumps were inconsistent with one or two aberrant measurements that might produce spikes in the averaged data. Rather, the jumps resulted from a stable change in intensity vs. σS2, causing an abrupt transition to a new level, discernible as a sudden offset in the scatter plot data. It is noteworthy that plots of S vs. σS2 (as in Figs. 5, 6) do not display the same fine structure features, though they all are of similar general form (see Figs. 8, 9 for another example). For instance, the large jump at intensity ~1750 visible in Fig. 3A was not as dramatic in other Incyte datasets. The origin of these transitions is not clear.
Figure 8.
Scatter plot of average intensities ((S1+S2)/2) vs. variance (σ2) for a second experiment using the Incyte platform with HEK293 mRNA from cells expressing a cadherin protein fragment vs. a Tcf fragment (the same experiment as in Fig. 7 [7,8; Kamb, unpublished]. RU, relative units.
Figure 9.
Scatter plot of average intensities vs. variance (as in Fig. 8) for a second experiment using the Affymetrix platform with mR NA from flies overexpressing a Fos construct vs. flies expressing a Jun construct.
Conclusion
We have presented a simple analytical approach based on differences in signal intensities and averaging for analysis of microarray data which can be performed without advanced statistics or specialized software. This procedure provides insight into the properties of the data under consideration, as well as estimates of variances as a function of signal strength. Application of the method gives statistical support for a more aggressive interpretation of microarray intensity data.
Materials and Methods
RNA samples
RNA for the Affymetrix experiment consisted of poly(A)+ RNA isolated from heads from fruit flies that overexpressed Fos and Jun. RNA for the Incyte platform experiments was poly(A)+ RNA prepared from HEK293 human cells that expressed a mutant (S45Y) β-catenin oncogene [11,12]. Other samples (e.g., head poly(A)+ RNA from fly heads that expressed dominant-negative Fos and Jun molecules; and poly(A)+ RNA from HEK293 cells that expressed either a cadherin or Tcf inhibitor of the β-catenin pathway were also collected and examined [[7,8]; Kamb, unpublished].
Software
All analytical procedures and graphing was performed using Microsoft Excel 2000; no other software packages or custom code was used.
Data analysis
A basic summary of the Affymetrix chip data is provided in Table 2; similar information was not available for Incyte data. Data files were imported into Excel and the companies' internal controls were removed. Intensity differences for pairs of control signals (S1-S2) were calculated, as well as average signals for each pair ((S1+S2)/2). These columns were sorted on average signal in descending order and averaging window sizes were tested. After settling on 100 data points as the window, an averaged (S1+S2)/2 incremented by one point each time was calculated along with σ and σ2 for the corresponding sets of 100 points used in the signal averaging process. Polynomials and lines were fit to plots of avg. (S1+S2)/2 vs. σΔS2/2.
Table 2.
Summary of Affymetrix expression data for the 4 experimental sets
| Data Set | Background | Background | % "P" | Scaling | GAPDH | β-Actin |
| Signal | Noise | Factor | 3'/ 5' | 3'/ 5' | ||
| FosJun1 | 359 | 8.4 | 13 | 157 | 3.5 | 8.1 |
| FosJun2 | 332 | 6.9 | 11 | 198 | 5.1 | 15.0 |
| Fos | 367 | 5.9 | 13 | 148 | 4.1 | 15.3 |
| Jun | 392 | 6.5 | 22 | 48 | 3.2 | 36 |
Summary of Affymetrix expression data for the 4 experimental sets analyzed (see Methods for description of RNA samples). "P" refers to the percent of genes that were scored as "positive" by the Affymetrix scoring system. The global scaling factor was selected to reach an average target intensity of 2500 for each data set. The GAPDH and β-actin 3'5/5' values indicate the ratio of signal intesities obtained with probes corresponding to the 3' and 5' ends of the gene.
Acknowledgments
Acknowledgements
We are grateful to P. Etter for help with the Affymetrix experiments and Dr. M. Pierce for preparing RNA for the Incyte experiments. This work was supported in part by grant #1RO1 DA 13337-01.
Contributor Information
Alexander Kamb, Email: kamb@arcaris.com.
Mani Ramaswami, Email: mani@u.arizona.edu.
References
- Brown PO, Botstein D. Exploring the new world of the genome with DNA microarrays. Nat Genet. 1999;21:33–37. doi: 10.1038/4462. [DOI] [PubMed] [Google Scholar]
- Lipshutz RJ, Fodor SP, Gingeras TR, Lockhart DJ. High density synthetic oligonucleotide arrays. Nat Genet. 1999;21:20–24. doi: 10.1038/4447. [DOI] [PubMed] [Google Scholar]
- He YD, Friend SH. Microarrays-the 21st century divining rod? Nat Med. 2001;7:658–659. doi: 10.1038/89022. [DOI] [PubMed] [Google Scholar]
- Ideker T, Thorsson V, Siegel AF, Hood LE. Testing for differentially-expressed genes by maximum-likelihood analysis of microarray data. J Comput Biol. 2000;7:805–817. doi: 10.1089/10665270050514945. [DOI] [PubMed] [Google Scholar]
- Kerr MK, Martin M, Churchill GA. Analysis of variance for gene expression microarray data. J Comput Biol. 2000;7:819–837. doi: 10.1089/10665270050514954. [DOI] [PubMed] [Google Scholar]
- Long AD, Mangalam HJ, Chan BY, Tolleri L, Hatfield GW, Baldi P. Improved statistical inference from dna microarray data using analysis of variance and a Bayesian statistical framework. Analysis of gene expression in Escherichia coli K12. J Biol Chem. 2001;276:19937–19944. doi: 10.1074/jbc.M010192200. [DOI] [PubMed] [Google Scholar]
- Behrens J, von Kries JP, Kuhl M, Bruhn L, Wedlich D, Grosschedl R, Birchmeier W. Functional interaction of beta-catenin with the transcription factor LEF-1. Nature. 1996;382:638–42. doi: 10.1038/382638a0. [DOI] [PubMed] [Google Scholar]
- Sadot E, Simcha I, Shtutman M, Ben-Ze'ev A, Geiger B. Inhibition of beta-catenin-mediated transactivation by cadherin derivatives. Proc Natl Acad Sci U S A. 1998;95:15339–15344. doi: 10.1073/pnas.95.26.15339. [DOI] [PMC free article] [PubMed] [Google Scholar]
- Tetsu O, McCormick F. Beta-catenin regulates expression of cyclin D1 in colon carcinoma cells. Nature. 1999;398:422–426. doi: 10.1038/18884. [DOI] [PubMed] [Google Scholar]
- Ferrell JE, Jr, Machleder EM. The biochemical basis of an all-or-none cell fate switch in Xenopus oocytes. Science. 1998;280:895–898. doi: 10.1126/science.280.5365.895. [DOI] [PubMed] [Google Scholar]
- Baeg GH, Matsumine A, Kuroda T, Bhattacharjee RN, Miyashiro I, Toyoshima K, Akiyama T. The tumour suppressor gene product APC blocks cell cycle progression from G0/G1 to S phase. EMBO J. 1995;14:5618–5625. doi: 10.1002/j.1460-2075.1995.tb00249.x. [DOI] [PMC free article] [PubMed] [Google Scholar]
- Munemitsu S, Albert I, Souza B, Rubinfeld B, Polakis P. Regulation of intracellular beta-catenin levels by the adenomatous polyposis coli (APC) tumor-suppressor protein. Proc Natl Acad Sci U S A. 1995;92:3046–3050. doi: 10.1073/pnas.92.7.3046. [DOI] [PMC free article] [PubMed] [Google Scholar]


