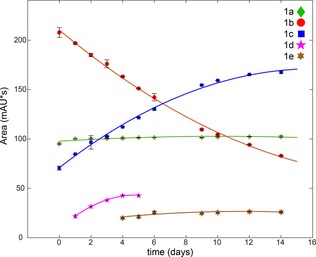
Figure 8.

Evolution of HPLC peak areas of the photoproducts (1a–1e) after 420 nm irradiation of 1 (50 μm) and 5′‐GMP (1:2) for 30 min. Mean integrated peak areas of three measurements are shown for each photoproduct, trend lines were fitted using a 2nd order polynomial fit and standard deviations are depicted as error bars (black).
