Little is known about the benefits of using the Chemotherapy Toxicity Risk Score (CTRS) for treatment decisions in older adults with advanced cancer. This prospective observational study of older adults with advanced solid tumors receiving first‐line chemotherapy was conducted to assess the potential utility of the CTRS in clinical practice.
Keywords: Chemotherapy toxicity, Geriatric assessment, Older adults with cancer, Prospective observational study, Treatment decision
Abstract
Background.
The decision whether to treat older adults with advanced cancer with standard therapy (ST) or reduced therapy (RT) is complicated by heterogeneity in aging. We assessed the potential utility of the chemotherapy toxicity risk score (CTRS) [J Clin Oncol 2011;29:3457–3465] for treatment decisions in older adults.
Materials and Methods.
This was a prospective observational study of patients aged ≥65 years receiving first‐line chemotherapy for advanced cancer for which combination chemotherapy is the standard of care. Patients were categorized as high risk (CTRS ≥10), for whom RT (dose‐reduced combination or single‐agent chemotherapy) is deemed appropriate, or nonhigh risk (CTRS <10), for whom ST is deemed appropriate for toxicity. The primary objective was to estimate the agreement in chemotherapy choice (ST vs. RT) between the treating physician and the CTRS using a κ statistic.
Results.
Fifty‐eight patients (median age, 71 years) were enrolled. Thirty‐eight patients received ST (21 had CTRS <10, and 17 had CTRS ≥10), and 20 patients received RT (12 had CTRS ≥10, and 8 had CTRS <10), with minimal agreement in chemotherapy choice (κ = 0.14; 95% CI, −0.10 to 0.38). Grade 3–4 toxicity and hospitalization occurred in 60% and 27% of 55 patients with follow‐up data, respectively. Among patients receiving ST, patients with CTRS ≥10 had a higher incidence of toxicity (88% vs. 40%, p = .006) and hospitalization (50% vs. 15%, p = .03) than those with CTRS <10.
Conclusion.
Older patients with cancer with a high CTRS who receive combination chemotherapy have an exceedingly high rate of severe toxicity and hospitalization.
Implications for Practice.
The potential utility of the chemotherapy toxicity risk score (CTRS) in old adults with advanced solid tumors receiving first‐line chemotherapy was assessed. Little agreement was found between chemotherapy treatment decisions based on the clinical impression versus what was recommended based on the CTRS. Among patients treated with standard‐dose combination chemotherapy, patients with CTRS ≥10 had a very high incidence of grade 3–4 toxicities and hospitalization, which was significantly greater than that of patients with a low CTRS (<10). These findings suggest that the addition of CTRS to the clinical impression has a potential to improve treatment decisions.
Introduction
Combination chemotherapy is the standard of care for first‐line therapy for a wide variety of locally advanced and metastatic cancers. Prior research has shown that the survival of fit older adults with advanced cancers is improved by treatment with standard‐of‐care chemotherapy regimens [1], [2], [3]. However, the use of combination chemotherapy in unfit older patients carries a high risk of severe toxicities and complications, and dose‐reduced combinations or single‐agent chemotherapy may be a better alternative for these patients [4]. Currently, the subjective clinical impression of the prescribing clinician is used to determine whether an older patient is fit or unfit for standard chemotherapy. One alternative to the clinical impression is the use of geriatric assessment (GA) to guide treatment decisions [5], [6]. GA is an excellent tool for detecting often‐missed impairments in older patients with cancer [7], [8], [9].
GA deficits associated with grade 3–5 chemotherapy toxicity have been identified and developed into a predictive scoring system by Hurria et al. in a prospective study of 500 patients with cancer aged ≥65 years [10]. This chemotherapy toxicity risk score (CTRS) comprises five key GA variables, laboratory test values, age, tumor type, and treatment characteristics, and divides patients into three categories for chemotherapy toxicity, defined as percent incidence of toxicities: low risk (0 to 5 points; 30% grade 3–5 toxicity), medium risk (6 to 9 points; 52%), or high risk (10 to 19 points; 83%). The CTRS was recently externally validated in an independent cohort of 250 older adults with cancer [11].
Little is known about the benefits of using the CTRS for treatment decisions in older adults with advanced cancer. An important decision is whether standard therapy (ST; e.g., standard‐dose combination chemotherapy) or reduced therapy (RT; e.g., dose‐reduced combination or single‐agent chemotherapy) should be used as a first‐line therapy for patients with varying CTRS scores. We conducted a prospective observational study of older adults with advanced solid tumors receiving first‐line chemotherapy in order to assess the potential utility of the CTRS in clinical practice. We estimated the level of treatment decision (ST vs. RT) agreement between the clinical impression and CTRS and compared toxicity outcomes between concordant and discordant decisions.
Materials and Methods
Patients
Patients were eligible for inclusion in the study if they were 65 years of age or older and were scheduled to receive first‐line chemotherapy for unresectable, locally advanced or metastatic solid tumors. We included cancer types for which combination chemotherapy is the standard first‐line therapy and single‐agent chemotherapy is an alternative (i.e., biliary tract, colorectal, esophageal, gastric, pancreatic, bladder, lung, head and neck cancers). Patients with prior chemotherapy for earlier‐stage disease could be included, provided treatment was completed ≥3 months prior to enrolling in our study. Eligibility was restricted to patients able to speak and read English. Patients receiving concurrent radiation and those receiving treatment as part of a clinical trial were excluded. Between September 2015 and February 2017, 60 patients were recruited from the North Carolina Cancer Hospital (NCCH) at the University of North Carolina. Patients provided written informed consent, and the study was approved by the institutional review board.
Study Design
Prior to the initiation of chemotherapy, study participants completed the GA questions included in the CTRS (about hearing, falls in the last 6 months, ability to take medications unassisted, ability to walk one block, and social activity) [10]. In addition, we recorded baseline sociodemographic data, tumor characteristics, pretreatment laboratory data (complete blood count, creatinine, and liver function tests), chemotherapy regimen, reasons for the choice of regimen, and the use of white blood cell growth factors (primary and secondary prophylaxis). Decisions regarding chemotherapy regimen and dose were left to the clinical judgment of the treating oncologist, who was blinded to the results of the CTRS. Chemotherapy intensity for the first cycle of treatment was categorized as standard or reduced therapy per National Comprehensive Cancer Network (NCCN) guidelines [12]. ST was defined as combination chemotherapy at standard dose, that is, the dose recommended for a given regimen in the NCCN guidelines. RT was defined as combination chemotherapy at reduced dose, that is, lower than the recommended dose for at least one of the agents or single‐agent chemotherapy at a standard or reduced dose. Grade 3–5 chemotherapy‐related adverse events during first‐line chemotherapy were as defined by the National Cancer Institute Common Terminology Criteria for Adverse Events, version 4.0, and were captured through medical records review [13]. Laboratory‐based toxicities were identified based on laboratory values on the date of scheduled chemotherapy or at the time the patient sought medical care for symptoms between cycles of chemotherapy. We also captured hospitalizations due to chemotherapy toxicity.
Study Objectives
The primary objective of our study was to estimate the agreement in chemotherapy treatment decisions (ST vs. RT) between the clinical impression and the CTRS. The clinical impression treatment decision was the actual treatment that the patient received. The treatment decision was made by the treating oncologist, who was blinded to the results of the CTRS. The CTRS treatment decision was based on the CTRS calculated at baseline, assuming a patient would receive combination therapy at the standard dose. If the patient's CTRS suggested that the patient would be at high risk for toxicities under standard therapy (CTRS ≥10; ≥80% risk for grade 3–5 toxicity [10]), then we classified the patient's CTRS decision as recommending reduced therapy. If the CTRS suggested a patient was at low or medium risk for chemotherapy toxicity (CTRS <10; <50% risk for grade 3–5 toxicity [10]), then we classified the patient's CTRS decision as standard therapy. We thought that more than 30% increase in the risk of grade 3–5 toxicities between the high risk and nonhigh risk groups was clinically meaningful and that reduced therapy was a reasonable treatment decision for the high‐risk patients.
The secondary objective was to evaluate the association between the CTRS based on actual treatment that the patient received and the occurrence of grade 3–5 toxicity and hospitalization due to toxicity during first‐line chemotherapy treatment, as well as to investigate factors involved in treatment decision‐making (ST vs. RT).
Statistical Analysis
For the primary objective, we used a κ statistic with a 95% confidence interval (CI) to estimate agreement between the clinical impression and the CTRS. As we enrolled only patients receiving first‐line chemotherapy and our cohort was enriched for gastrointestinal (GI) and genitourinary cancers categorized as high risk in the CTRS (2 points), we anticipated that about 50% of patients in our study would have a CTRS score ≥10 (compared with 23% in the Hurria et al. study [10]). With a sample size of 60 patients, we expected acceptable precision of the effect size with the half‐widths of 95% CIs for the κ ranging from 0.2 to 0.25.
For the secondary objective, Fisher's exact test was used to evaluate the difference in incidences of grade 3–5 toxicity and hospitalization due to chemotherapy toxicity between groups. We assessed the validity of the CTRS by composing receiver operating characteristic (ROC) curves and calculating the area under the curve (AUC). Factors involved in treatment decision‐making were compared between ST and RT groups using two‐sample t test for continuous variables and Fisher's exact test for categorical variables. A p value of <.05 was considered significant for all analyses. Analyses were performed using Stata 14 software (StataCorp LP, College Station, TX).
Results
Patient Characteristics
The study population consisted of 58 patients aged ≥65 years diagnosed with advanced solid tumors (supplemental online Fig. 1). The median age was 71 years (range 65–89 years), and 62% of patients were male. The most common type of cancer was GI (64%). Most patients had physician‐rated Karnofsky performance status (KPS) of 80 or greater (76%), with a range of 50–100 (Table 1).
Table 1. Patient characteristics (n = 58).
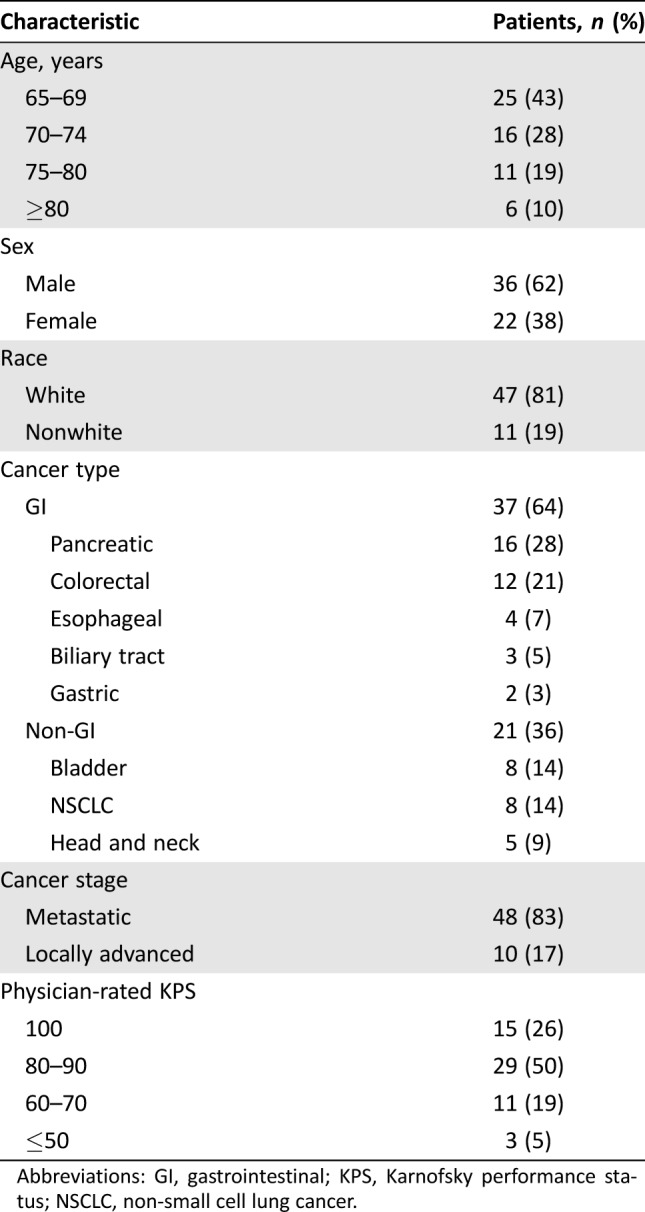
Abbreviations: GI, gastrointestinal; KPS, Karnofsky performance status; NSCLC, non‐small cell lung cancer.
Agreement in Treatment Decisions Between Clinical Impression and CTRS
Of 58 evaluable patients, 38 (66%) received ST and 20 (34%) received RT. The number of patients with each scoring variable used in the CTRS is presented in Table 2. Twenty‐nine patients (50%) had a CTRS ≥10, based on the assumption that combination chemotherapy at the standard dose would be used. The distribution of patients is shown in a 2 × 2 table (Table 3). Overall, the κ statistic was 0.14 (95% CI, −0.10 to 0.38), which suggests only slight agreement in chemotherapy choice between the clinical impression and the CTRS according to the guidelines of Landis and Koch [14]. In particular, there was less agreement between the CTRS and the actual treatment given in patients with CTRS ≥10 (of 29 patients, only 12 [41%] received RT) than those with CTRS <10 (of 29 patients, 21 [72%] received ST).
Table 2. Results of the chemotherapy toxicity risk score.
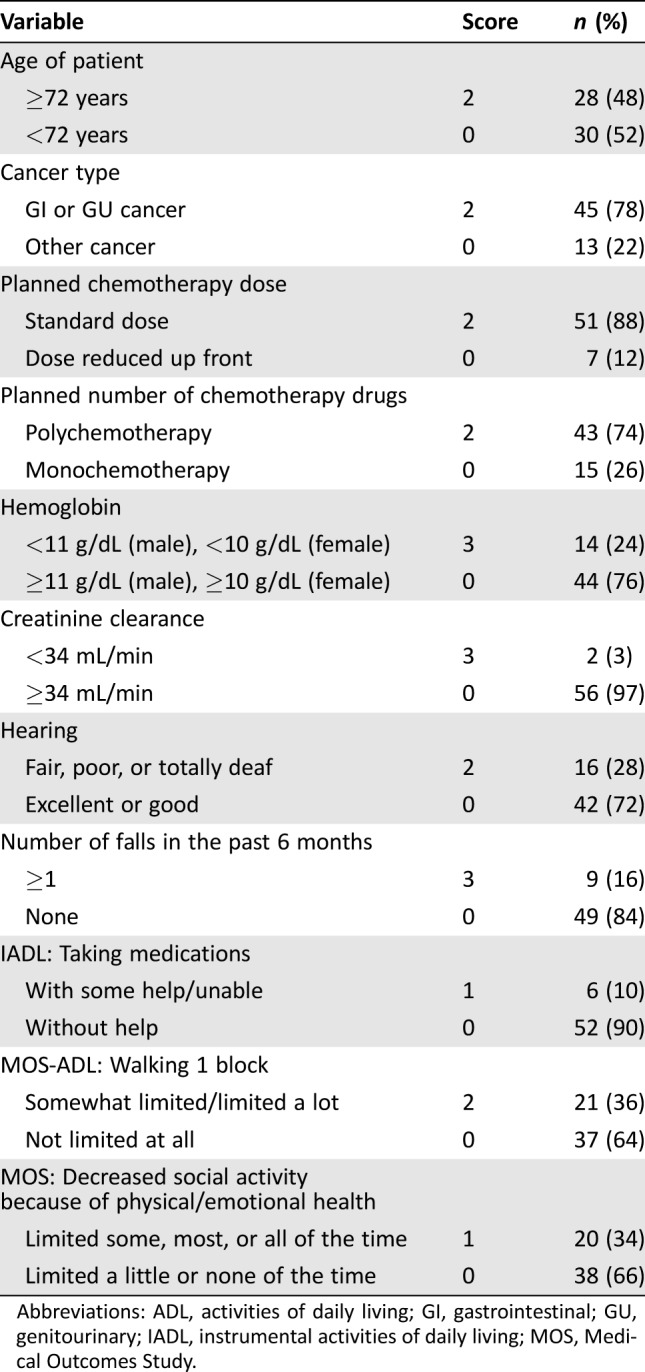
Abbreviations: ADL, activities of daily living; GI, gastrointestinal; GU, genitourinary; IADL, instrumental activities of daily living; MOS, Medical Outcomes Study.
Table 3. Agreement in treatment decisions between clinical impression and the CTRS.
Red indicates agreement in treatment decision between the clinical impression and the CTRS; italic indicates disagreement.
Abbreviation: CTRS, chemotherapy toxicity risk score.
Chemotherapy Toxicity
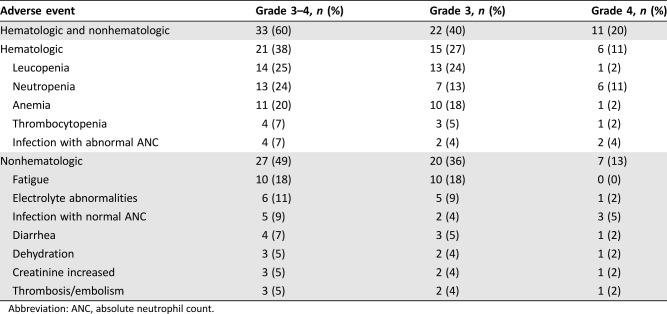
Follow‐up toxicity data were available for 55 patients; 3 patients had only an initial consultation at the NCCH and then received chemotherapy elsewhere. At least one grade 3–4 toxicity occurred in 60% of the 55 patients (40% grade 3 and 20% grade 4), and 27% were hospitalized because of treatment toxicity (Table 4). There was no grade 5 toxicity. The first grade 3 or 4 adverse event occurred most frequently during the first cycle of chemotherapy, with the median time to the first event being 21 days for hematologic and 26 days for nonhematologic toxicity. Primary prophylaxis with white blood cell growth factors was not used in any patients, but secondary prophylaxis was given to five patients.
Table 4. Treatment‐related adverse events.
Abbreviation: ANC, absolute neutrophil count.
Comparison of Toxicity Outcomes Between Concordant and Discordant Treatment Decisions
Of 55 patients with follow‐up toxicity data, 36 (65%) received ST and 19 (35%) received RT. Among the patients treated with ST, patients with CTRS ≥10 had a significantly higher incidence of grade 3–4 toxicities (88% vs. 40%, p = .006) and hospitalization (50% vs. 15%, p = .03) compared with those with the CTRS <10 (Table 5). In the RT group, there was no significant difference in incidence of grade 3–4 toxicities or hospitalization between patients with CTRS ≥10 versus CTRS <10.
Table 5. Comparison of toxicity outcomes between concordant and discordant treatment decisions.
The bold‐italic values show statistically significant differences (p < .05).
Abbreviations: AEs, adverse events; Gr, grade.
Validation of the CTRS
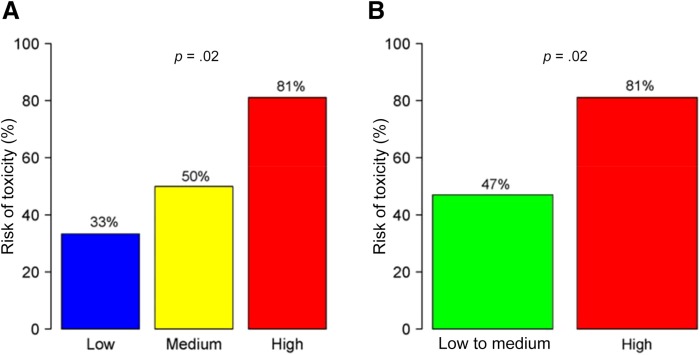
The median CTRS score based on actual treatment received was 8 (range 0–19) in the cohort with follow‐up toxicity data (n = 55). This cohort was divided into three risk categories: low risk (0 to 5 points, 11% of patients), medium risk (6 to 9 points, 51%), and high risk (10 to 19 points, 38%). There was a statistically significant increase in toxicity risk with increasing risk score (33% in the low risk group, 50% in the medium risk group, and 81% in the high‐risk group; p = .02; Fig. 1). The area under the ROC curve for the CTRS was 0.71.
Figure 1.
Ability of the chemotherapy toxicity risk score (CTRS) to predict chemotherapy toxicity. (A): Three CTRS categories, low (0 to 5 points), medium (6 to 9 points), or high risk (10 to 19 points), versus toxicity risk. (B): Two CTRS categories, low and medium risk combined (0 to 9 points) or high risk (10 to 19 points), versus toxicity risk.
As the sample for the low‐risk group was small (n = 6), we combined the low‐ and medium‐risk groups for further analyses. There was a significant difference in toxicity between the high‐risk and low‐ and medium‐risk groups (81% vs. 47%, p = .02; Fig. 1). Additionally, the incidence of hospitalization due to toxicity was significantly greater in the high‐risk group compared with the low‐ and medium‐risk group (48% vs. 18%, p = .03).
Factors Involved in Treatment Decision‐Making
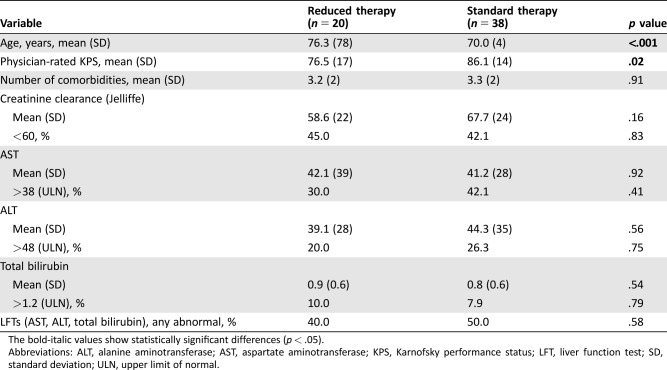
We identified factors that affected the treatment decision‐making (ST vs. RT) by reviewing medical records. We only considered factors that were clearly documented as reasons for the treatment decision. Among 20 patients who received RT, we identified at least one decision‐making factor for all patients. Advanced age (35%) and poor performance status (30%) were the most common factors affecting the physician's treatment recommendation. Other factors noted in the medical records were comorbidities (10%) and abnormal liver function tests (10%). There were two patients who decided to receive RT, although ST had been recommended by the treating oncologist. In the ST group (n = 38), we could not identify any comments about reasons for the choice of therapy in 61% of patients. Good performance status was the most frequent reason for a recommendation of ST (37%). One patient chose to receive ST despite the treating oncologist's recommendation of RT.
Based on these findings, we evaluated the association between these identified factors and the clinicians’ treatment decisions. In comparison with patients treated with ST, patients treated with RT were older (mean age, 76 vs. 70 years, p < .001) and had a lower physician‐rated KPS (mean, 77 vs. 86, p = .02; Table 6).
Table 6. Association between clinical factors and treatment decisions.
The bold‐italic values show statistically significant differences (p < .05).
Abbreviations: ALT, alanine aminotransferase; AST, aspartate aminotransferase; KPS, Karnofsky performance status; LFT, liver function test; SD, standard deviation; ULN, upper limit of normal.
Discussion
The CTRS is a well‐validated predictor of toxicity in older patients receiving chemotherapy for solid tumors. In this prospective study of older adults with solid tumors initiating chemotherapy for incurable disease, we found little agreement in chemotherapy treatment decisions based on clinical impression versus what was recommended based on the CTRS. Chemotherapy toxicity was high in older patients receiving first‐line chemotherapy for advanced solid tumors, with more than half of our patients experiencing grade 3–4 toxicity, and similar findings have been noted in previous studies [10], [11], [15]. Among patients treated with standard‐dose combination chemotherapy, patients with CTRS ≥10 had a very high incidence of grade 3–4 toxicities and hospitalization, which was significantly greater than patients with a low CTRS (<10). We also found that clinical impression decisions were based largely on the patient's chronological age and performance status.
Among patients determined fit to receive ST by their treating oncologist, the CTRS identified patients at higher risk for chemotherapy toxicity. This may be explained by our finding that age and performance status were the two main factors involved in subjective clinician decisions. Although age is one of variables in the CTRS, performance status has not been shown to be predictive of chemotherapy toxicity in previous studies [10], [11]. This suggests that performance status is not sufficiently sensitive to identify the vulnerabilities that place older patients at risk of treatment‐related toxicity. Our research team has previously shown that GA‐identified deficits are prevalent even in older patients with cancer with KPS ≥80 (n = 796) [8]. In that study, 69% of patients were found to have at least one GA deficit (28% had one deficit, 18% had two deficits, and 24% had at least three deficits). In addition, Wedding et al. reported that physicians’ subjective judgment of patients as fit, vulnerable, or frail with regard to chemotherapy were not sufficiently sensitive to detect deficits in GA or identify vulnerable or frail patients based on GA [9]. By comparison, the CTRS, consisting of 11 variables that include key GA questions, is a more objective tool and has a greater ability to discriminate toxicity risk in older adults with cancer.
In this study, the CTRS predicted high‐grade toxicities in older adults with cancer receiving first‐line chemotherapy for advanced solid tumors. The AUC of the ROC curve for the CTRS in our cohort was 0.71. Cohorts in the studies by Hurria et al. were more heterogeneous, consisting of patients with different intents of treatment (palliative vs. curative) and lines of therapy (first vs. second or later) [10], [11]. Despite these differences in cohort characteristics, our results were similar to those derived from the Hurria et al. development (AUC = 0.72) and validation (AUC = 0.65) cohorts. Additionally, Nie et al. reported a significant association between CTRS and grade 3–5 toxicity in a retrospective study of 120 older adults with lung cancer in Chinese population [16]. Alibhai et al. conducted a prospective study in Canada to evaluate the predictive ability of the CTRS in 46 older adults receiving first‐ or second‐line chemotherapy for metastatic prostate cancer [17]. Although the results were not statistically significant, Alibhai et al. observed an incremental risk of toxicity based on the CTRS risk group. These studies provide further evidence of external validation of the CTRS.
There are limitations to our study. First, the sample size for this study was relatively small, and we could not perform a subgroup analysis by tumor type or an evaluation of efficacy outcomes. Second, we enrolled only patients who were able to speak and read English, and a large proportion of patients in our sample were non‐Hispanic white. Third, this study was conducted in a single academic cancer center (NCCH) in the U.S. Fourth, our cohort was enriched for GI cancers. These factors may limit the generalizability of our results to the general population of patients with cancer. Finally, we used a cutoff of 10 to define the high‐risk group (CTRS ≥10; ≥80% risk for grade 3–5 toxicity [10]), but an ideal CTRS cutoff for treatment decision should be further explored.
Conclusion
The treatment of older adults with cancer is complicated by the heterogeneous aging process. Although patients aged 65 and older with cancer represent the fastest growing segment of the cancer population [18], [19], a major gap in knowledge exists regarding the optimal management of advanced cancer in these patients [20], including how to determine if a patient is fit or unfit to receive standard‐of‐care chemotherapy [21]. The CTRS is a well‐designed decision support tool to predict chemotherapy toxicity in patients with cancer aged ≥65 years [10], [11]. An online risk calculator is available at http://www.mycarg.org/Chemo_Toxicity_Calculator. However, to date, this tool has not yet been evaluated as a way to improve patient outcomes. Our study presents the first steps in assessing the value of the CTRS in clinical practice, and our findings provide the basis for further studies to validate its clinical utility. Specifically, our finding of overall low agreement in treatment decisions between subjective clinician opinion and CTRS‐based decision, as well as the high incidence of toxicity in the patients with a discordant decision between the two approaches, suggests that the addition of CTRS to clinical impression has a potential to improve treatment decisions. The next step is to test the hypothesis that treatment decisions based on a combination of clinical impression and CTRS will lower the rate of treatment‐related toxicities compared with treatment decisions based on clinical impression alone. As quality of life, functional status, and survival are also important outcomes for older adults with cancer, further studies are warranted to evaluate how incorporation of the CTRS in treatment decisions affects these outcomes.
See http://www.TheOncologist.com for supplemental material available online.
Supplementary Material
Acknowledgments
This work was presented as a poster at the American Society of Clinical Oncology Annual Meeting, June 2–6, 2017. Work on this study was supported by the University of North Carolina Lineberger Comprehensive Cancer Center with funding provided by the University Cancer Research Fund of the State of North Carolina.
Author Contributions
Conception/design: Tomohiro F. Nishijima, Allison M. Deal, Kirsten A. Nyrop, Hyman B. Muss
Collection and/or assembly of data: Tomohiro F. Nishijima, Allison M. Deal
Data analysis and interpretation: Tomohiro F. Nishijima, Allison M. Deal, Grant R. Williams, Hanna K. Sanoff, Kirsten A. Nyrop, Hyman B. Muss
Manuscript writing: Tomohiro F. Nishijima
Final approval of manuscript: Tomohiro F. Nishijima, Allison M. Deal, Grant R. Williams, Hanna K. Sanoff, Kirsten A. Nyrop, Hyman B. Muss
Study supervision: Kirsten A. Nyrop, Hyman B. Muss
Disclosures
Hanna K. Sanoff: Bayer, Merck, Precision Biologics (RF). The other authors indicated no financial relationships.
(C/A) Consulting/advisory relationship; (RF) Research funding; (E) Employment; (ET) Expert testimony; (H) Honoraria received; (OI) Ownership interests; (IP) Intellectual property rights/inventor/patent holder; (SAB) Scientific advisory board
References
- 1. Folprecht G, Seymour MT, Saltz L et al. Irinotecan/fluorouracil combination in first‐line therapy of older and younger patients with metastatic colorectal cancer: Combined analysis of 2,691 patients in randomized controlled trials. J Clin Oncol 2008;26:1443–1451. [DOI] [PubMed] [Google Scholar]
- 2. Goldberg RM, Tabah‐Fisch I, Bleiberg H et al. Pooled analysis of safety and efficacy of oxaliplatin plus fluorouracil/leucovorin administered bimonthly in elderly patients with colorectal cancer. J Clin Oncol 2006;24:4085–4091. [DOI] [PubMed] [Google Scholar]
- 3. Quoix E, Zalcman G, Oster JP et al. Carboplatin and weekly paclitaxel doublet chemotherapy compared with monotherapy in elderly patients with advanced non‐small‐cell lung cancer: IFCT‐0501 randomised, phase 3 trial. Lancet 2011;378:1079–1088. [DOI] [PubMed] [Google Scholar]
- 4. Gajra A, Klepin HD, Feng T et al. Predictors of chemotherapy dose reduction at first cycle in patients age 65 years and older with solid tumors. J Geriatr Oncol 2015;6:133–140. [DOI] [PMC free article] [PubMed] [Google Scholar]
- 5. Wildiers H, Heeren P, Puts M et al. International Society of Geriatric Oncology consensus on geriatric assessment in older patients with cancer. J Clin Oncol 2014;32:2595–2603. [DOI] [PMC free article] [PubMed] [Google Scholar]
- 6. Hurria A, Gupta S, Zauderer M et al. Developing a cancer‐specific geriatric assessment: A feasibility study. Cancer 2005;104:1998–2005. [DOI] [PubMed] [Google Scholar]
- 7. Repetto L, Fratino L, Audisio RA et al. Comprehensive geriatric assessment adds information to Eastern Cooperative Oncology Group performance status in elderly cancer patients: An Italian Group for Geriatric Oncology study. J Clin Oncol 2002;20:494–502. [DOI] [PubMed] [Google Scholar]
- 8. Jolly TA, Deal AM, Nyrop KA et al. Geriatric assessment‐identified deficits in older cancer patients with normal performance status. The Oncologist 2015;20:379–385. [DOI] [PMC free article] [PubMed] [Google Scholar]
- 9. Wedding U, Ködding D, Pientka L et al. Physicians’ judgement and comprehensive geriatric assessment (CGA) select different patients as fit for chemotherapy. Crit Rev Oncol Hematol 2007;64:1–9. [DOI] [PubMed] [Google Scholar]
- 10. Hurria A, Togawa K, Mohile SG et al. Predicting chemotherapy toxicity in older adults with cancer: A prospective multicenter study. J Clin Oncol 2011;29:3457–3465. [DOI] [PMC free article] [PubMed] [Google Scholar]
- 11. Hurria A, Mohile S, Gajra A et al. Validation of a prediction tool for chemotherapy toxicity in older adults with cancer. J Clin Oncol 2016;34:2366–2371. [DOI] [PMC free article] [PubMed] [Google Scholar]
- 12.National Comprehensive Cancer Network. NCCN Clinical Practice Guidelines in Oncology. 2016. Available at http://www.nccn.org/professionals/physician_gls/f_guidelines.asp. Accessed May 30, 2017.
- 13.National Cancer Institute , National Institutes of Health, U.S. Department of Health and Human Services. Common Terminology Criteria for Adverse Events Version 4.0. 2010. Available at https://ctep.cancer.gov/protocoldevelopment/electronic_applications/ctc.htm#ctc_40. Accessed May 30, 2017.
- 14. Landis JR, Koch GG. The measurement of observer agreement for categorical data. Biometrics 1977;33:159–174. [PubMed] [Google Scholar]
- 15. Extermann M, Boler I, Reich RR et al. Predicting the risk of chemotherapy toxicity in older patients: The Chemotherapy Risk Assessment Scale for High‐Age Patients (CRASH) score. Cancer 2012;118:3377–3386. [DOI] [PubMed] [Google Scholar]
- 16. Nie X, Liu D, Li Q et al. Predicting chemotherapy toxicity in older adults with lung cancer. J Geriatr Oncol 2013;4:334–339. [DOI] [PubMed] [Google Scholar]
- 17. Alibhai SM, Aziz S, Manokumar T et al. A comparison of the CARG tool, the VES‐13, and oncologist judgment in predicting grade 3+ toxicities in men undergoing chemotherapy for metastatic prostate cancer. J Geriatr Oncol 2017;8:31–36. [DOI] [PubMed] [Google Scholar]
- 18. Smith BD, Smith GL, Hurria A et al. Future of cancer incidence in the United States: Burdens upon an aging, changing nation. J Clin Oncol 2009;27:2758–2765. [DOI] [PubMed] [Google Scholar]
- 19. Siegel RL, Miller KD, Jemal A. Cancer statistics, 2017. CA Cancer J Clin 2017;67:7–30. [DOI] [PubMed] [Google Scholar]
- 20. Hurria A, Levit LA, Dale W et al. Improving the evidence base for treating older adults with cancer: American Society of Clinical Oncology statement. J Clin Oncol 2015;33:3826–3833. [DOI] [PubMed] [Google Scholar]
- 21. Corre R, Greillier L, Le Caër H et al. Use of a comprehensive geriatric assessment for the management of elderly patients with advanced non‐small‐cell lung cancer: The phase III randomized ESOGIA‐GFPC‐GECP 08‐02 study. J Clin Oncol 2016;34:1476–1483. [DOI] [PubMed] [Google Scholar]
Associated Data
This section collects any data citations, data availability statements, or supplementary materials included in this article.


