Abstract
CORT125134 is an orally active, high‐affinity, selective antagonist of the glucocorticoid receptor that is being developed for indications that may benefit from the modulation of cortisol activity. This first‐in‐human study was conducted to evaluate the dose‐related safety, tolerability, pharmacokinetics and pharmacological effects of CORT125134 and its active metabolite CORT125201. Eighty‐one healthy male or female subjects received a single dose of 5 to 500 mg CORT125134 or matching placebo across 9 cohorts; 1 cohort received 150 mg CORT125134 after a high‐fat breakfast; and 46 subjects received 50 to 500 mg CORT125134 or matching placebo once daily for up to 14 days across 4 cohorts. CORT125134 was well tolerated at doses up to 250 mg per day for 14 days. CORT125134 was absorbed rapidly and eliminated with a mean half‐life ranging from 11 to 19 hours. Steady state was achieved by day 7. Exposure increased in a greater than proportional manner, particularly at lower doses. Exposure to CORT125201 at steady state was less than 5% that of parent CORT125134. Evidence for the desired pharmacological effect (glucocorticoid receptor antagonism) was demonstrated by the ability of CORT125134 to prevent several effects of the glucocorticoid receptor agonist prednisone.
Keywords: Glucocorticoid, Cushing syndrome, First‐in‐Human, CORT125134, Pharmacological effect
CORT125134 [(R)‐(1‐(4‐fluorophenyl)‐6‐((1‐methyl‐1H‐pyrazol‐4‐yl)sulfonyl)‐4,4a,5,6,7,8‐hexahydro‐1H‐pyrazolo[3,4‐g]isoquinolin‐4a‐yl)(4‐(trifluoromethyl)pyridin‐2‐yl)methanone] is a small molecule being developed for indications that may benefit from the modulation of cortisol activity (Figure 1). CORT125134 is an orally active, high‐affinity antagonist of the glucocorticoid receptor (GR) with excellent selectivity for the GR over other steroid receptors.1 The clinical relevance of GR modulation has been demonstrated in a number of settings, most notably Cushing syndrome. Mifepristone (Korlym®) is marketed in the United States for the control of hyperglycemia secondary to hypercortisolism in adult patients with endogenous Cushing syndrome. Unlike mifepristone, CORT125134 does not bind to the progesterone receptor and is therefore anticipated to be devoid of antiprogesterone effects, such as termination of pregnancy, endometrial hypertrophy, and irregular vaginal bleeding.
Figure 1.
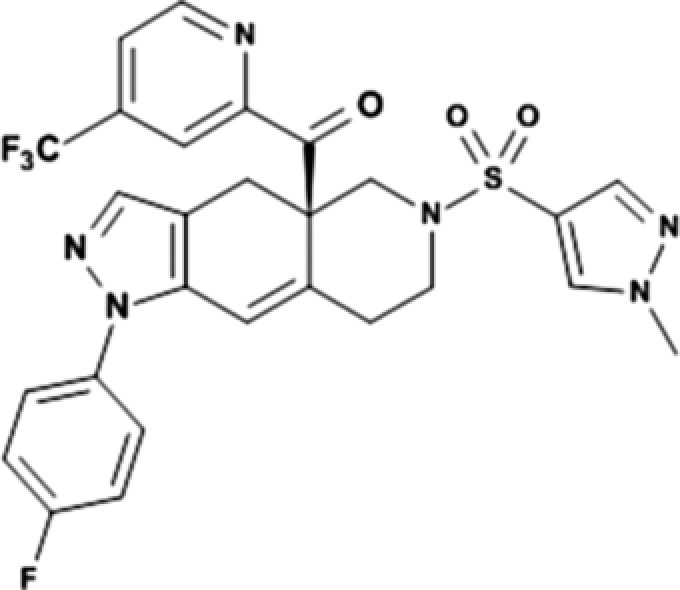
Chemical structure of CORT125134.
The GR is a ligand‐activated transcription factor and a member of the nuclear receptor superfamily. It is widely expressed in nearly all cell types and tissues. The essential role played by the GR is confirmed by the observation that mice with targeted disruption of the GR do not survive postpartum due to a number of defects.2 The GR mediates a breadth of biological processes, including gluconeogenesis, the cardiovascular system, immunity, inflammation, bone metabolism, brain function, and homeostasis/development.
In the absence of ligand the GR resides in the cytoplasm and associates with chaperone proteins, including heat shock proteins 90 and 70. Receptor ligand binding (cortisol in humans and higher mammals, corticosterone in rodents) causes a conformational change in the GR, leading to its dissociation from the chaperones and translocation of the ligand‐bound receptor to the nucleus. Once in the nucleus, the GR regulates gene transcription by both activating and repressive mechanisms. Analogous to other nuclear hormone receptors, the GR serves as an assembly point for transcription coregulators that can directly modify chromatin structure and/or affect the activity of the gene transcription apparatus. The GR can function either as a homodimer or as a monomer. Mechanisms by which the GR modulates gene expression include direct binding of the dimer to glucocorticoid response elements in the promoter or enhancer region of genes, and binding of the monomer to other transcription factors such as nuclear factor‐κB and activator protein 1 through protein‐protein interactions. Ligand structure, deoxyribonucleic acid sequence, cellular transcription factor composition, and regulatory inputs all contribute to gene‐specific regulation.3, 4, 5, 6
The genes that are downregulated by the GR include those encoding several inflammatory cytokines such as tumor necrosis factor‐α, interleukin (IL)‐1, IL‐2, and IL‐6, chemokines such as chemokine ligands 2 and19, and enzymes associated with the onset of inflammation, such as cyclooxygenase 2, matrix metalloproteinase 13 and phospholipase A2. Osteocalcin, corticotropin‐releasing hormone, and pro‐opiomelanocortin are regulated by glucocorticoid‐induced repression of gene expression.
Glucocorticoids (GCs) are thought to directly induce the expression of a few hundred genes in each cell type. Many more are indirectly controlled, for example, via GC‐mediated changes in expression of other transcription factors. Programs of GC‐induced gene expression are largely cell‐type specific, with only a small proportion of target genes being commonly upregulated in many different cell types. GCs induce the expression of genes encoding rate‐limiting enzymes of the gluconeogenesis pathway, such as glucose‐6‐phosphatase and phosphoenol‐pyruvate carboxykinase, thus augmenting de novo synthesis of glucose and eventually leading to weight gain and/or glucose intolerance. Enzymes involved in protein degradation and glycolysis are also regulated by GR‐mediated gene transcription. In addition, GCs induce a key regulatory gene of bone development, Dickkopf‐1, upregulation of which leads to osteoporosis and bone loss. GCs also induce the expression of genes encoding several anti‐inflammatory agents, including dual specificity phosphatase 1, nuclear factor of κ light polypeptide gene enhancer in B‐cells inhibitor α, IL‐10, and glucocorticoid‐induced leucine zipper (GILZ).
One of the genes that is most responsive to the administration of a GR agonist is FKBP5, which encodes the 51‐kDa FK506 binding protein. This induction is mediated by the GR because reversal by GR antagonists has been demonstrated.7, 8 Chronic administration of corticosterone to mice, (a model for exogenous Cushing syndrome) also results in elevated FKBP5 gene expression.9
The administration of a single dose of the GR agonist, prednisone, to healthy human subjects results in several pharmacological changes including effects on white blood cell differential counts and a reduction in serum osteocalcin.10
The primary objective of this first‐in‐human study was to evaluate the dose‐related safety, tolerability, and pharmacokinetics of CORT125134 and its active metabolite CORT125201 after single and multiple ascending oral doses of CORT125134 or placebo administered to healthy subjects.
Secondary objectives were to assess the pharmacological effects of CORT125134 in comparison with the positive control mifepristone and to explore the impact of food on the single‐dose pharmacokinetics of CORT125134.
Methods
Study Design
A single‐center study of single and multiple ascending doses of CORT125134 (Figure 2) was conducted between 15 September 2014 and 29 December 2015 at Quotient Clinical, Nottingham, UK, in accordance with the clinical protocol, International Council on Harmonisation‐Good Clinical Practice Guidelines, the Medicines for Human Use (Clinical Trials) Regulations (2004) and amendments (2006, 2008), and the ethical principles outlined in the World Medical Association Declaration of Helsinki and its amendments. The study was reviewed and approved by the Wales Research Ethics Committee 2, Cardiff, UK and the Medicines and Healthcare products Regulatory Agency. All subjects provided written informed consent before any study‐related procedures were performed.
Figure 2.
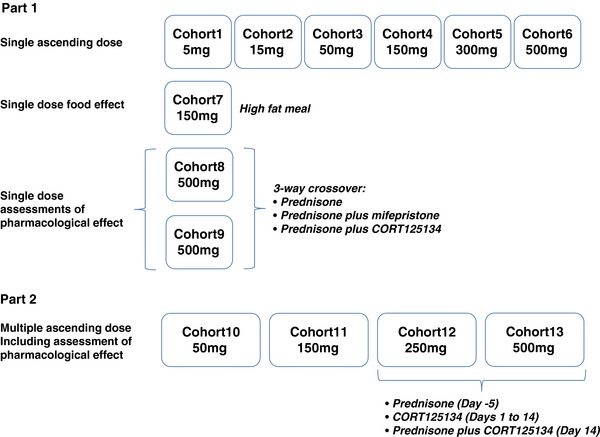
Study outline.
Subjects were healthy men, or women of nonchildbearing potential, aged 18 to 60 years, with a body mass index in the range 18.0 to 30.0 kg/m2 and weight not more than 102.0 kg. Health status was determined by medical history, physical examination, and clinical laboratory tests.
The single‐dose phase consisted of 9 cohorts. Cohorts 1 to 6 comprised a double‐blind, randomized, placebo‐controlled assessment of single ascending doses of oral CORT125134 administered in the fasted state. In each cohort 8 subjects were assigned to receive CORT125134 and 2 to receive matching placebo. Sentinel dosing of 2 subjects (1 active, 1 placebo) was employed for the first 2 cohorts, with the option to continue sentinel dosing in the remaining cohorts if required.
In cohort 7, a single dose of CORT125134 was administered to 8 subjects following consumption of a standard high‐fat breakfast.
The pharmacological effects of CORT125134 were explored in cohorts 8 and 9. Both cohorts were open‐label, single‐sequence, 3‐way crossovers comprising a single dose of 25 mg prednisone as a challenge agent; a single dose of prednisone with a single dose of 600 mg mifepristone as an active control; and a single dose of 25 mg prednisone with a single dose of 500 mg CORT125134. In cohort 8, assessments comprised white blood cell differential count, serum osteocalcin, and mRNA expression of FKBP5 and GILZ in whole blood. In cohort 9, subjects had an oral glucose tolerance test (OGTT) on each dosing day.
For each of the single‐dose cohorts, subjects were resident in the clinical unit from 24 hours before dosing until 72 hours postdose. Subjects returned for subsequent scheduled safety monitoring, blood sample collection, and discharge procedures.
The multiple ascending dose (MAD) phase consisted of cohorts 10 to 13, each of which comprised a double‐blind, randomized, placebo‐controlled assessment of up to 14 days’ oral dosing. In each cohort, 9 subjects were randomly assigned to receive CORT125134 and 3 to receive matching placebo.
Assessment of pharmacological effects was planned at the 2 highest dose levels (cohorts 12 and 13) with subjects receiving 25 mg prednisone on day ‐5; CORT125134 or matching placebo daily on days 1 to 13; and 25 mg prednisone in combination with the final dose of CORT125134 or placebo on day 14. In cohort 13, subjects were also scheduled an OGTT on day –5 and day 14.
For each multiple‐dose cohort, subjects were resident in the clinical unit from 36 hours before dosing until 72 hours post‐last‐dose. Subjects returned for subsequent scheduled safety monitoring, blood sample collection, and discharge procedures.
Randomization numbers were allocated on the morning of dosing, using the lowest number available for each subject. A predefined randomization code was generated by the assigned statistician at Quotient using SAS (Cary, NC). Randomization codes were only available to a designated member of the Quality Assurance team for the purposes of directing manufacture of appropriate products for dosing. They were not available to other personnel at the clinical unit, the Corcept team, consultants, or the bioanalytical laboratories. To allow immediate unblinding in the case of a safety issue, disclosure envelopes were prepared in accordance with local procedures.
Dose Selection
The starting dose of CORT125134 for single‐dose administration was selected based on the no observable adverse effect level in nonclinical toxicology studies and by consideration of the pharmacologically active dose.
The no observable adverse effect level in 14‐day repeat‐dose toxicity studies was 80 mg/kg per day (rat) or 20 mg/kg per day (monkey). These convert to human equivalent doses of 12.9 mg/kg and 6.5 mg/kg for rats and monkeys, respectively. A safety factor of 80 was selected because bioavailability in monkeys may underpredict bioavailability in humans and more severe toxicity was observed in monkeys than in rats.11 The maximum recommended starting dose for a 60‐kg individual was therefore approximately 5 mg.
CORT125134, 15 mg/kg per day, was shown to be pharmacologically active in a model of insulin resistance (cortisone‐dosed Sprague‐Dawley rats). The human equivalent dose of 2.4 mg/kg translates to 144 mg for a 60‐kg individual. The intended pharmacological effect of CORT125134 is well understood, and CORT125134 is not the first GR antagonist to be studied in man, having been preceded by mifepristone.
However, the general principle of selecting the lower of 2 calculated doses as a safe starting dose was applied. Therefore, the starting dose of 5 mg was selected.
Dose selection for each subsequent cohort was dependent on the safety, tolerability, and human exposure from the preceding cohort(s). The protocol encompassed flexibility to dose once or twice daily, and in the fed or fasted state, in the MAD phase as guided by emerging pharmacokinetic data.
Pharmaceutical Development
A formulation comprising CORT125134 dissolved in Kolliphor EL and Capmul MCM (1:1) and filled into hard gelatin capsules was used in this study. Two formulation concentrations, 50 mg/g and 200 mg/g, were developed, and each filled in a bracketed capsule fill weight range (100 mg to 1 g and 250 mg to 1 g, respectively). This approach enabled a dose design space to be created, from which any unit dose between 5 mg and 200 mg could be prepared. For doses above 200 mg, multiple units were administered. Short‐term stability sufficient to support the conduct of the study (21 days at 15°C to 25°C) was demonstrated.
Safety Assessments
Safety assessments included the following:
Adverse events
Clinical laboratory tests (clinical chemistry, hematology, urinalysis)
Tetracosactide (ACTH) test (day 15, multiple‐dose phase only)
Vital signs
12‐lead ECG
Continuous ECG (Holter) recordings before and 1, 2, 4, and 8 hours postdose on day 1 (single ascending dose phase) and days 0, 1, 7, and 15 (MAD phase), with data extraction using TQT Plus (iCardiac Technologies, Rochester, New York)
Physical examination
Skin assessment (multiple‐dose phase only)
Body weight
Pharmacokinetic Sampling and Analyses
Blood samples were collected for assay for plasma concentrations of CORT125134 and CORT125201 before and 0.5, 1, 2, 4, 8, 12, 24, 36, 48, 60, 72, 120, and 168 hours after each single dose. In the MAD phase, samples were collected over a dose interval (before and 0.5, 1, 2, 4, 6, 8, 12, and 24 hours after dosing) on days 1, 7, and 14, with additional elimination phase samples at 48, 72 (250‐mg dose), 96, 168, 240, and 336 hours after the last (day 14) dose. Predose samples were also collected on days 3 and 5.
Plasma concentrations of CORT125134 and the active metabolite, CORT125201 were analyzed using a validated, sensitive, and specific high‐performance liquid chromatography–tandem mass spectrometric method, which used a Waters Acquity high‐performance liquid chromatography system and a Sciex API‐4000 mass spectrometer. Human plasma samples (100 μL) were fortified with 15 μL of CORT125134‐D3 15N2 and CORT125201‐13C6 internal standard working solution followed by liquid‐liquid extraction with diethyl ether (400 μL). An aliquot of the organic layer (100 μL) was decanted and evaporated under nitrogen and reconstituted with dimethyl sulfoxide (DMSO):methanol (50:50, 100 μL) for analysis. The analytes were eluted using acetonitrile (mobile phase A) and 0.1% ammonia (aqueous) (mobile phase B), with a gradient method on a BEH Shield RP18column (2.1 × 100 mm, 1.7 μm). Selective detection was performed in multiple‐reaction monitoring and positive ionization modes by monitoring the transition of m/z 587>268, 573>268, 592>268, and 579>274, corresponding to the protonated molecular ion and most abundant fragment of CORT125134, CORT125201, CORT125134‐D3 15N2, and CORT125201‐13C6, respectively. Calibration curves were constructed using peak area ratios of the calibration standards by applying a linear‐weighted 1/concentration2 least‐squares regression algorithm. The dynamic range of the assay was 2 to 2000 ng/mL for each analyte. The precision and accuracy of the assay were ≤10.8% and ≤±1.0%, respectively, for CORT125134, and ≤11.9% and ≤±6.5%, respectively, for CORT125201.
Pharmacokinetic analysis was performed using standard noncompartmental methods (WinNonlin v6.4, Pharsight) on all available data from subjects who received CORT125134. During the analysis, all predose values below the quantification limits of the assay were entered as 0.
Pharmacodynamic Sampling and Analyses
Blood samples were collected before and at 2, 4, 8, 12, and 24 hours after each dose of prednisone (ie, prednisone, prednisone plus mifepristone, prednisone plus CORT125134, or prednisone plus placebo, as applicable) in cohort 8 (single dose) and cohorts 12 and 13 (multiple dose) to measure peripheral blood white cell differential count, serum osteocalcin, and expression of FKBP5 and GILZ. In the MAD phase, mRNA for FKBP5 was measured to 8 hours only, and GILZ was not measured.
Peripheral white cell differential count was measured via fluorescent flow cytometry using the Sysmex XE‐2100 Automated Hematology System (Sysmex Corporation, Kobe, Japan). Serum osteocalcin was measured using the OSTEO‐RIACT kit for the immunoradiometric assay for bone GLA protein in human serum and plasma (Cisbio, Bedford, Massachusetts). Expression of FKBP5 and GILZ was measured in whole blood via mRNA quantitation using TaqMan polymerase chain reaction analysis. Glyceraldehyde‐3 phosphate dehydrogenase (GAPDH) was used as a housekeeping gene.
Subjects in cohort 9 (single dose) and cohort 13 (multiple dose) had an OGTT (75 g glucose in solution) 5 hours after administration of each dose of prednisone. Blood samples were collected for glucose determination before and at 0.5, 1, 1.5, 2, 2.5, and 3 hours postdose. Because subjects in cohort 9 were inadvertently given a meal 1 hour before conducting the OGTT, postdose glucose concentrations are difficult to interpret and are not reported here.
Glucose was measured using the Cobas® GLUC3 in vitro UV test for the quantitative determination of glucose in human serum, plasma, urine, and CSF (Roche, Basel, Switzerland).
Blood samples were collected for assay for cortisol and ACTH from all subjects. For single‐dose cohorts, samples were collected in the morning (0700 to 1000) on days 1 (before dosing), 2, and 4; in the evening (2100 to 2300) on days 1 and 2; and at the follow‐up visit. As there was no predose evening sample, only morning samples were included in the analysis. For multiple‐dose cohorts, blood samples were collected in the morning (0700‐1000) and evening (2300‐2400) on days 0, 13, 14, and 15 for assay for cortisol; morning samples were also collected on days 0, 13, and 15 for assay for ACTH. Because all subjects were scheduled for a tetracosactide test on day 15, and subjects in cohorts 12 and 13 were scheduled for a dose of prednisone on day 14, only the morning samples on days 0 and 13 were used for analysis.
Cortisol was measured using the Cobas® Cortisol II electrochemiluminescence immunoassay for the in vitro quantitative determination of cortisol in human serum, plasma, and saliva (Roche).
ACTH was measured using the Immulite® 2000 ACTH in vitro diagnostic kit for the quantitative measurement of ACTH in EDTA plasma (Siemens Healthcare Diagnostics, Tarrytown, New York).
No treatment‐related pharmacodynamic data (cortisol measurement, reversal of prednisone effects) are available from cohort 13 (CORT125134, 500 mg daily, or placebo) due to the early termination of dosing (see below).
Statistics
This was an exploratory study. The numbers of subjects per cohort and assigned to active or placebo are consistent with common practice for this study type and were considered suitable to achieve the objectives. Formal statistical analysis (paired t‐test) was used in the analysis of PD end points; other results are presented using descriptive statistics only.
Results
Subjects
A total of 81 subjects received a single dose of CORT125134 (69 subjects) or placebo (12 subjects). Overall, the mean (range) age was 39.73 (21 to 60) years, and body mass index was 25.75 (18.2 to 30.3) kg/m2. The majority of subjects were male (mean 93.3% male, 6.7% female) and white (mean 85.9% white, 4.8% Asian, 6.5% black, and 2.8% other) (demographic data provided as supplemental on‐line content). Doses of CORT125134 studied were 5, 15, 50, 150, 300, and 500 mg CORT125134. The assessment of food effect used a 150‐mg dose, and assessments of pharmacological effect used a 500‐mg dose. All subjects completed the study.
Forty‐six subjects received up to 14 days’ dosing with CORT125134 (34 subjects) or placebo (12 subjects). Overall, the mean (range) age was 35.22 (18 to 58) years, and body mass index was 25.56 (range 18.1 to 29.4) kg/m2. The majority of subjects were male (mean: 96.1% male and 3.9% female), and white (mean: 62.1% white, 30.6% Asian, and 7.3% black) (demographic data provided as supplemental on‐line content). Daily doses studied were 50, 150, 250, and 500 mg. Nine subjects discontinued the study prematurely: 1 in each of the 150‐mg and 250‐mg dose groups and 7 in the 500‐mg group (see Safety). Dosing was suspended on day 11 of the 500‐mg dose group; later scheduled pharmacokinetic and pharmacodynamic assessments were not carried out.
Safety
Adverse Events: Single‐Dose Phase
Following single doses of CORT125134 or placebo, there were no serious or severe treatment‐emergent adverse events (TEAEs). The overall incidence of TEAEs was low and similar after dosing with CORT125134 or placebo (26% vs 33%, respectively). There was no dose‐related trend in the percentage of subjects reporting TEAEs and no difference in the incidence of TEAEs reported after fed or fasted dosing of 150 mg CORT125134.
Headache was the most frequently reported TEAE following dosing with either CORT125134 or placebo. Other investigational medicinal product–related TEAEs reported by more than 1 subject after dosing with CORT125134 were nausea, vomiting, and thirst. The vast majority of TEAEs were mild in severity. There were 3 moderate events (nausea, 2; and vomiting, 1) that were considered related to the study drug.
Adverse Events: Multiple‐Dose Phase
Over the dose range 50 to 250 mg/day, the overall incidence of TEAEs was low and similar after repeated dosing with CORT125134 or placebo (64% vs 55%, respectively). There was no notable difference in the incidence or frequency of investigational medicinal product–related TEAEs between CORT125134 and placebo. There was some dose‐related trend in the proportion of subjects reporting at least 1 TEAE (44%, 67%, and 86% of subjects after dosing with 50, 150, and 250 mg CORT125134, respectively). The most commonly reported events after dosing with CORT125134 were musculoskeletal and connective tissue disorders, GI system disorders, general disorders, and application site conditions. Most TEAEs were mild in intensity. However, 2 subjects discontinued dosing due to TEAEs: 1 (150 mg CORT125134) experienced severe pain in an extremity; and 1 (250 mg/day) experienced moderate constipation and abdominal pain. One unrelated serious adverse event was reported (traumatic head injury during follow‐up in a subject treated with 50 mg CORT125134; the subject was admitted overnight for observation and made a full recovery).
Over the first 11 days of dosing with CORT125134, 500 mg/day or placebo, treatment was stopped in 7 of the 12 subjects owing to a range of predominantly musculoskeletal TEAEs. Following selective unblinding, all 7 subjects were shown to be receiving CORT125134. Consequently, this dose was considered to exceed the maximum tolerated dose, and dosing of remaining subjects was terminated. One severe adverse event was reported (back‐pain), and the remainder were mild or moderate. All made a full recovery.
Laboratory Assessments, Vital Signs, and ECG Parameters
There were no clinically significant findings in laboratory assessments, vital signs, 12‐lead ECGs, or body weight. CORT125134 in doses resulting in plasma concentrations exceeding 4 μg/mL did not have a clinically relevant effect on ECG parameters. In the MAD phase, the estimated mean slope of the relation between plasma concentration CORT125134 and placebo‐corrected change from baseline QTcF was −2.34 × 10⁻³ msec per ng/mL (90% confidence interval −3.157 to –1.524) (data not presented). An effect on placebo‐corrected change from baseline QTcF above 10 ms can be excluded within the studied range of plasma concentrations.
Pharmacokinetic Results
Single Doses
After single doses from 5 to 500 mg administered in the fasted state, CORT125134 was absorbed rapidly with a median lag time of 0.0 hour (data not presented) and median time to peak concentration (Tmax) in the range 0.75 to 2.0 hours. At each dose level the range of Tmax values varied from 0.5 to 4.0 hours (Table 1, Figure 3).
Table 1.
Summary of CORT125134 PK Parameters: Single Ascending Dose
| Tmax, h | Cmax, ng/mL | AUC0‐24, h·ng/mL | AUCinf, h·ng/mL | Half‐Life, h | ||
|---|---|---|---|---|---|---|
| 5 mg | N | 8 | 8 | 8 | NC | NC |
| Mean | 0.8770 | 7.189 | 11.16 | |||
| Median | 0.7500 | 6.255 | 10.37 | |||
| Range | 0.5‐2.0 | |||||
| CV% | 42.4 | 43.0 | ||||
| 15 mg | N | 8 | 8 | 8 | NC | NC |
| Mean | 1.250 | 25.04 | 49.97 | |||
| Median | 1.000 | 24.25 | 47.62 | |||
| Range | 0.5–2.0 | |||||
| CV% | 58.8 | 51.0 | ||||
| 50 mg | N | 8 | 8 | 8 | 8 | 8 |
| Mean | 1.690 | 166.5 | 499.4 | 569.1 | 11.38 | |
| Median | 1.5100 | 163.5 | 473.7 | 529.5 | 12.51 | |
| Range | 0.5–4.0 | |||||
| CV% | 48.3 | 28.1 | 28.5 | 59.6 | ||
| 150 mg | N | 7 | 7 | 7 | 7 | 7 |
| Mean | 2.571 | 671.7 | 3070 | 3575 | 16.96 | |
| Median | 2.000 | 739.0 | 2874 | 3428 | 16.24 | |
| Range | 1.0–4.0 | |||||
| CV% | 41.9 | 43.1 | 44.85 | 34.2 | ||
| 300 mg | N | 6 | 6 | 6 | 6 | 6 |
| Mean | 2.000 | 802.2 | 5381 | 7052 | 18.90 | |
| Median | 2.000 | 741.5 | 5464 | 6526 | 19.38 | |
| Range | 2.0‐2.0 | |||||
| CV% | 46.1 | 34.0 | 42.5 | 27.7 | ||
| 500 mg | N | 7 | 7 | 7 | 7 | 7 |
| Mean | 2.714 | 1567 | 12,790 | 18,170 | 18.89 | |
| Median | 2.000 | 1690 | 13,170 | 17,650 | 21.59 | |
| Range | 1.0–4.0 | |||||
| CV% | 20.0 | 15.1 | 20.6 | 26.3 |
AUC0‐24 indicates area under the concentration‐time curve for first 24 hours; AUCinf, complete area under the concentration‐time curve; Cmax, peak concentration; CV%, coefficient of variation (%); NC indicates not calculated—insufficient data to calculate half‐life; Tmax, time to peak concentration.
Figure 3.
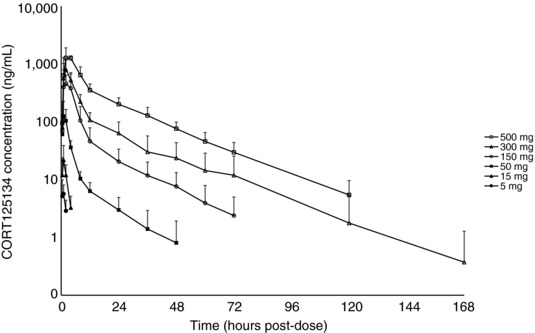
Mean ± SD CORT125134 plasma concentration vs time plot (semi‐log): single ascending dose.
Exposure increased in a greater than proportional manner with dose increment, particularly over the lower dose range (5 to 50 mg). Mean (percentage variation) peak concentration (Cmax) values for each dose level of 7.2 (42%), 25 (59%), 167 (48%), 672 (42%), 802 (46%), and 1567 (20%) ng/mL were recorded, respectively. Mean (percentage variation) area under the concentration‐time curve (AUC) values for each dose level, respectively, were 11.16 (43%), 50.0 (51%), 499 (28%), 3070 (43%), 5381 (34%), and 12,790 (15%) h·ng/mL.
For subjects for whom AUCinf was calculated (50 mg dose upward), <15% was obtained by extrapolation, showing that the plasma concentration profile was adequately described. At these doses, mean half‐life ranged from 11.4 to 18.9 hours (variation ranged from 26% to 60%).
Apparent clearance following single doses (CL/F) was dose dependent, with CL/F decreasing with increasing dose. For example, CL/F was 309, 49, and 29 L/hr following 15‐, 300‐, and 500‐mg single doses, respectively (data not presented).
Across all doses, metabolite (CORT125201) Cmax and AUC were approximately 2% to 8% that of CORT125134 (data not presented).
Food Effect
The effect of a high‐fat meal before dosing on bioavailability was evaluated by comparing the CORT125134 pharmacokinetic parameters from cohort 7 (150 mg, fed) with subjects who received the same dose fasted in the single‐dose phase (cohort 4) and the first dose of repeated dosing in the MAD phase (cohort 11) (data not presented). Coadministration with food resulted in a delay in absorption (median Tmax 4 hours, compared with 2 hours in cohorts 4 and 11). Mean concentrations in the fed cohort were lower than those in cohort 4 over the 0‐ to 4‐hour period, and thereafter the mean profiles were nearly superimposable, resulting overall in mean AUClast and AUCinf about 14% lower than those in fasted subjects. In contrast, mean concentrations were somewhat higher in the fed cohort than on day 1 of dosing in cohort 11, resulting in an AUC0‐24 about 24% higher. Thus, any effect of administration with food did not appear to be substantial and cannot be determined with full confidence in this study.
Multiple Ascending Doses
Pharmacokinetic parameters during repeated dosing are summarized in Table 2; concentration‐time profiles are shown in Figure 4. Note that no day 14 or elimination data are available for the 500‐mg dose.
Table 2.
Summary of CORT125134 PK Parameters: Multiple Ascending Dose
| Tmax, h | Cmax, ng/mL | AUC0‐24, h·ng/mL | AUCinf, h·ng/mL | Half‐Life, h | Cavg, ng/mL | |||
|---|---|---|---|---|---|---|---|---|
| 50 mg | Day 1 | N | 9 | 9 | 9 | 8 | 8 | N/A |
| Mean | 0.8870 | 132.2 | 453.4 | 496.7 | 7.414 | |||
| Median | 0.98 | 151.0 | 434.2 | 481.0 | 8.474 | |||
| Range | 0.5–2.0 | |||||||
| CV% | 40.6 | 42.5 | 46.4 | 42.3 | ||||
| Day 7 | N | 9 | 9 | 9 | 7 | 7 | 9 | |
| Mean | 1.611 | 244.9 | 1257 | 1463 | 8.639 | 52.37 | ||
| Median | 1.000 | 186.0 | 930.2 | 965.5 | 9.044 | 38.76 | ||
| Range | 0.5–3.0 | |||||||
| CV% | 63.4 | 66.8 | 74.2 | 28.6 | 66.8 | |||
| Day 14 | N | 9 | 9 | 9 | 8 | 8 | 9 | |
| Mean | 1.780 | 249.1 | 1373 | 1855 | 11.99 | 57.22 | ||
| Median | 1.000 | 193.0 | 910.4 | 1600 | 12.77 | 37.93 | ||
| Range | 0.5–4.02 | |||||||
| CV% | 54.1 | 61.7 | 66.7 | 35.3 | 61.7 | |||
| 150 mg | Day 1 | N | 9 | 9 | 9 | 9 | 9 | N/A |
| Mean | 2.669 | 385.7 | 2098 | 2248 | 6.566 | |||
| Median | 2.000 | 529.0 | 2292 | 2427 | 7.198 | |||
| Range | 1.0–6.0 | |||||||
| CV% | 51.8 | 47.0 | 48.5 | 22.0 | ||||
| Day 7 | N | 9 | 9 | 9 | 8 | 8 | 9 | |
| Mean | 2.678 | 1026 | 8796 | 10,920 | 11.83 | 366.5 | ||
| Median | 2.03 | 890.0 | 7208 | 9832 | 9.830 | 300.3 | ||
| Range | 1.0–6.0 | |||||||
| CV% | 39.2 | 42.6 | 50.9 | 38.0 | 42.6 | |||
| Day 14 | N | 8 | 8 | 8 | 8 | 8 | 8 | |
| Mean | 2.500 | 1062 | 9969 | 15,650 | 19.09 | 415.4 | ||
| Median | 2.500 | 1037 | 10,520 | 15,500 | 17.52 | 438.1 | ||
| Range | 1.0–4.0 | |||||||
| CV% | 23.6 | 36.4 | 44.2 | 23.9 | 36.4 | |||
| 250 mg | Day 1 | N | 7 | 7 | 7 | 7 | 7 | N/A |
| Mean | 1.581 | 916.0 | 6213 | 7271 | 8.330 | |||
| Median | 1.03 | 680.0 | 5618 | 6560 | 7.027 | |||
| Range | 1.0–3.0 | |||||||
| CV% | 46.9 | 51.1 | 60.6 | 36.9 | ||||
| Day 7 | N | 7 | 7 | 7 | 4 | 4 | 7 | |
| Mean | 2.574 | 2106 | 20,910 | 21,020 | 12.14 | 871.1 | ||
| Median | 2.000 | 1910 | 17,930 | 23,460 | 10.06 | 747.1 | ||
| Range | 2.0–4.0 | |||||||
| CV% | 38.0 | 46.8 | 32.9 | 45.1 | 46.8 | |||
| Day 14 | N | 6 | 6 | 6 | 6 | 6 | 6 | |
| Mean | 1.500 | 2542 | 22,390 | 32,930 | 14.71 | 933.0 | ||
| Median | 1.500 | 2295 | 19,410 | 28,720 | 12.47 | 808.9 | ||
| Range | 1.0–2.0 | |||||||
| CV% | 40.3 | 36.7 | 36.2 | 33.2 | 36.7 | |||
| 500 mg | Day 1 | N | 9 | 9 | 9 | 6 | 6 | N/A |
| Mean | 1.928 | 2513 | 16,773 | 24,053 | 12.02 | |||
| Median | 2.000 | 2400 | 13,953 | 20,031 | 11.32 | |||
| Range | 1.0–3.3 | |||||||
| CV% | 33.3 | 51.0 | 64.9 | 26.7 | ||||
| Day 7 | N | 8 | 8 | 8 | 7 | 7 | 8 | |
| Mean | 2.250 | 3509 | 36,382 | 64,124 | 18.395 | 1515.9 | ||
| Median | 2.000 | 3215 | 32,572 | 54,630 | 18.932 | 1357.2 | ||
| Range | 1.0–4.0 | |||||||
| CV% | 31.7 | 39.3 | 55.9 | 34.9 | 39.3 |
AUC0‐24 indicates area under the concentration‐time curve for first 24 hours; AUCinf, complete area under the concentration‐time curve; Cmax, peak concentration; CV%, coefficient of variation (%); Tmax, time to peak concentration.
Figure 4.
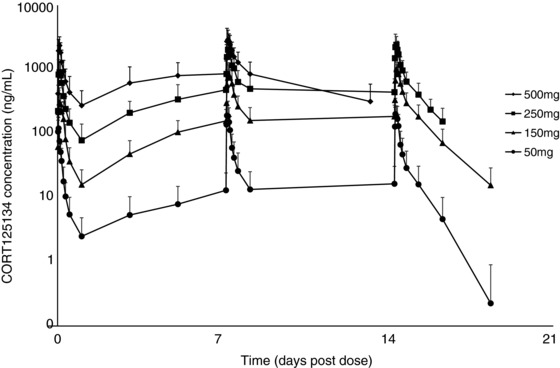
Mean ± SD CORT125134 plasma concentration vs time plot (semi‐log): multiple ascending dose.
Concentrations were close to steady state by day 7.
The observed accumulation ratios of day 14 to day 1 for Cmax were 2.39, 3.67, and 2.73, and those for AUC0‐24 were 3.26, 5.54, and 3.80 at 50, 150, and 250 mg, respectively (data not presented). As for single doses, the increase in exposure with dose was greater than proportional, with an exposure‐to‐dose ratio for AUC0‐24 of approximately 2.0.
Apparent clearance was lower on day 7 and 14 compared to day 1 for all doses in the multiple dose phase. Mean values were 49, 18, and 12 L/hr on day 14 for the 50, 150, and 250 mg daily doses (data not presented).
The mean half‐lives (variation) were 11.99 (35%), 19.09 (24%), and 14.71 (33%) hours following doses of 50, 150, and 250 mg, respectively (Table 2).
At presumed steady state, CORT125201 AUC0‐24 was less than 5% that of parent (data not presented).
Pharmacodynamic Results
As expected, 25 mg prednisone caused rapid reductions in eosinophils, lymphocytes, and osteocalcin and increases in neutrophils and expression of FKBP5 and GILZ. The positive control, a single dose of 600 mg mifepristone, ameliorated these changes. CORT125134 (500 mg single dose or 250 mg daily) ameliorated these changes to a comparable extent to mifepristone, and placebo had no impact. Results are illustrated for eosinophils and osteocalcin for cohort 8 (single dose) in Figures 5 and 6 and cohort 12 (multiple dose) in (Figures 7 and 8).
Figure 5.
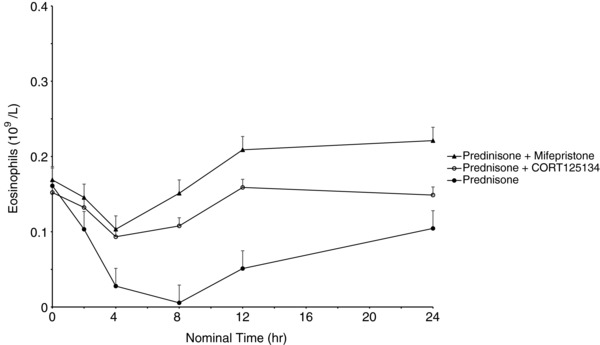
Mean ± SE eosinophil values vs time following administration of 25 mg prednisone, 25 mg prednisone + 500 mg CORT125134, and 25 mg prednisone + 600 mg mifepristone.
Figure 6.
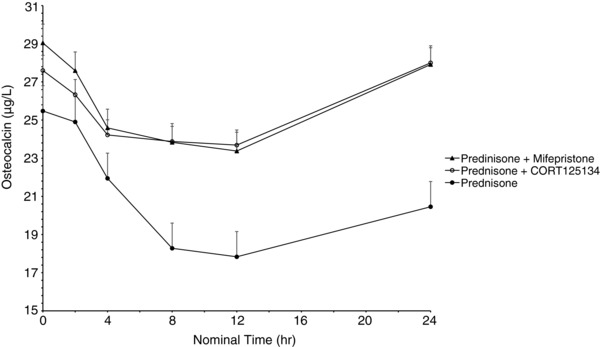
Mean ± SE osteocalcin values vs time following administration of 25 mg prednisone, 25 mg prednisone + 500 mg CORT125134, and 25 mg prednisone + 600 mg mifepristone.
Figure 7.
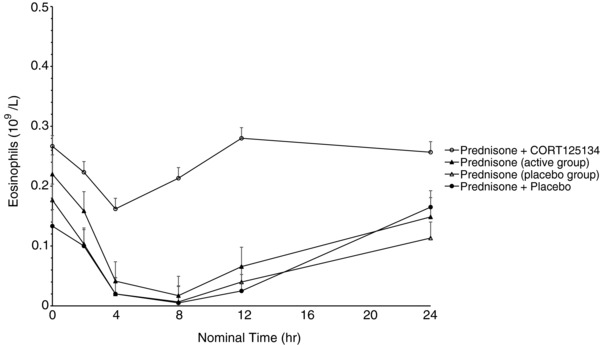
Mean ± SE eosinophil values vs time following administration of 25 mg prednisone alone (active group), 25 mg prednisone alone (placebo group), 25 mg prednisone + 250 mg CORT125134 after 14 days’ dosing CORT125134 (active group), 25 mg prednisone + placebo after 14 days’ dosing placebo (placebo group).
Figure 8.
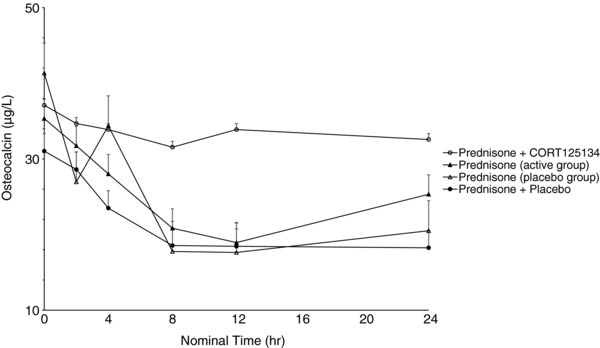
Mean ± SE osteocalcin values vs time following administration of 25 mg prednisone alone (active group), 25 mg prednisone alone (placebo group), 25 mg prednisone + 250 mg CORT125134 after 14 days’ dosing CORT125134 (active group), 25 mg prednisone + placebo after 14 days’ dosing placebo (placebo group).
FKBP5 and GILZ expression increased, reaching a mean maximum of 14‐fold and 3‐fold, respectively, 4 hours after dosing with prednisone (data not presented). Compared with the effect of prednisone alone, coadministration with a single 600‐mg dose of mifepristone decreased FKBP5 expression approximately 10‐fold and GILZ expression approximately 3‐fold, which were to near preprednisone dose levels. Coadministration of CORT125134 (500 mg as a single dose or 250 mg daily for 14 days) with prednisone showed effects similar to those observed with mifepristone in combination with prednisone.12
Mean (SD) pre‐OGTT plasma glucose concentrations (ie, 5 hours after dosing and 1 hour postprandial), following prednisone alone, prednisone plus mifepristone, and prednisone plus CORT125134 were 7.79 (1.006) mmol/L, 6.30 (1.006) mmol/L (P = .0118 compared with prednisone alone; paired t‐test), and 5.55 (0.431) mmol/L (P = .0006 compared with prednisone alone; P = .0483 compared with prednisone plus mifepristone), respectively (data not presented).
The expected diurnal variation in cortisol concentrations was observed. There was no consistent trend with treatment (CORT125134 vs placebo) or dose of CORT125134 in concentrations of ACTH or cortisol 24 hours after single doses. In the MAD cohorts, morning values showed a decrease in serum cortisol in placebo‐treated subjects across study days. In contrast, CORT125134‐treated subjects (50 to 250 mg/day) showed an increase in serum cortisol. For the day 13 morning values, analysis of variance showed a significant difference for cortisol (P = .0014). For serum cortisol there also appeared to be a dose‐related effect, morning cortisol concentrations being greatest at the highest dose (Figure 9).
Figure 9.
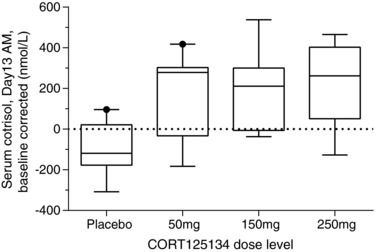
Box and whisker plots for serum cortisol (day 13 morning levels), corrected for baseline, following administration of 50, 150, and 250 mg/day and combined placebos. Horizontal lines of the “boxes” represent the 25th, 50th and 75th percentiles. Vertical lines extending from the boxes (“whiskers”) indicate the minimum and maximum values. Conversion factor for cortisol nmol/L to ng/ml = 2.759 e.g. 1nmol/L = 0.3624ng/mL.
Discussion
Mifepristone was approved by the Food and Drug Administration in 2012 for the treatment of patients with Cushing syndrome. It provides effective relief from the multitude of symptoms associated with this serious disease, but its use is limited by a lack of nuclear receptor selectivity. In addition to binding to the GR, mifepristone also has high affinity for the progesterone receptor. Indeed, it is approved in many countries for the termination of pregnancy, an effect that results from potent antagonism of the progesterone receptor. As well as causing early abortion, progesterone receptor antagonism is associated with endometrial thickening and irregular vaginal bleeding. These effects limit the utility of the drug in women of childbearing potential and have prompted a search for a selective GR antagonist devoid of affinity for the progesterone receptor. CORT125134 represents such a compound and is being developed for the treatment of patients with Cushing syndrome. Efficacy equivalent to mifepristone has been demonstrated in a rat model of exogenous Cushing syndrome1 and a phase 2 clinical study in this indication is under way.
This article describes the first‐in‐human study designed to assess safety, tolerability, and pharmacokinetics of CORT125134 and to provide proof of pharmacological effect. A particular feature of this study was the opportunity to demonstrate GR antagonism by reversal of the effects of the GR agonist, prednisone.
Safety
CORT125134 was well tolerated following single doses up to 500 mg and repeated doses up to 250 mg once daily for 14 days. Dose‐limiting TEAEs were recorded during daily administration of 500 mg. The most frequently reported dose‐limiting symptoms were musculoskeletal disorders (eg, back pain). Some of these adverse effects may be mediated through blockade of the GR. If this is the case, CORT125134 may be better tolerated in patients with Cushing syndrome, who will have higher levels of the endogenous GR agonist cortisol and thus should be less susceptible to the effects of a GR antagonist. CORT125134 had no effect on laboratory assessments, 12‐lead ECGs, cardiac intervals including QTcF, or body weight.
Pharmacokinetics
CORT125134 was rapidly absorbed (median Tmax 0.75 to 2.5 hours). At doses of 150 mg or greater, the mean elimination half‐life was generally in the range 17 to 19 hours, appropriate for once‐daily dosing. Following repeated daily oral doses, steady state was achieved by day 7. The mean observed accumulation ratio was 2‐ to 5‐fold (Tables 1 and 2).
Exposure increased in a greater‐than‐proportional manner across the dose range, particularly at lower doses. Possible reasons for the increase in bioavailability at higher doses include saturation of capacity of a metabolic route, autoinhibition of metabolism, or saturation of an efflux mechanism (Tables 1 and 2).
The single‐dose data show that CL/F is dose dependent, with CL/F decreasing with increasing dose. However, CL/F is not only dose dependent but also time dependent, as indicated by the lower CL/F on days 7 and 14 compared with day 1 for all doses in the multiple‐dose phase. As with half‐life, CL/F was calculated for day 1 and day 7, but the day‐14 estimate was more accurate due to the extended sampling. It should also be noted that, without knowledge of CORT125134's absolute bioavailability at these dose levels, it was not possible to estimate the true clearance or volume of distribution.
Because concentrations of the active metabolite CORT125201 were low relative to the parent (2% to 8%), it is not expected to contribute significantly to activity.
Evaluation of the effect of food on exposure to CORT125134 was an exploratory objective. In this study a noncontemporaneous parallel group design was used in small cohorts (8 subjects). The results were small in magnitude and variable so the outcome is not conclusive. This may be due to intersubject variability.
Pharmacodynamics
The impact of a single dose of prednisone on a variety of parameters, including white blood cell differential (neutrophil, lymphocyte, and eosinophil) counts and osteocalcin, has been reported previously and provided a convenient method to assess GR antagonism in healthy subjects.10 Nonclinical investigations had also indicated that expression of GILZ, a key GR‐responsive endogenous regulator of immune responses, and FKBP5, a key regulator of steroid hormone receptors as part of the heat shock protein 90 steroid receptor complex mRNA, had potential roles as biomarkers specifically linked to GR activation.12
In the present study prednisone was clearly demonstrated to have the expected effects on all the biomarkers examined. Mifepristone was used as an active control in the single‐dose study. A 600‐mg dose was selected because it represents the average dose required for effective treatment of patients with Cushing syndrome. Mifepristone ameliorated all the effects of prednisone, demonstrating the utility of this method for the assessment of GR antagonism. Similarly, both a single 500‐mg dose and 14 days’ dosing with 250 mg daily of CORT125134 ameliorated all effects of prednisone. The single dose had similar efficacy to mifepristone at 600 mg (Figures 5, 6, 7, and 8).
The primary end points for this assessment were objective laboratory biomarkers assayed by an independent laboratory; thus, the single sequence nature of the study and the open‐label nonrandomized design of the single‐dose part are not considered limitations. Further, the effects of prednisone were similar when given before and at the end of the placebo‐treatment period in the 3 subjects randomized to blinded placebo in the repeated‐dose study.
It was also planned to evaluate the impact of CORT125134 on prednisone‐induced glucose intolerance to assess proof of the concept that CORT125134 could block a biologically relevant marker of Cushing syndrome. Post‐OGTT blood glucose concentrations are not reported because the subjects were given a meal prior to the test. However, baseline (ie, postprandial) glucose concentrations were significantly lower when subjects received 25 mg prednisone plus CORT125134, compared with 25 mg prednisone alone or with 600 mg mifepristone. Although this was an unplanned assessment, these data suggest that CORT125134 can improve postprandial glucose tolerance following the administration of prednisone.
The ability of CORT125134 to ameliorate the pharmacological effects of a single dose of prednisone, 25 mg, were evaluated only at the highest single (500 mg) and repeated (250 mg) doses; therefore, this study was designed to provide evidence of pharmacological effect but not of dose‐response. Demonstration of GR antagonism was achieved.
Since GR antagonism inhibits the negative feedback of the hypothalamo‐pituitary‐adrenal axis, it is expected to be associated with increases in both ACTH and cortisol concentrations, providing a secondary method for assessing whether CORT125134 acts as a GR antagonist. Serum cortisol and plasma ACTH concentrations were measured in all subjects. The expected diurnal variation was observed. However, changes associated with treatment were difficult to interpret. There was no consistent trend in concentrations of cortisol 24 hours after single doses. In the repeated‐dose part of the study, placebo‐treated subjects showed a decrease in morning values for cortisol across study days, most probably due to accommodation to the environment in the clinical pharmacology unit and reduction in stress. In contrast to the reduction in cortisol seen in placebo‐treated subjects, CORT125134‐treated subjects (50 to 250 mg/day) showed an increase in absolute values for serum cortisol that appeared to be dose‐related and was statistically significant compared with the placebo group (Figure 9).
Conclusions
This first‐in‐human study has demonstrated that CORT125134 is well tolerated following single doses up to 500 mg and repeated doses up to 250 mg once daily for 14 days. Pharmacological activity was confirmed following the administration of a single 500‐mg dose and daily administration of 250 mg.
Supporting information
Supporting Information
Supporting Information
Acknowledgments
The authors would like to thank the team at LGC Ltd (Cambridgshire, UK) for bioanalytical method development and validation and for sample analysis during the conduct of the study.
Declaration of Conflicting Interests
Hazel Hunt, Mark Strem, and Joseph Belanoff are employees and shareholders of Corcept Therapeutics. The study was conducted at Quotient Clinical. Vanessa Zann, Pui Leung, Suzanne Sweet, and Alyson Connor are employees of Quotient Clinical. Kirsteen Donaldson and Dan Combs are paid consultants of Corcept Therapeutics. A clinical research agreement was in place, with standard stipulations regarding the ownership and hence publication of the data.
Funding
This study was funded by Corcept Therapeutics, who are developing CORT125134.
References
- 1. Hunt HJ, Belanoff JK, Walters I, et al. Identification of the clinical candidate (R)‐(1‐(4‐fluorophenyl)‐6‐((1‐methyl‐1H‐pyrazol‐4‐yl)sulfonyl)‐4,4a,5,6,7,8‐hexahydro‐1H‐pyrazolo[3,4‐g]isoquinolin‐4a‐yl)(4‐(trifluoromethyl)pyridin‐2‐yl)methanone (CORT125134): a selective glucocorticoid receptor (GR) antagonist. J Med Chem. 2017;60(8):3405–3421. [DOI] [PubMed] [Google Scholar]
- 2. Cole TJ, Blendy JA, Monaghan AP, et al. Targeted disruption of the glucocorticoid receptor gene blocks adrenergic chromaffin development and severely retards lung maturation. Genes Dev. 1995;9:1608–1621. [DOI] [PubMed] [Google Scholar]
- 3. Kadmiel M, Cidlowski JA. Glucocorticoid receptor signalling in health and diseases. Trends Pharmacol Sci. 2013;34:518–530. [DOI] [PMC free article] [PubMed] [Google Scholar]
- 4. Oakley RD, Cidlowski JA. The biology of the glucocorticoid receptor: new signalling mechanisms in health and disease. J Allergy Clin Immunol. 2013;132:1033–1044. [DOI] [PMC free article] [PubMed] [Google Scholar]
- 5. De Bosscher K. Selective glucocorticoid receptor modulators. J Steroid Biochem Mol Biol. 2010;120:96–104. [DOI] [PubMed] [Google Scholar]
- 6. Clark AR, Belvisi MG. Maps and legends: the quest for dissociated ligands of the glucocorticoid receptor. Pharmacol Ther. 2012;134:54–67. [DOI] [PubMed] [Google Scholar]
- 7. Vermeer H, Hendriks‐Stegeman BI, van der Burg B, et al. Glucocorticoid‐induced increase in lymphocytic FKBP51 messenger ribonucleic acid expression: a potential biomarker for glucocorticoid sensitivity, potency, and bioavailability. J Endocrinol Metab. 2003;88:277–284. [DOI] [PubMed] [Google Scholar]
- 8. Caldwell JM, Blanchard C, Collins MH, et al. Glucocorticoid‐regulated genes in eosinophilic esophagitis: a role for FKBP51. J Allergy Clin Immunol. 2010;125(4):879–888. [DOI] [PMC free article] [PubMed] [Google Scholar]
- 9. Ewald RE, Wand GS, Seifuddin F, et al. Alterations in DNA methylation of Fkbp5 as a determinant of blood‐brain correlation of glucocorticoid exposure. Psychoneuroendocrinology. 2014;44:112–122. [DOI] [PMC free article] [PubMed] [Google Scholar]
- 10. Kauh E, Mixson L, Malice MP, et al. Prednisone affects inflammation, glucose tolerance, and bone turnover within hours of treatment in healthy individuals. Eur J Endocrinol. 2012;166:459–467. [DOI] [PubMed] [Google Scholar]
- 11. Chiou WL, Buehler PW. Comparison of oral absorption and bioavailability of drugs between monkey and human. Pharm Res. 2002;6:868–874. [DOI] [PubMed] [Google Scholar]
- 12. Bali U, Philips T, Hunt H, et al. FKBP5 mRNA expression is a biomarker for GR antagonism. J Clin Endocrinol Metab. 2016;101(11):4305–4312. [DOI] [PubMed] [Google Scholar]
Associated Data
This section collects any data citations, data availability statements, or supplementary materials included in this article.
Supplementary Materials
Supporting Information
Supporting Information


