

Abstract
Purpose
Both dynamic magnetic resonance angiography (4D‐MRA) and perfusion imaging can be acquired by using arterial spin labeling (ASL). While 4D‐MRA highlights large vessel pathology, such as stenosis or collateral blood flow patterns, perfusion imaging provides information on the microvascular status. Therefore, a complete picture of the cerebral hemodynamic condition could be obtained by combining the two techniques. Here, we propose a novel technique for simultaneous acquisition of 4D‐MRA and perfusion imaging using time‐encoded pseudo‐continuous arterial spin labeling.
Methods
The time‐encoded pseudo‐continuous arterial spin labeling module consisted of a first subbolus that was optimized for perfusion imaging by using a labeling duration of 1800 ms, whereas the other six subboli of 130 ms were used for encoding the passage of the labeled spins through the arterial system for 4D‐MRA acquisition. After the entire labeling module, a multishot 3D turbo‐field echo‐planar‐imaging readout was executed for the 4D‐MRA acquisition, immediately followed by a single‐shot, multislice echo‐planar‐imaging readout for perfusion imaging. The optimal excitation flip angle for the 3D turbo‐field echo‐planar‐imaging readout was investigated by evaluating the image quality of the 4D‐MRA and perfusion images as well as the accuracy of the estimated cerebral blood flow values.
Results
When using 36 excitation radiofrequency pulses with flip angles of 5 or 7.5°, the saturation effects of the 3D turbo‐field echo‐planar‐imaging readout on the perfusion images were relatively moderate and after correction, there were no statistically significant differences between the obtained cerebral blood flow values and those from traditional time‐encoded pseudo‐continuous arterial spin labeling.
Conclusions
This study demonstrated that simultaneous acquisition of 4D‐MRA and perfusion images can be achieved by using time‐encoded pseudo‐continuous arterial spin labeling. Magn Reson Med 79:2676–2684, 2018. © 2017 The Authors Magnetic Resonance in Medicine published by Wiley Periodicals, Inc. on behalf of International Society for Magnetic Resonance in Medicine. This is an open access article under the terms of the Creative Commons Attribution NonCommercial License, which permits use, distribution and reproduction in any medium, provided the original work is properly cited and is not used for commercial purposes.
Keywords: time‐encoded pCASL, perfusion image, 4D‐MRA
INTRODUCTION
For assessment of the hemodynamic condition of the brain, both visualization of the arterial pathways as well as obtaining microvascular information are essential. The former can be achieved by MR angiography (MRA) and dynamic MRA, which depict blood flow patterns as well as macrovascular pathology, such as artery stenosis. The latter can be assessed by measuring the cerebral blood flow (CBF) with perfusion MRI, thereby providing information on the delivery of oxygen and nutrients to the brain tissue. Both imaging techniques provide complementary information, and their combination contributes to a full picture of the hemodynamic status of the brain.
Arterial spin labeling (ASL) techniques are used both for noncontrast 4D‐MRA 1, 2, 3, 4 as well as for perfusion imaging. Because both imaging modalities are based on a similar ASL preparation module, a combined acquisition seems feasible. Conveniently, the timing of interest after the labeling of arterial blood is different for 4D‐MRA and perfusion imaging. In perfusion imaging, a long postlabel delay (PLD) of 1.6 to 2.0 s is required, so that all labeled blood has arrived in the brain tissue and no signal arises from within the arterial vessels 5, 6. In contrast, in 4D‐MRA, acquisition usually starts immediately after the labeling and is repeated multiple times to depict the passage of the labeled blood through the arterial tree. Therefore, acquisition of 4D‐MRA could fit perfectly within the PLD of perfusion imaging. However, there are two main challenges standing in the way of such an implementation. First, the current recommended implementation of ASL for clinical perfusion imaging is pseudo‐continuous ASL (pCASL) with a labeling duration of approximately 1.8 s, as a result of its ease of implementation and the high signal‐to‐noise ratio (SNR) 5. For 4D‐MRA, however, such a long labeling duration would spoil the ability to depict the early phase of passage through the arterial system. Therefore, pCASL with a much shorter labeling duration, or pulsed ASL (PASL) techniques, are currently the preferred labeling options for 4D‐MRA. The second challenge is that the long series of excitation pulses of the commonly used Look‐Locker readout for multi‐PLD acquisition 7 would consume too much of the longitudinal magnetization of labeled blood, thereby severely affecting the SNR of perfusion images acquired afterward.
We propose the use of time‐encoded pCASL (te‐pCASL) as a solution to both of these mentioned challenges 8, 9. Unlike the Look‐Locker approach, te‐pCASL enables acquisition of dynamic images with multiple PLDs without repeating the readout module. Instead, the long pCASL labeling is encoded according to, for example, the Hadamard matrix (Fig. 1 in 8), from which multiple images with different PLDs can be reconstructed by applying a decoding process. Previously, this technique has been used for generating arterial transit time maps as well as perfusion images with high SNR from a single sequence 11, 12.
Figure 1.
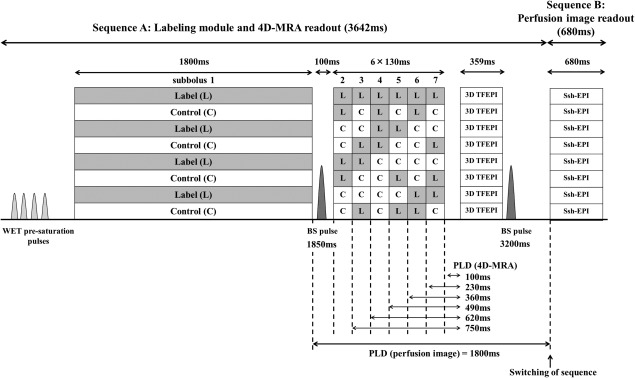
Sequence diagram of the simultaneous acquisition of 4D‐MRA and perfusion imaging using time‐encoded pCASL. Optimal timing of two background suppression pulses was obtained by simulations based on the Bloch equation.
In this article, we present a novel technique for the simultaneous acquisition of 4D‐MRA and perfusion images using te‐pCASL. Part of this study was presented previously in abstract format 13.
METHODS
Implementation of the Simultaneous Acquisition Scheme
In te‐pCASL, image acquisition with multiple PLDs (e.g., N) is achieved by dividing a long pCASL labeling module into N segments and by changing the condition (label or control) of each segment over N+1 repeated acquisitions according to, for example, a Hadamard matrix of order N+1 (Fig. 1 in 8). By using an appropriate decoding step, N ASL images can be reconstructed, in which only the labeling from a single segment, also known as subbolus, will contribute to the signal of each ASL image. Each ASL image will therefore have a unique combination of labeling duration and PLD.
The two challenges that were mentioned previously can be solved by use of te‐pCASL. First, it is possible to assign different labeling duration to each subbolus, so that sufficiently long labeling duration is used for perfusion imaging, while using a short labeling duration at multiple PLDs for 4D‐MRA. Second, because the temporal information is already encoded during labeling, only a single‐phase readout module is needed to generate multiphase images, unlike the commonly used Look‐Locker readout that relies on multiple repetitions of the readout module. This means that only a single readout module is needed for 4D‐MRA acquisition, thereby reducing the number of radiofrequency excitation pulses and thus preserving most of the encoded longitudinal magnetization for acquisition of the perfusion image.
Figure 1 shows the sequence design as used in this study. The encoding scheme of the pCASL labeling module was based on a Hadamard matrix of order 8. The first subbolus (subbolus 1) was optimized for perfusion imaging, and therefore the duration was set to 1800 ms. The other six subboli (subboli 2–7) were optimized for 4D‐MRA acquisition, with their duration set to 130 ms. There is a pause of 100 ms between the first and second subbolus, to allow application of a background suppression pulse and to allow a sufficiently long PLD for perfusion imaging. After the entire labeling module, a multishot 3D turbo‐field echo‐planar imaging (TFEPI) readout 14, 15 is executed with high spatial resolution for the 4D‐MRA data acquisition, which is directly followed by a single‐shot, multislice EPI readout with low resolution for perfusion imaging by using the interleaved scanning approach as described previously 16. In the TFEPI sequence, an EPI readout is performed in between excitation pulses of TFE sequence, which helps to reduce the number of radiofrequency excitation pulses further (i.e., by a factor of number of acquired k‐lines after a single excitation pulse (EPI factor)), thereby further preserving longitudinal magnetization for perfusion imaging. Between the 4D‐MRA and perfusion imaging readout, a second background suppression pulse was applied. For both background suppression pulses, frequency offset corrected inversion (FOCI) pulse 17 were used to achieve a sharper spatial inversion profile than conventional hyperbolic‐secant pulses, thereby limiting the effect of the background suppression pulses on fresh blood approaching the labeling plane for subsequent subboli.
In Vivo Healthy Volunteer Study
The study was approved by the local institutional review board, and all volunteers provided written informed consent before inclusion in this study. A total of six volunteers (male = 4, female = 2, mean age = 39 years (range, 21–58 years)) without known cerebrovascular disease participated in the study.
The reduction of the labeled magnetization caused by the readout of 4D‐MRA will be referred to as “saturation effects” throughout this paper. To find the optimal excitation flip angle for 4D‐MRA that provides a compromise between sufficient signal for the 4D‐MRA and acceptable saturation effects to obtain perfusion images with sufficient quality, the flip angle of the 4D‐MRA readout was varied (5, 7.5, 10, 12.5, and 15°), while keeping the parameters for perfusion imaging unchanged.
Optimal timing of background suppression pulses was obtained by Bloch equation simulations in MATLAB (MathWorks, Natick, MA), taking into account the effects from both the prelabeling saturation pulse and the excitation pulses of the 4D‐MRA acquisition, assuming that all transverse magnetization is spoiled before the next excitation pulse is applied. T1 value for gray matter, white matter, and cerebrospinal fluid were assumed to be 1200, 800 and 4300 ms, respectively 10, 18, 19. The same timings were used for all sequences independent of the used flip angle of the TFE readout, to keep sequences as comparable as possible. Criteria for optimal background suppression were that all longitudinal magnetization of gray matter, white matter, and cerebrospinal fluid should be minimal (albeit above zero) for all flip angles at the moment of the acquisition of the first slice from the multislice 2D perfusion readout. Furthermore, the number of background suppression pulses was set to two, as a compromise between the level of background suppression and loss of label as a result of the inclusion of inversion pulses 5.
All MR scans were performed on a Philips 3T Achieva‐TX scanner (Philips, Best, the Netherlands) using a 32‐channel head coil. For 4D‐MRA, a multishot 3D‐TFEPI sequence (36 excitation pulses, of which the first two were startup pulses, with an EPI factor of 7) was used with an effective echo time of 5.3 ms. The field of view was 230 × 230 mm, and scan matrix was 128 × 128, which was reconstructed as 256 × 256 by zero‐filling. Sixty slices were acquired with a thickness of 1.8 mm and reconstructed as 120 slices with 0.9 mm thickness; however, 10 slices at the top and bottom of the volume were discarded (20% oversampling). Sensitivity encoding was applied in two directions with a factor of 2.4 in the anterior–posterior (AP) direction and 1.8 in the feet–head direction. Directly after the 3D‐TFEPI readout providing the 4D‐MRA images, a multislice single‐shot EPI sequence was performed for perfusion imaging with field of view = 240 × 240 mm, scan matrix = 80 × 80, 17 slices with thickness of 6.0 mm, echo time of 16 ms, sensitivity‐encoding factor of 2.1 in the AP direction, and excitation flip angle of 90°. The repetition time and total acquisition time of the combined sequence for 4D‐MRA and perfusion imaging were 4322 ms and 4 min 46 s, respectively. With these imaging parameters, the number of shots needed to fill the complete k‐space for 3D‐TFEPI was eight, which implies that the complete Hadamard matrix was repeated eight times. This resulted in a total of 64 acquisitions for perfusion imaging, which should provide an SNR comparable to a traditional pCASL perfusion scan with 32 averages. For quantification of CBF, an M0 image was acquired using identical acquisition parameters as the perfusion image, but without labeling, presaturation and background suppression pulses, and with the repetition time set to 2000 ms and four averages. For a quantitative comparison of the obtained CBF values, a traditional perfusion‐only pCASL scan with identical geometric parameters was acquired with labeling duration as well as PLD set to 1800 ms. Background suppression pulses were applied at 1830 and 3150 ms. With 32 averages, the total scan time of the traditional pCASL was 4 min 54 s. In this study, the total acquisition of the combined sequence of 4D‐MRA and perfusion image was similar to the acquisition time of the traditional pCASL scan.
Image Processing of In Vivo Data
Image processing was performed offline using SPM 12 and custom‐written scripts working in MATLAB.
All single‐shot EPI time series for perfusion imaging, including the traditional pCASL scans, were motion‐corrected and realigned to the M0 image. Subsequently, the 3D‐TFEPI images and the realigned single‐shot EPI images of the simultaneous acquisition scheme were decoded by applying the proper Hadamard matrix, thereby providing 4D‐MRA and multiple PLD perfusion images. From the 4D‐MRA data sets, maximum‐intensity projection images were generated for each temporal phase in sagittal, transverse, and coronal directions. In this study, the first subbolus image was disregarded for 4D‐MRA, whereas only the single‐shot EPI images of the first subbolus were taken into account as perfusion images. For the traditional pCASL scan, subtraction of the labeled images from the control images was performed to obtain the perfusion images.
The CBF was calculated in accordance with the recommendation from the recent ASL white paper 5. For perfusion images acquired using the te‐pCASL simultaneous acquisition sequence, however, an additional cosine term was added to correct for the saturation effects of the MRA readout by assuming that all transverse magnetization is spoiled before the next excitation pulse is applied, as follows:
| (1) |
where ΔM is the perfusion signal intensity, M0 is the signal intensity of the M0 image, λ is the brain/blood partition coefficient in mL/g, T1,blood is the longitudinal relaxation time of blood in seconds, α is the labeling efficiency, τ is the labeling duration, θ is the flip angle for the 4D‐MRA acquisition, and β is the number of excitation pulses per shot. Multislice acquisitions (as also used in this study) result in a slice‐dependent PLD, which is corrected for in the quantification by prolonging the PLD by 40 ms for each subsequent slice.
In addition, the temporal SNR (tSNR) of each perfusion image was calculated as the mean perfusion signal divided by the standard error of the perfusion signal over the signal averages.
A GM mask was generated from the M0 image using the segmentation tool on SPM 12 with the threshold set to 60% a priori probability, and used to obtain the mean GM CBF and mean GM tSNR values. The normalized difference of mean GM CBF value over traditional pCASL was calculated as
| (2) |
where CBFsimul and CBFtrad are the mean GM CBF value obtained by the simultaneous acquisition and the traditional pCASL sequence, respectively. In addition, paired t‐tests were performed using SPSS Statistics version 23 (IBM Corp, Armonk, NY), and the mean GM CBF and tSNR values obtained from the simultaneous acquisition sequence were compared with the traditional pCASL, in which significance was set at P < 0.05 using the Bonferroni method to correct for multiple comparisons.
RESULTS
Bloch equation simulations provided the optimal timings of the two background suppression pulses (1850 and 3200 ms), by taking both the effects from the prelabeling saturation pulses as well as the excitation pulses of the 4D‐MRA acquisition into account, as illustrated in Figures 1 and 2.
Figure 2.
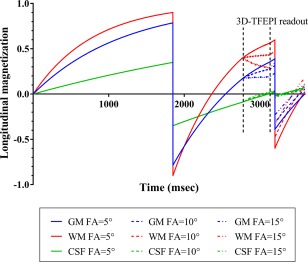
Bloch equation simulation results showing the evolution of the longitudinal magnetization during the sequence. For clarity, results with only flip angles of 5, 10, and 15° are shown.
Figure 3 shows the mean values of tSNR from the GM masked perfusion images acquired with the simultaneous acquisition sequence and the traditional pCASL as a reference, and representative CBF maps acquired with each setting. All flip angles (5, 7.5, 10, 12.5, and 15°) showed a statistically significant decrease of tSNR as compared with the traditional pCASL. Moreover, as Table 1 indicates, there was a significant overestimation of the mean GM CBF values as obtained by the highest flip angles (10, 12.5, and 15°) when compared with the values as acquired by traditional pCASL, which suggests that the correction for the saturation effects of the 3D‐TFEPI excitation pulses was especially not accurate for these flip angles. Although some overestimation was observed also for lower flip angles (5 and 7.5°), these differences did not reach statistical significance. Furthermore, some of the overestimation is caused by decoding artifacts in volunteer 4 (a in Table 1), as illustrated in Figure 4 (high arterial signal indicated with arrows) and elaborated further subsequently. Figure 5 shows that this observed deviation is dependent on the position of the slice. For all flip angles, overestimation was observed for either or both top and bottom slices, whereas larger deviations were observed for the higher flip angles.
Figure 3.
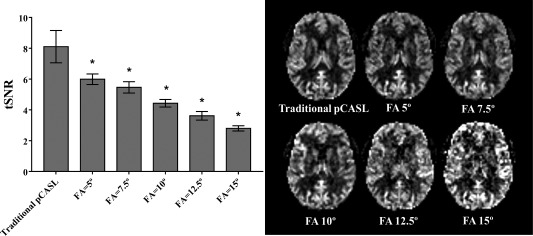
Temporal SNR for the perfusion images as acquired with the combined sequence with different excitation flip angles (FA) of the 4D‐MRA acquisition and traditional pCASL. Values are averaged over the whole‐brain GM. Error bars show the standard deviation over six volunteers (*P < 0.05 after Bonferroni correction). Representative CBF maps as acquired with each setting are also shown.
Table 1.
Mean GM CBF Values From Each Volunteer for the Different Excitation Flip Angles of the 4D‐MRA and Their Normalized Difference Over CBF Value Acquired by Traditional pCASL
| Volunteer 1 | Volunteer 2 | Volunteer 3 | Volunteer 4 | Volunteer 5 | Volunteer 6 | Mean/Standard deviation (P value) | |
|---|---|---|---|---|---|---|---|
| Traditional pCASL | 45.24 | 43.71 | 42.79 | 37.97 | 56.24 | 44.76 | 45.12/6.04 |
| Flip angle = 5° | 47.22 (4.4%) | 45.40 (3.9%) | 42.13 (−1.5%) | 40.80 (7.5%) | 50.88 (−9.5%) | 52.26 (16.8%) | 46.45/4.60 (0.476) |
| Flip angle = 7.5° | 47.92 (5.9%) | 47.18 (7.9%) | 43.57 (1.8%) | 50.30a (32.5%) | 56.24 (0.0%) | 51.95 (16.1%) | 49.53/4.36 (0.067) |
| Flip angle = 10° | 54.23 (19.9%) | 50.30 (15.1%) | 45.19 (5.6%) | 49.00 (29.0%) | 60.31 (7.2%) | 54.43 (21.6%) | 52.24/5.25 (0.004)* |
| Flip angle = 12.5° | 51.17 (13.1%) | 54.16 (23.9%) | 57.78 (35.0%) | 53.64 (41.3%) | 64.86 (15.3%) | 61.74 (37.9%) | 57.23/5.25 (0.001)* |
| Flip angle = 15° | 66.40 (46.8%) | 67.04 (53.4%) | 59.04 (38.0%) | 61.49 (61.9%) | 72.46 (28.8%) | 61.42 (37.2%) | 64.64/4.93 (0.000)* |
Note: P values were obtained by paired t‐tests for each flip angle of 4D‐MRA acquisition compared with the traditional pCASL, in which significance (*) was set at P < 0.05 using the Bonferroni correction. SD, standard deviation
Increased CBF value suggesting an overestimation as a result of the residual arterial signal shown in Figure 4 (arrows).
Figure 4.
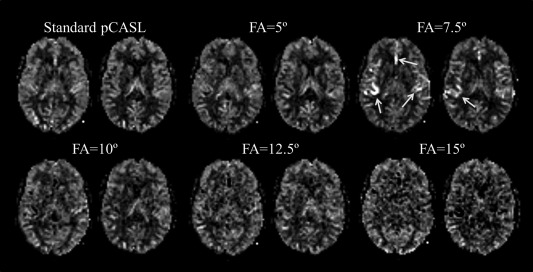
Cerebral blood flow maps obtained from volunteer 4 in Table 1. Arrows indicate shine‐through artifacts of signal from the angiographic subboli.
Figure 5.
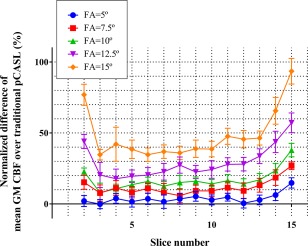
Normalized difference of the mean GM CBF of the combined sequence as compared with the one obtained by the traditional pCASL sequence. Larger deviations are observed for the top and bottom slices. As a result of the applied motion correction, some parts of the top and bottom slices provided incomplete data; therefore the first and last two slices were not included in the graph.
Figure 4 shows the CBF maps obtained from one of the volunteers (volunteer 4 in Table 1), in which the CBF map with flip angle of 7.5° showed high arterial signal, which is presumably caused by residual ASL signal within the arteries from other subboli (for 4D‐MRA acquisition) that was supposed to be canceled out by decoding. The overestimation of GM CBF when using a flip angle of 7.5° could be partly attributed to the residual arterial signal in this volunteer (a in Table 1). More detailed discussion about the residual ASL signal is provided within the discussion.
Representative 4D‐MRA images acquired with flip angles of 5, 7.5, and 10° are shown in Figure 6. With a flip angle of 5°, visualization of the peripheral arteries was found to be weak, which obscured depiction of the more distal parts when compared with the images obtained with a flip angle of 7.5°. In contrast, increasing the flip angle to 10° or higher (not shown) did not improve the visualization of the peripheral arteries, although the signal intensity within the larger arteries was increased. In addition, some volunteers showed ghosting of residual arterial signal from the M1 part of the middle cerebral artery from the earlier phases onto later ones (arrows in Fig. 7) when using higher flip angles, which is presumed to be the same phenomenon as shown in Figure 4. In this study, a flip angle of 7.5° was found to be an optimal compromise to obtain a sufficient image quality of CBF map, while still achieving reasonable visualization of the arteries (Fig. 8).
Figure 6.
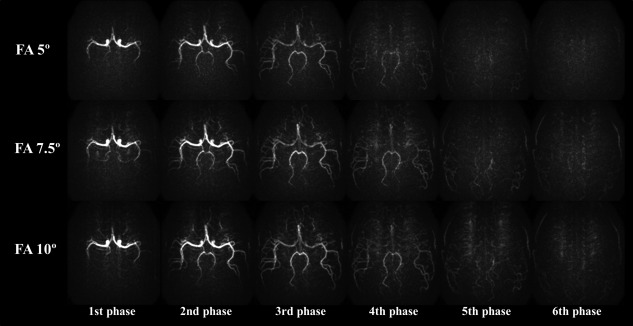
Representative MRA images acquired with flip angles of 5, 7.5, and 10°. With a flip angle of 5°, visualization of the peripheral arteries was found to be weak compared with the images obtained with a flip angle of 7.5°. Although a flip angle of 10° increased the signal intensity of arteries, visualization of the distal parts of arteries was not improved.
Figure 7.
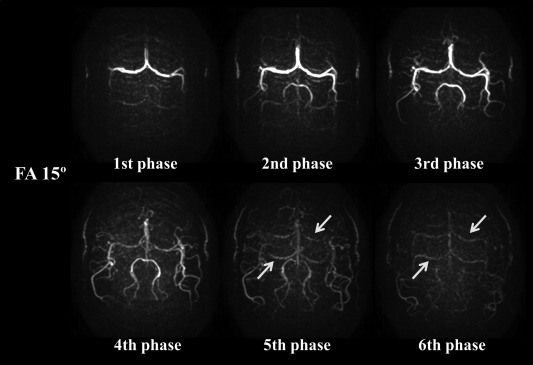
Representative MRA images acquired with a flip angle of 15°. Arrows indicate ghosting of residual arterial signal from the M1 part of the middle cerebral artery as present during the earlier phases. Ghosting is especially seen when using higher flip angles (FA) for the 3D‐TFEPI readout.
Figure 8.
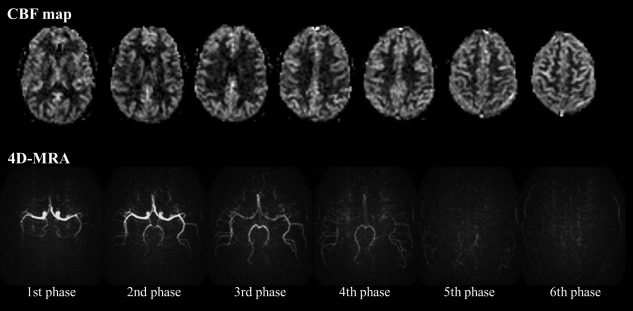
Representative 4D‐MRA and perfusion images using flip angle (FA) of 7.5°, showing a suitable compromise between sufficient image quality of the CBF maps and visualization of the passage of the label through the arterial system.
DISCUSSION
In this manuscript, we proposed a new technique that allows simultaneous acquisition of perfusion and 4D‐MRA images in a single scan. By using te‐pCASL with optimized settings of the labeling duration of the subboli, sufficient labeling duration and PLD can be achieved for perfusion imaging, whereas sufficient temporal resolution to allow visualization of the early arterial phase is obtained for 4D‐MRA with short labeling duration and PLD. Also, by the use of te‐pCASL for obtaining dynamic information instead of the more traditional Look‐Locker approach, severe saturation of the labeled blood signal is prevented, thereby still allowing perfusion imaging with sufficient image quality.
In this study, a statistically significant decrease in tSNR as a result of saturation effects was observed for all flip angles. Moreover, the quantitative mean GM CBF values tended to be higher than those acquired with traditional pCASL, which is most probably arising from overcorrection of the saturation effects and could be explained by two possible reasons. First, when some labeled blood would not experience all excitation pulses of the 4D‐MRA readout (e.g., because the imaging area was not yet reached) while contributing to the perfusion signal, correction based on all excitation radiofrequency pulses would cause an overcorrection. In this study, however, there is an interval of approximately 1 s between the end of the perfusion labeling (subbolus 1) and the start of 4D‐MRA acquisition, which is presumably sufficient for all, or at least the vast majority, of the labeled blood to arrive at the imaging volume. The second, and more plausible, reason is that there is a small, but noticeable, discrepancy between the intended flip angle and the nominal flip angle for the volume‐selective excitation pulses of the 4D‐MRA readout. Although the saturation effects are corrected for by the cosine term in the denominator of Equation (1), such a discrepancy in the nominal flip angle is prone to be larger for higher flip angles, thereby resulting in a larger overcorrection of CBF, especially for the highest flip angles of 10, 12.5, and 15°. Although overestimation was also observed with lower flip angles of 5 and 7.5°, it was relatively small and no longer statistically significant. Nonideal excitation profiles would lead to a larger discrepancy in nominal flip angle near the edges of the imaging volume, which was indeed also the location where the most severe overestimation was observed (see Fig. 5). Pulses with better excitation profile or inclusion of the excitation profile into the postprocessing could potentially alleviate these issues, but the use of lower flip angles for 4D‐MRA is suggested not only to reduce overestimation of CBF values, but also to avoid other imaging artifacts (see arrows in Fig. 7).
In te‐pCASL, the acquired images (i.e., before decoding) contain the combined information of static tissue as well as the cumulative effect of the labeling/control conditions from all subboli. During the decoding process, the ASL signal from only one certain subbolus is supposed to add constructively, whereas signals from all other subboli and static tissue are expected to be canceled out. However, because of signal fluctuations, residual ASL signal from other subboli could appear in other phases as a “shine‐through effect.” Such shine‐through effects were most evident as a ghosting of arterial signal in the peripheral and perfusion phases, probably because of two reasons. First, changes in labeling efficiency due to pulsatile flow at the labeling plane causes slight signal fluctuations, preventing complete cancelation of ASL signal from other subboli during decoding. Because the ASL signal has not attenuated much as a result of relaxation in the early arterial phase, and the signal is concentrated in the arteries with little dispersion, the shine‐through effects of angiographic signal (e.g., the M1 part of the middle cerebral artery) have a larger risk of causing a shine‐through effect to later phases that have a much lower, perfusion type of signal distribution. Another possible reason is also related to the pulsatile flow, although not at the labeling plane, but at the arteries themselves. In ASL‐based 4D‐MRA, the control condition shows high signal intensities in the arteries as a result of inflow effects. This arterial signal intensity could, however, also be affected by pulsation and therefore show signal fluctuations, which causes incomplete cancelation of signal from other subboli. A high flip‐angle readout will amplify both of these phenomena; therefore, the use of relatively small flip angles is recommended for the 4D‐MRA part of the proposed sequence.
Although segmented 3D sequences (e.g., 3D GRASE and 3D stack of spirals) are preferable readout modules for traditional ASL scans, because of optimal background suppression over the whole imaging volume 5, te‐pCASL results in an increased temporal footprint, making segmented 3D readout acquisitions more prone to motion artifacts 20, while single‐shot 3D readout approaches suffer from blurring. Therefore, single‐shot multislice EPI sequences were used in this study, even though development of improved 3D sequences that allow single‐shot readout (or with a low number of segments), while avoiding blurring, could bring further improvements to our approach.
For acquisition of 4D‐MRA, an EPI factor of 7 was chosen based on pilot studies optimizing scan time and image quality. The use of TFEPI (segmented EPI) sequence not only reduced the total scan time but also limited the number of radiofrequency excitation pulses, thereby preserving more labeled longitudinal magnetization for perfusion imaging. In this study, no obvious artifacts originating from off‐resonance effects near the skull base were observed. In subjects with relatively large paranasal sinuses, however, it is known that off‐resonance artifacts may occur, which could require special attention.
There are three important limitations of the proposed approach that should be mentioned. First, the temporal resolution of te‐pCASL technique is determined by the durations of the labeling subboli, in which too short subboli (i.e., a higher temporal resolution) would create too little labeled blood to accurately visualize smaller arteries, especially in later phases when label has already decayed to some extent. In this study, the temporal resolution was set to 130 ms as a compromise between temporal resolution and visualization of smaller arteries. This temporal resolution compares well with literature in which clinical studies reported good to excellent agreement between ASL‐based 4D‐MRA with temporal resolution of 150 to 300 ms and digital subtraction angiography in Moyamoya disease 3, dural arteriovenous fistulas 1, and collateral circulation in steno‐occlusive diseases 21.
The second limitation is that the excitation coverage for the 4D‐MRA readout should be the same as or larger than the coverage of the perfusion images; otherwise the saturation effects on the perfusion image would differ among slices, which would require more complicated correction approaches of these saturation effects. To achieve whole‐brain coverage within the limited acquisition time, the spatial resolution of the 4D‐MRA readout of this technique is still lower than the commonly used 3D time‐of‐flight MRA, as well as ASL‐based 4D‐MRA techniques that have the sole goal of acquiring dynamic angiographic images. This originated from our design criterion of achieving a comparable scan time for the combined sequence to a typical pCASL perfusion scan (shorter than 5 min). Therefore, the 4D‐MRA acquired with this technique is not supposed to act as a replacement of 3D‐MRA, and separate acquisition of high‐resolution 3D time‐of‐flight MRA is recommended when necessary. In addition, when hemodynamic information of smaller arteries is required (such as visualization of a small feeding artery to an arteriovenous malformation 22, dural arteriovenous fistulas 1 or small collateral arteries 21), independent 4D‐MRA with higher spatial resolution, would be preferred. Instead, the main benefit of the proposed technique is that dynamic, macroscopic hemodynamic information can be added to conventional, static perfusion imaging while still keeping sufficient quality of the perfusion images (Figs. 3 and 8).
Finally, investigation was limited to healthy volunteers in this study. Further validation of this approach in patients with cerebrovascular disease is needed before clinical use is undertaken.
CONCLUSIONS
In summary, we have presented a novel technique for simultaneous acquisition of perfusion and 4D‐MRA images. In this study, the use of te‐pCASL with optimized labeling duration of the subboli provided sufficient labeling duration and PLD for perfusion imaging, although sufficient temporal resolution to visualize the early arterial phase was obtained for 4D‐MRA. Reduction of the saturation effects from excitation pulses for 4D‐MRA acquisition on the perfusion image was achieved by use of te‐pCASL as well as 3D‐TFEPI sequence with relatively low excitation flip angles for 4D‐MRA, thereby allowing the additional acquisition of 4D‐MRA, while maintaining sufficient image quality of the CBF maps.
This research was supported by the EU under the Horizon2020 program (project: CDS‐QUAMRI).
Yuriko Suzuki is a former employee of Philips. Michael Helle, Peter Koken, and Marc Van Cauteren are currently employed by Philips.
The copyright line for this article was changed on 21 March 2018 after original online publication.
REFERENCES
- 1. Iryo Y, Hirai T, Kai Y, Nakamura M, Shigematsu Y, Kitajima M, Azuma M, Komi M, Morita K, Yamashita Y. Intracranial dural arteriovenous fistulas: evaluation with 3‐T four‐dimensional MR angiography using arterial spin labeling. Radiology 2014;271:193–199. [DOI] [PubMed] [Google Scholar]
- 2. Suzuki Y, Fujima N, Ogino T, Meakin JA, Suwa A, Sugimori H, Van Cauteren M, van Osch MJ. Acceleration of ASL‐based time‐resolved MR angiography by acquisition of control and labeled images in the same shot (ACTRESS). Magn Reson Med 2018;79:224–233. [DOI] [PMC free article] [PubMed] [Google Scholar]
- 3. Uchino H, Ito M, Fujima N, Kazumata K, Yamazaki K, Nakayama N, Kuroda S, Houkin K. A novel application of four‐dimensional magnetic resonance angiography using an arterial spin labeling technique for noninvasive diagnosis of Moyamoya disease. Clin Neurol Neurosurg 2015;137:105–111. [DOI] [PubMed] [Google Scholar]
- 4. Yan L, Salamon N, Wang DJ. Time‐resolved noncontrast enhanced 4‐D dynamic magnetic resonance angiography using multibolus TrueFISP‐based spin tagging with alternating radiofrequency (TrueSTAR). Magn Reson Med 2014;71:551–560. [DOI] [PMC free article] [PubMed] [Google Scholar]
- 5. Alsop DC, Detre JA, Golay X, et al. Recommended implementation of arterial spin‐labeled perfusion MRI for clinical applications: a consensus of the ISMRM perfusion study group and the European consortium for ASL in dementia. Magn Reson Med 2015;73:102–116. [DOI] [PMC free article] [PubMed] [Google Scholar]
- 6. Alsop DC, Detre JA. Reduced transit‐time sensitivity in noninvasive magnetic resonance imaging of human cerebral blood flow. J Cereb Blood Flow Metab 1996;16:1236–1249. [DOI] [PubMed] [Google Scholar]
- 7. Gunther M, Bock M, Schad LR. Arterial spin labeling in combination with a look‐locker sampling strategy: inflow turbo‐sampling EPI‐FAIR (ITS‐FAIR). Magn Reson Med 2001;46:974–984. [DOI] [PubMed] [Google Scholar]
- 8. Wells JA, Lythgoe MF, Gadian DG, Ordidge RJ, Thomas DL. In vivo Hadamard encoded continuous arterial spin labeling (H‐CASL). Magn Reson Med 2010;63:1111–1118. [DOI] [PubMed] [Google Scholar]
- 9. Guenther M. Highly efficient accelerated acquisition of perfusion inflow series by Cycled Arterial Spin Labeling. In Proceedings of the 16th Annual Meeting of ISMRM, Berlin, Germany, 2007. Abstract 380.
- 10. Rydhog AS, van Osch MJ, Lindgren E, Nilsson M, Latt J, Stahlberg F, Wirestam R, Knutsson L. Intravoxel incoherent motion (IVIM) imaging at different magnetic field strengths: what is feasible? Magn Reson Imaging 2014;32:1247–1258. [DOI] [PubMed] [Google Scholar]
- 11. Teeuwisse WM, Schmid S, Ghariq E, Veer IM, van Osch MJ. Time‐encoded pseudocontinuous arterial spin labeling: basic properties and timing strategies for human applications. Magn Reson Med 2014;72:1712–1722. [DOI] [PubMed] [Google Scholar]
- 12. Dai W, Shankaranarayanan A, Alsop DC. Volumetric measurement of perfusion and arterial transit delay using hadamard encoded continuous arterial spin labeling. Magn Reson Med 2013;69:1014–1022. [DOI] [PMC free article] [PubMed] [Google Scholar]
- 13. Suzuki Y, Teeuwisse WM, Schmid S, Koken P, Van Cauteren M, Helle M, van Osch MJP. Simulatenous acquisition of perfusion maps and 4D MR angiography by means of arterial spin labeling MRI. In Proceedings of the 23th Annual Meeting of ISMRM, Milan, Italy, 2014. Abstract 720.
- 14. Wielopolski PA, Adamis M, Prasad P, Gaa J, Edelman R. Breath‐hold 3D STAR MR angiography of the renal arteries using segmented echo planar imaging. Magn Reson Med 1995;33:432–438. [DOI] [PubMed] [Google Scholar]
- 15. Gai ND, Talagala SL, Butman JA. Whole‐brain cerebral blood flow mapping using 3D echo planar imaging and pulsed arterial tagging. J Magn Reson Imaging 2011;33:287–295. [DOI] [PMC free article] [PubMed] [Google Scholar]
- 16. Henningsson M, Mens G, Koken P, Smink J, Botnar RM. A new framework for interleaved scanning in cardiovascular MR: application to image‐based respiratory motion correction in coronary MR angiography. Magn Reson Med 2015;73:692–696. [DOI] [PubMed] [Google Scholar]
- 17. Ordidge RJ, Wylezinska M, Hugg JW, Butterworth E, Franconi F. Frequency offset corrected inversion (FOCI) pulses for use in localized spectroscopy. Magn Reson Med 1996;36:562–566. [DOI] [PubMed] [Google Scholar]
- 18. Lu H, Nagae‐Poetscher LM, Golay X, Lin D, Pomper M, van Zijl PC. Routine clinical brain MRI sequences for use at 3.0 Tesla. J Magn Reson Imaging 2005;22:13–22. [DOI] [PubMed] [Google Scholar]
- 19. Rooney WD, Johnson G, Li X, Cohen ER, Kim SG, Ugurbil K, Springer CS Jr. Magnetic field and tissue dependencies of human brain longitudinal 1H2O relaxation in vivo. Magn Reson Med 2007;57:308–318. [DOI] [PubMed] [Google Scholar]
- 20. van Osch MJ, Teeuwisse WM, Chen Z, Suzuki Y, Helle M, Schmid S. Advances in arterial spin labelling MRI methods for measuring perfusion and collateral flow. J Cereb Blood Flow Metab 2017. doi: 10.1177/0271678X17713434. [DOI] [PMC free article] [PubMed] [Google Scholar]
- 21. Iryo Y, Hirai T, Nakamura M, et al. Collateral circulation via the circle of Willis in patients with carotid artery steno‐occlusive disease: evaluation on 3‐T 4D MRA using arterial spin labelling. Clin Radiol 2015;70:960–965. [DOI] [PubMed] [Google Scholar]
- 22. Yu S, Yan L, Yao Y, Wang S, Yang M, Wang B, Zhuo Y, Ai L, Miao X, Zhao J, Wang DJ. Noncontrast dynamic MRA in intracranial arteriovenous malformation (AVM), comparison with time of flight (TOF) and digital subtraction angiography (DSA). Magn Reson Imaging 2012;30:869–877. [DOI] [PMC free article] [PubMed] [Google Scholar]