

Abstract
Aims
To evaluate the clinical and patient‐reported outcomes and healthcare utilization and costs associated with patient‐reported hypoglycaemia in US adults with type 2 diabetes (T2D) treated with basal insulin.
Materials and methods
This was an observational, cross‐sectional, survey‐based study of adults with T2D on basal insulin ± oral antidiabetes drugs (OADs) or rapid‐acting/premixed insulin, who had in the past ever experienced hypoglycaemia, using US data from the National Health and Wellness Survey. Eligible patients were categorized as having no hypoglycaemia (38.7%), non‐severe hypoglycaemia (55.1%), or severe hypoglycaemia (6.2%) in the preceding 3 months. Outcomes included health‐related quality of life (HRQoL), work productivity and activity impairment, healthcare resource utilization, and estimated direct and indirect costs. Multivariable regression models were performed to control for patient characteristics.
Results
Patients who experienced severe hypoglycaemia had significantly (P < .05) lower HRQoL scores, greater overall impairment of work productivity and activity, greater healthcare resource utilization, and higher costs compared with those who experienced non‐severe or no hypoglycaemia. Patients with non‐severe hypoglycaemia also reported an impact on the number of provider visits, indirect costs, and HRQoL.
Conclusions
Patients with T2D using basal insulin ± OADs or rapid‐acting/premixed insulin in the United States who experienced severe hypoglycaemia had greater impairment of activity and work productivity, utilized more healthcare resources, and incurred higher associated costs than those with non‐severe or no hypoglycaemia. The study also demonstrated the impact that non‐severe hypoglycaemic events have on economic and HRQoL outcomes. Reducing the incidence and severity of hypoglycaemia could lead to clinically meaningful improvements in HRQoL and may result in lower healthcare utilization and associated costs.
Keywords: hypoglycaemia, health‐related quality of life, work productivity, activity impairment, type 2 diabetes, basal insulin
1. INTRODUCTION
Diabetes is a chronic, progressive disease with an increasing prevalence worldwide1 and in the United States.2 The economic impact of diabetes is substantial,3 with indirect costs of diabetes accounting for an estimated 36% of the total economic burden in North America.4 Type 2 diabetes (T2D) is generally initially managed with lifestyle interventions and oral antidiabetes drugs (OADs), but many patients will eventually require insulin therapy to maintain good glycaemic control.5, 6
Some anti‐hyperglycaemic agents, such as sulphonylureas and exogenous insulin, can cause hypoglycaemia.7 The psychological impact of hypoglycaemia can affect adherence to treatment, leading to missed or incorrect dosage,8 with fear of hypoglycaemia and changes in self‐care behaviour possibly compromising glycaemic control.9 Research has also shown that, among patients with T2D in the United States, those who experienced hypoglycaemia were more likely to report having lower health‐related quality of life (HRQoL) and higher rates of diabetes‐related emergency room (ER) and physician visits.10 For example, the Centers for Disease Control and Prevention report a total of 245 000 ER visits by adults with diabetes in the United States attributed to hypoglycaemia in 2014.2 Hypoglycaemia‐related medical expenditure and hospitalizations are associated with considerable costs and represent a major contribution to healthcare expenditures in the United States11 and worldwide.1 US patients who experience hypoglycaemia within 6 months of initiating basal insulin are also at an increased risk of basal insulin therapy discontinuation (68.1% of patients with hypoglycaemia within 6 months vs 53.9% of those without hypoglycaemia within 6 months)12 and have significantly higher healthcare resource utilization and costs than those without hypoglycaemia ($13 662 vs $7506).13
Hypoglycaemic symptoms and symptom severity also have an adverse effect on patients' ratings of their HRQoL.14 It is therefore important to understand the burdens of hypoglycaemia from the patient perspective, including those of non‐severe hypoglycaemic episodes that do not require assistance from a healthcare provider. Studies of the burden of hypoglycaemia in T2D often use data captured from administrative claims via International Classification of Diseases Ninth Revision Clinical Modification (ICD‐9‐CM) codes.11, 15 In such studies, the setting of the event is often used as a proxy for the severity of the event (ie, events requiring assistance from a healthcare professional, ER visits, or hospitalizations are considered the more severe events),16 which may result in an underestimation of the true incidence and burden of hypoglycaemia, especially mild‐to‐moderate hypoglycaemia.17, 18 Additionally, while a number of real‐world database studies have reported costs associated with severe hypoglycaemia,19, 20 few studies have investigated the direct or indirect burden of self‐reported, non‐severe hypoglycaemia that is managed by the patient themselves. This study was conducted to evaluate, from the patient's perspective, the clinical and patient‐reported outcomes, as well as healthcare utilization and costs, associated with patient‐reported severe and non‐severe hypoglycaemia in US patients with T2D using basal insulin ± OADs or rapid‐acting/premixed insulin.
2. MATERIALS AND METHODS
2.1. Study design
This was an observational, cross‐sectional, survey‐based study of adults (age ≥ 18 years) with T2D living in the United States and using basal insulin ± OADs or rapid‐acting/premixed insulin, who reported having ever experienced hypoglycaemia. Data were obtained from the National Health and Wellness Survey (NHWS), an annual, patient‐reported, online survey of demographically representative cross‐sections of the adult populations of 10 countries, including the United States.21, 22 All data are self‐reported directly by participants. For the present study, data for the years 2011, 2012 and 2013 were combined to ensure a sufficiently large sample size for statistical analyses. In the US NHWS, age, gender and race/ethnicity are matched to the demographic profile of the US population (aged ≥18 years) according to the US Bureau of the Census.
The NHWS is reviewed and approved each year by the Essex Institutional Review Board (Lebanon, New Jersey), and informed consent was obtained from participants before its administration. Deduplication was used if a person participated in >1 year of the survey, and only their most recent record was used. In principle, no data are missing from the NHWS results; however, variables that do not apply to a specific respondent are not included. For example, no data on work productivity are included for respondents who report that they are unemployed. Additionally, respondents are permitted to decline to answer some questions concerning demographic variables (eg, income, weight, height). When no data are recorded for a question, the value is recorded as “missing.”
2.2. Respondents
Potential respondents were identified through the general panel of Lightspeed Research, a partner organization of the NHWS that collects digital data from an online consumer panel.23 Specific criteria for inclusion in the study were: age ≥ 18 years, self‐reported diagnosis of T2D, use of a basal insulin with or without the concomitant use of OADs and/or rapid‐acting/premixed insulin, and experience of at least 1 hypoglycaemic event in the past. Included patients were surveyed regarding their experience with hypoglycaemia in the preceding 3 months; non‐severe hypoglycaemia refers to self‐managed events, while severe hypoglycaemia events required third‐party assistance.24 It was possible for a respondent to complete >1 survey over the 3‐year study period; in these instances, only the most recent data for a given respondent were kept.
2.3. Study measures
2.3.1. Demographics and comorbidities
To understand the disease burden associated with hypoglycaemia and evaluate differences between respondents reporting no hypoglycaemia, non‐severe hypoglycaemia or severe hypoglycaemia in the preceding 3 months, respondents were compared based on demographics and health history using the variables listed in Appendix S1 in File S1.
2.3.2. Health‐related quality of life
The HRQoL of respondents was assessed using the Medical Outcomes 12‐item Short‐Form Survey Instrument version 2 (SF‐12v2) for the year 201125; and the Medical Outcomes 36‐item Short‐Form Survey Instrument version 2 (SF‐36v2) for 2012 and 2013.26 The SF‐36v2 reports on health status in 8 domains (Physical functioning, Physical role limitations, Bodily pain, General health, Vitality, Social functioning, Emotional role limitations and Mental health), from which 2 summary scores are calculated: the Physical Component Summary (PCS) and the Mental Component Summary (MCS). These are normed to a mean of 50 for the general US population; a higher score indicates better health status. As the SF12‐v2 provides the same metrics as the SF‐36v2, data for all 3 years in the study can be pooled for subsequent analyses.25 In addition to generating summary PCS and MCS scores, the SF‐36v2 can also be used to generate health state utilities by applying the Short‐Form 6 Dimensions (SF‐6D) algorithm, which takes items from the domains of the SF‐36v2.27 Health utility scores from the SF‐6D were derived from the SF‐12v2 or SF‐36v2 for the respective survey years. The SF‐6D health utilities index has interval scoring properties and yields summary scores on a theoretical scale of 0 to 1. Higher scores indicate better health status.
2.3.3. Work productivity
The work productivity of respondents was evaluated using the Work Productivity and Activity Impairment (WPAI) questionnaire (Table 1).28, 29 This is a 6‐item validated instrument that consists of 4 metrics: absenteeism; presenteeism; overall work productivity loss; and activity impairment. Unemployed respondents were not included in evaluations of absenteeism, presenteeism or work productivity loss.
Table 1.
| WPAI questionnaire domain | Description |
|---|---|
| Absenteeism | Percentage of work time missed because of one's health in the past 7 days |
| Presenteeism | Percentage of impairment experienced while at work in the past 7 days because of one's health; reduced on‐the‐job effectiveness |
| Work productivity loss | Overall work impairment estimated as a combination of absenteeism and presenteeism |
| Activity impairment | Percentage of impairment of regular daily activities because of one's health in the past 7 days, other than work at a job |
Abbreviation: WPAI, Work Productivity and Activity Impairment.
The WPAI is a validated, 6‐item, self‐administered questionnaire that quantifies the influence of respondents' general health and disease symptom severity on their work productivity and regular activities during the previous 7 days. Scores from 4 domains are produced. Unemployed respondents were not included in evaluations of absenteeism, presenteeism, or work productivity loss; all respondents provided data for activity impairment; respondents in full‐ or part‐time employment provided data for all 4 domains.
2.3.4. Healthcare resource utilization
Healthcare resource utilization over the previous 6 months was assessed by patient recall of the number of overall provider visits, ER visits and hospitalizations (not necessarily diabetes‐specific; Table 2).
Table 2.
Assessment of healthcare‐resource use visits over the previous 6 months
| Healthcare resource utilization | Survey question |
|---|---|
| Number of provider visits | How many visits did you make to the following traditional healthcare provider(s) in the past 6 months? If you are unsure, please provide your best estimate |
| Number of ER visits | How many times have you been to the emergency room for your own medical conditiona in the past 6 months? |
| Number of hospitalizations | How many times have you been hospitalized for your own medical conditiona in the past 6 months? |
Abbreviation: ER, emergency room.
The term “your own medical condition” was used in the survey questions to ensure that all medical conditions were included, not only type 2 diabetes, and to exclude visits to accompany a friend or relative.
2.3.5. Healthcare costs
Both direct and indirect healthcare costs were calculated to give annualized estimates. Direct costs were based on the costs for an average physician visit, ER visit and hospitalization, determined using the 2012 Medical Expenditure Panel Survey.30 For each respondent, the number of each type of visit was multiplied by 2, to project the annual number of visits, and then multiplied by its average cost. Indirect costs were calculated by estimating wages/salaries for each respondent using 2012 data from the Bureau of Labor Statistics.31 The number of hours missed because of health impairment (absenteeism), and the number of hours being unproductive while at work (presenteeism) because of health impairment during the previous week were each multiplied by the hourly wage rates to provide the total lost wages; these figures were then multiplied by the average number of work weeks in a year (ie, 50 weeks) to obtain annual indirect cost estimates.
2.4. Statistical analyses
Bivariate differences were evaluated between respondents experiencing no, non‐severe or severe hypoglycaemia for respondent demographics and characteristics, health status, healthcare resource use, and healthcare costs. For categorical variables, χ2 tests were used to determine significant differences; one‐way ANOVAs were used for continuous variables.
To analyse whether hypoglycaemia groups (ie, non‐severe vs severe hypoglycaemia with no hypoglycaemia as the reference group for all comparisons) differ on health outcomes, a series of generalized linear models were used to test whether the adjusted means (accounting for covariates) of the outcomes differed between groups. Generalized linear models with identity link functions were used for health status variables as they were normally distributed. Because of a pronounced skew, generalized linear models specifying a negative binomial distribution were used for work productivity and activity impairment, healthcare resource use and cost variables.
Covariates included all variables identified as significantly different between groups in the bivariate analyses, and those identified a priori as clinically important. Specifically, covariates included age, gender, ethnicity, Charlson comorbidity index (CCI; excluding diabetes and diabetes‐related complications), income, body mass index, insurance, exercise, years diagnosed with diabetes, glycated haemoglobin (HbA1c), presence of any diabetes complications, and total number of OADs used. Adjusted means and P values were reported for each model.
3. RESULTS
3.1. Study population
A total of 17 676 unique respondents with T2D were identified from the US NHWS, of whom 2423 met the criteria for inclusion in the study and completed the survey (Figure 1).
Figure 1.
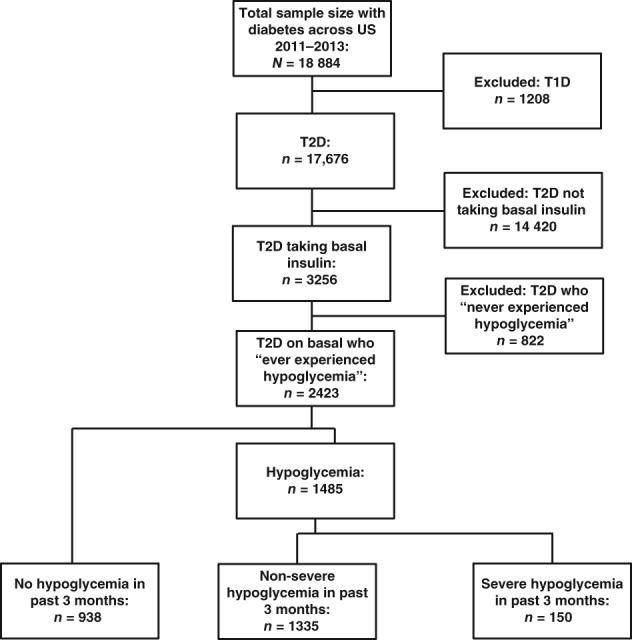
Patient attrition. T2D, type 2 diabetes
3.2. Patient characteristics according to hypoglycaemia category
The demographics, health characteristics and diabetes characteristics of respondents are shown in Table 3. Patients (N = 2423) were categorized into the categories “no hypoglycaemia in the past 3 months” (n = 938; 38.7%), “non‐severe hypoglycaemia in the past 3 months” (n = 1335; 55.1%), and “severe hypoglycaemia in the past 3 months” (n = 150; 6.2%). For both non‐severe and severe hypoglycaemia, 33.3% of episodes were reported as being nocturnal. Glycaemic control was sub‐optimal across the 3 categories, with 47.2%, 48.8% and 44.0% of patients reporting HbA1c ≥ 7.0% in the no, non‐severe and severe hypoglycaemia categories, respectively.
Table 3.
Demographics, health characteristics and diabetes characteristics of respondents using basal insulin ± OADs and/or rapid‐acting/premixed insulin with no hypoglycaemia, non‐severe hypoglycaemia or severe hypoglycaemia
| Patients with T2D using basal insulin | P | |||||||||
|---|---|---|---|---|---|---|---|---|---|---|
| No hypoglycaemia in the past 3 months, N = 938 | Non‐severe hypoglycaemia in the past 3 months, N = 1335 | Severe hypoglycaemia in the past 3 months, N = 150 | Total, N = 2423 | |||||||
| Mean/% | SD/N | Mean/% | SD/N | Mean/% | SD/N | Mean/% | SD/N | |||
| Demographic characteristics | ||||||||||
| Age, years | 60.8a | 11.0 | 61.0a | 10.5 | 55.3b | 13.0 | 60.6 | 11.0 | <.001 | |
| Gender | Male | 62.5% | 586a | 61.2% | 817a | 61.3% | 92a | 62.5% | 1495 | .824 |
| Race/ethnicity | Non‐Hispanic white | 73.7% | 691a | 77.4% | 1033a | 72.7% | 109a | 75.5% | 1833 | .301 |
| Non‐Hispanic black | 11.2% | 105a | 10.3% | 137a | 14.0% | 21a | 11.1% | 263 | ||
| Hispanic | 8.6% | 81a | 6.4% | 86a | 8.0% | 12a | 7.2% | 179 | ||
| Other ethnicity | 6.5% | 61a | 5.9% | 79a | 5.3% | 8a | 6.2% | 148 | ||
| Labour force participation | Yes | 30.4% | 285a | 30.0% | 400a | 26.7% | 40a | 30.6% | 725 | .652 |
| Currently has insurance | Yes | 89.4% | 839a | 91.7% | 1224a | 92.7% | 139a | 91.0% | 2202 | .139 |
| Health characteristics | ||||||||||
| BMI category | BMI: underweight | 0.1% | 1a | 0.1% | 2a | 0.7% | 1a | 0.2% | 4 | .058 |
| BMI: normal weight | 4.8% | 45a | 5.7% | 76a | 6.7% | 10a | 5.1% | 131 | ||
| BMI: overweight | 19.1% | 179a | 22.7% | 303a | 25.3% | 38a | 21.3% | 520 | ||
| BMI: obese | 72.8% | 683a | 69.5% | 928a | 66.7% | 100a | 70.9% | 1711 | ||
| BMI: unknown | 3.2% | 30a | 1.9% | 26a | 0.7% | 1a | 2.5% | 57 | ||
| Alcohol consumption | Yes | 45.0% | 422a | 48.2% | 643a | 52.7% | 79a | 46.8% | 1144 | .126 |
| CCI | 0.88a | 1.38 | 1.05b | 1.56 | 1.51c | 1.80 | 1.01 | 1.52 | <.001 | |
| Presence of any macrovascular disease (congestive heart failure, myocardial infarction, peripheral vascular disease, cerebrovascular disease) | Yes | 24.5%a | 230 | 26.7%a | 356 | 32.7%a | 49 | 26.2% | 635 | .092 |
| Presence of any microvascular disease (retinopathy, kidney disease) | Yes | 16.2%a | 152 | 20.7%b | 277 | 27.3%b | 41 | 19.4% | 470 | .001 |
| Diabetes characteristics | ||||||||||
| Years diagnosed with diabetes | 16.3a | 9.4 | 17.1a | 8.9 | 15.6a | 9.4 | 16.7 | 9.1 | .024 | |
| HbA1c mean | 7.51a | 1.46 | 7.31b | 1.29 | 7.78a | 1.84 | 7.41 | 1.39 | <.001 | |
| HbA1c | Do not know/NA | 29.5% | 277 | 20.7% | 276 | 37.3% | 56 | 28.7% | 609 | |
| Controlled <7 | 33.0%a | 218 | 38.4%a | 407 | 29.8%a | 28 | 36.0% | 653 | .032 | |
| Uncontrolled ≥7 | 67.0%a | 443 | 61.6%a | 652 | 70.2%a | 66 | 64.0% | 1161 | ||
| Time of day at which hypoglycaemia occurred among those who experienced hypoglycaemia in in the past 3 months | Daytime | 0.0%* | 0 | 66.7%a | 890 | 66.7%a | 100 | 66.7% | 990 | 1 |
| Night‐time (nocturnal) | 0.0%* | 0 | 33.3%a | 445 | 33.3%a | 50 | 33.3% | 495 | ||
| Presence of any complications from diabetes | Yes | 43.8%a | 411 | 49.9%b | 666 | 62.0%c | 93 | 48.3% | 1170 | <.001 |
| Years using insulin | 8.2a | 7.4 | 9.3b | 7.5 | 9.1a,b | 9.7 | 8.8 | 7.7 | .003 | |
| Rapid‐acting/premixed insulin | ||||||||||
| Rapid‐acting insulin | 43.1%a | 404 | 58.0%b | 774 | 53.3%a,b | 80 | 51.9% | 1258 | <.001 | |
| Premixed insulin | 5.3%a | 50 | 5.2%a | 69 | 5.3%a | 8 | 5.2% | 127 | <.001 | |
| Patients using any rapid‐acting/premixed insulin | 47.7%a | 447 | 62.2%b | 830 | 56.0%a,b | 84 | 56.2% | 1361 | <.001 | |
| Total number of OADs | 0 OADs | 29.4%a | 276 | 31.7%a | 423 | 28.7%a | 43 | 30.6% | 742 | .192 |
| 1 OAD | 43.3%a | 406 | 40.4%a | 540 | 47.3%a | 71 | 42.0% | 1017 | ||
| 2 OADs | 22.5%a | 211 | 22.8%a | 304 | 16.0%a | 24 | 22.2% | 539 | ||
| ≥3 OADs | 4.8%a | 45 | 5.1%a | 68 | 8.0%a | 12 | 5.2% | 125 | ||
| Secretagogues (sulphonylurea or meglitinides) | Yes | 24.3%a | 228 | 27.4%a | 366 | 32.0%a | 48 | 26.5% | 642 | .074 |
Abbreviations: BMI, body mass index; CCI, Charlson comorbidity index; HbA1c, glycated haemoglobin; NA, not available; OAD, oral antidiabetes drug; T2D, type 2 diabetes.
Values in the same row and subtable not sharing the same subscript letter (a,b,c) are significantly different (P < .05 in the two‐sided test of equality for column proportions or means). Cells with no subscript are not included in the test. Tests assume equal variances. Tests are adjusted for all pairwise comparisons within a row of each innermost subtable using the Bonferroni correction.
This category is not used in comparisons because its column proportion is equal to 0 or 1.
In general, the patients with severe hypoglycaemia were significantly younger than those with no hypoglycaemia and those with non‐severe hypoglycaemia (mean age 55.32 vs 60.79 and 61.03 years; P < .001 for both comparisons); had significantly higher CCI scores than patients with no hypoglycaemia or non‐severe hypoglycaemia (mean 1.51 vs 0.88 and 1.05; P < .001 for both comparisons); and were more likely than patients with no hypoglycaemia to have had any microvascular disease, complications from diabetes including macular oedema or diabetic retinopathy, kidney disease, foot or leg ulcer, neuropathic pain, or diabetes with end‐organ damage. Concomitant use of rapid‐acting/premixed insulin was highest among patients with non‐severe hypoglycaemia and lowest among those with no hypoglycaemia.
3.3. Association of hypoglycaemia with outcomes (unadjusted)
Bivariate analyses were used to compare patients who experienced severe hypoglycaemia with those who experienced non‐severe or no hypoglycaemia (Table S1 in File S1). Unadjusted comparisons showed that, compared with patients with non‐severe or no hypoglycaemia, those with severe hypoglycaemia had significantly poorer HRQoL (ie, significantly lower SF‐36v2 MCS and PCS scores, and significantly lower SF‐6D health utility scores); had significantly greater work impairment (absenteeism, presenteeism and overall work impairment) scores and greater activity impairment scores; significantly greater utilization of healthcare resources (numbers of traditional provider visits, ER visits and hospitalizations); and incurred significantly higher associated indirect, direct and total costs.
3.4. Association of hypoglycaemia with outcomes (adjusted)
The results of multivariate analyses were consistent with unadjusted results after adjusting for covariates (Appendix S1).
3.4.1. Health‐related quality of life
Patients with severe hypoglycaemia had significantly lower HRQoL scores compared with those with non‐severe or no hypoglycaemia, according to MCS (adjusted means 44.31 vs 47.54 and 48.65; P < .001 for each comparison), PCS (adjusted means 36.79 vs 38.60 and 39.52; P < .05 for each comparison), and SF‐6D health utilities (adjusted means 0.606 vs 0.653 and 0.668; P < .001 for each comparison). HRQoL scores were also significantly lower for patients with non‐severe hypoglycaemia compared with those reporting no hypoglycaemia across all 3 instruments (P = .016, P = .021 and P = .003 for MCS, PCS and SF‐6D, respectively). Differences between MCS (> 3 points30, 32) and SF‐6D health utilities (> 0.041 points33) reached minimal important differences. Considering a utility value of 0.03 as a benchmark for minimum clinically important differences in utility for persons with diabetes,34, 35 as few as 10 symptomatic, non‐severe hypoglycaemic episodes per year may be of clinical importance,36 highlighting the significant impact of non‐severe hypoglycaemia (Figure 2A).
Figure 2.
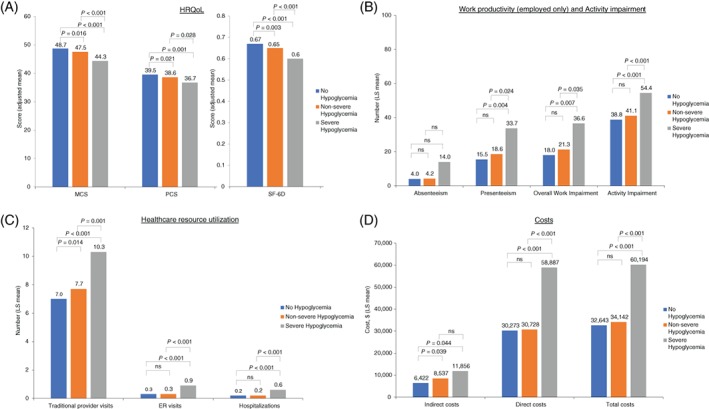
A, Health‐related quality of life (HRQoL), B, work productivity and activity impairment, C, healthcare resource utilization and D, costs by hypoglycaemia severity among patients with type 2 diabetes using basal insulin ± OADs or rapid‐acting/premixed insulin (adjusted for covariates). All generalized linear models adjusted for the following covariates: age, gender (female vs male), ethnicity (non‐Hispanic black, Hispanic, other vs non‐Hispanic white), income (<$50 000, declined to answer vs > $50 000), insurance (do not have vs have), presence of diabetes complications (have any vs none), glycated haemoglobin (HbA1c; do not know, uncontrolled vs controlled), years diagnosed with diabetes, number of oral antidiabetes drugs, Charlson comorbidity index (excluding diabetes and diabetes‐related complications), body mass index (overweight, obese, unknown vs underweight/normal weight), and exercise (≥1 times vs 0 times in past month). Non‐severe hypoglycaemia refers to self‐managed events; severe hypoglycaemia refers to events that required third‐party assistance. Costs are in 2012 USD. Absenteeism, presenteeism, overall work impairment and indirect costs calculated only for employed respondents. Total costs for unemployed respondents do not include indirect costs. Physical and mental component summary scores are normed to a mean of 50 and an SD of 10 for the US population. Higher scores indicate better health status. The SF‐6D health utilities index has interval scoring properties and yields summary scores on a theoretical 0 to 1 scale. Higher scores indicate better health status. Abbreviations: ns, not significant; LS, least squares
3.4.2. Work productivity and activity impairment
Patients with severe hypoglycaemia had significantly greater impairment in overall work productivity (adjusted means 36.60% vs 21.30% and 18.01%; P < .05 for each comparison) and significantly greater impairment in activity (adjusted means 54.38% vs 41.13% and 38.81; P < .001 for each comparison) compared with patients with non‐severe or no hypoglycaemia. Work productivity and activity impairment were numerically, but not significantly, greater among patients with non‐severe hypoglycaemia vs no hypoglycaemia (Figure 2B).
3.4.3. Healthcare resource utilization
Patients with severe hypoglycaemia, when compared with those with non‐severe or no hypoglycaemia, had greater utilization of healthcare resources, with a significantly higher number of traditional provider visits (adjusted means 10.28 vs 7.73 and 6.97; P < .01 for each comparison), number of ER visits (adjusted means 0.93 vs 0.31 and 0.30; P < .001 for each comparison), and number of hospitalizations (adjusted means 0.56 vs. 0.19 and 0.23; P < .001 for each comparison), respectively. In addition, patients with non‐severe hypoglycaemia had a greater number of traditional provider visits compared with those without hypoglycaemia (P = .014; Figure 2C).
3.4.4. Healthcare costs
As a result of greater work productivity impairment and resource use, patients with severe hypoglycaemia incurred higher annual indirect costs (adjusted means $11 856 vs $8537 and $6422; P < .05 for each comparison), direct costs (adjusted means $58 887 vs $30 728 and $30 273; P < .001 for each comparison) and total costs (adjusted means $60 194 vs $34 142 and $32 643; P < .001 for each comparison) than patients with non‐severe or no hypoglycaemia, respectively. Patients with non‐severe hypoglycaemia had greater annual indirect costs compared with those without hypoglycaemia (P = .039; Figure 2D).
4. DISCUSSION
In the present study, we aimed to evaluate the clinical and patient‐reported outcomes, as well as healthcare utilization and costs, associated with patient‐reported severe and non‐severe hypoglycaemia in patients with T2D using basal insulin ± OADs or rapid‐acting/premixed insulin. Outcomes were compared according to self‐reported hypoglycaemia severity (no hypoglycaemia, non‐severe or severe) experienced during the preceding 3 months. Both in unadjusted comparisons and after adjusting for covariates, patients with severe hypoglycaemia had significantly worse HRQoL; greater impairment in work productivity and activity; greater healthcare resource utilization; and higher associated indirect, direct and total costs compared with those with non‐severe or no hypoglycaemia. The prevalence of hypoglycaemia reported by the patients in this study was high, probably reflecting the use of premixed and rapid/fast‐acting preparations along with the basal insulin. Higher rates of hypoglycaemia in real‐world practice, compared with clinical trial settings, have been previously reported; for example in the Hypoglycaemia Assessment Tool (HAT) study.37 These observations have been attributed to the inherent constraints of randomized controlled trials (eg, excluding subjects highly vulnerable to hypoglycaemia), which are likely to have resulted in an underestimation of the burden of hypoglycaemia in clinical practice.37, 38 Additionally, patients with non‐severe hypoglycaemia had significantly greater impairment in HRQoL, a higher number of traditional physician's visits and higher indirect costs than patients with no hypoglycaemia. The data from the present analysis support those from previous studies, which report significantly lower HRQoL,18 and significantly higher economic burden11, 18 in patients with T2D experiencing hypoglycaemia compared with those without.
Data on NHWS participants with self‐reported T2D have been collected in previous studies to assess the severity and frequency of hypoglycaemia episodes among patients treated with OADs only (no insulin). Among a cohort of US adults re‐contacted in 2007, using the EuroQol‐5 Dimension (EQ‐5D) questionnaire, hypoglycaemia was independently associated with lower HRQoL, as demonstrated by a significantly lower utility score among patients with hypoglycaemia compared with those not reporting hypoglycaemia (0.78 vs 0.86, respectively) as well as a significantly higher score on the ‘worry' subscale of the Hypoglycemia Fear Survey, which was administered as an additional questionnaire during the re‐contacted survey (17.5 vs 6.2, respectively). The magnitude of worsening in HRQoL increased with the frequency and severity of hypoglycaemic episodes. Symptoms of hypoglycaemia in the preceding 6 months were common in this cohort of patients with T2D using OADs and were reported by up to 63% of patients. Approximately 50% of those with hypoglycaemia symptoms reported mild hypoglycaemia, 33% reported moderate hypoglycaemia, and 17% reported severe (needing assistance of others) or very severe (needing medical attention) hypoglycaemia.39 Williams et al.10 also reported on adult NHWS participants (data collected 2006‐2008) with self‐reported T2D who were on at least 1 OAD (no insulin), but focused on recent hypoglycaemia events that occurred in the 2 weeks preceding the survey. Overall, 13.8% of patients in that short‐term study reported experiencing hypoglycaemia symptoms. Those with hypoglycaemia in the past 2 weeks were significantly more likely to have lower HRQoL scores, lower treatment satisfaction scores, and higher levels of healthcare resource utilization.
A survey of insulin‐treated Japanese patients with either type 1 diabetes or T2D showed that experiencing a non‐severe hypoglycaemic event can have a negative impact on diabetes management: 16% of patients with a daytime event and 19% of patients with a nocturnal event changed their insulin dose after the event. After a daytime event, 25% of patients reported a negative impact on their daily activities or work. After a nocturnal event, 34% reported a negative impact on sleep and 23% reported a negative impact on their functioning and well‐being the following day.40 Non‐severe nocturnal hypoglycaemic events not only have serious consequences for patients, but also carry a considerable economic burden as a result of lost work productivity, doctor visits and medical care required because of falls or injuries.41
The present study adds to the current knowledge base by describing clinical and patient‐reported outcomes, healthcare utilization, and direct and indirect costs from a US population of patients with self‐reported diabetes, but now focusing on those patients using basal insulin ± OADs or rapid‐acting/premixed insulin. In line with previous real‐world studies, the present study highlights the burden of hypoglycaemia on healthcare resource utilization, costs, and HRQoL and shows that this burden increases with severity of hypoglycemia, but already significantly impacts patients at lower severity levels.
The present study has several strengths. Unlike most real‐world studies that capture only the most severe events that result in a healthcare encounter, this study also captured patient reports of non‐severe hypoglycaemia. The patients' perspectives may highlight higher rates of hypoglycaemia than would be assumed by healthcare providers or than those which can be extracted from administrative claims or electronic medical record databases. Real‐world data capturing the patient perspective are important to better understand the true burden of hypoglycaemia in the patient's life. Using data from surveys such as the NHWS provides a unique way of capturing the personal and social context of patients, including quality of life, work impairment, healthcare utilization and costs.
Some limitations of the present study should also be mentioned. Because of the self‐reported nature of this study, diabetes diagnosis and other variables could not be verified from patients' medical charts or other objective data. The validity of the study may be reduced because self‐reported data are subject to recall bias, such as recalling the number of doctor visits, ER visits and hospitalizations. However, the timeframe of the healthcare resource use variables in the study required recall for the past 6 months, which is within the timeframes of other large‐scale cross‐sectional surveys. For example, the National Health Interview Survey of the Centers for Disease Control and Prevention, a cross‐sectional household interview survey, asks about healthcare resource use in the past 12 months.42 In addition, patients may have experienced >1 hypoglycaemic event in the past 3 months of the survey, and it cannot be known which event they reported; however, only 1 hypoglycaemic category could be reported for the analysis and the overall rate of hypoglycaemia may have been underestimated in this study. Patient‐reported hypoglycaemic events may have been estimated more accurately in this study than would have been possible with other types of real‐world studies, such as electronic medical records or claims data analyses. The observational HAT study used self‐assessment questionnaires and patient diaries and found that 46.5% of patients with T2D receiving insulin treatment reported hypoglycaemia over a 4‐week period, a higher rate of patient‐reported hypoglycaemia than previously reported.37 The NHWS data are cross‐sectional in nature, self‐reported without direct means of validating the responses, and do not allow causal explanations to be made; a randomized controlled study would be needed to identify any causal relationships among the variables under consideration. Although a number of respondent characteristics were adjusted for, there may be additional variables that were not adjusted for or that have not been measured or assessed, which may have biased the results. Further, because claims specifically linking resource use with diabetes and/or hypoglycaemia are not captured by the NHWS database, healthcare resource utilization data could not be definitively attributed to diabetes. However, comorbidities (ie, CCI) were controlled for in the multivariable analyses to better estimate the association between resource use and diabetes/hypoglycaemia. Finally, while the NHWS is designed to be representative of the general US adult population, it is possible that the diabetes subpopulation may have been selectively underrepresented, because of age and/or technology‐related limitations; the sample is likely to favour younger, healthier adults (see Table 3 for detailed demographic and clinical patient characteristics), and respondents without Internet or computer access were not represented in the current sample. The study may have picked up a population which was at a higher risk of hypoglycaemia by including only patients who reported having experienced hypoglycaemia in the past. The results may not be generalizable to the wider population.
In conclusion, the results of the present study suggest that, of US patients with T2D using basal insulin ± OADs or rapid‐acting/premixed insulin, those experiencing severe hypoglycaemia had greater impairment of activity and work productivity, utilized healthcare resources to a greater extent, incurred higher associated costs than those with non‐severe or no hypoglycaemia, and reported a negative impact on HRQoL outcomes. The study also highlights the burden of non‐severe hypoglycaemia, in particular on patients' HRQoL, the number of outpatient visits, and indirect healthcare costs. Reducing the incidence and severity of hypoglycaemia could lead to clinically meaningful improvements in HRQoL, and reduce healthcare utilization and associated costs. These findings highlight a need to reduce hypoglycaemia and minimize its negative effects in patients with T2D on insulin therapy.
Supporting information
File S1. SUPPLEMENTARY APPENDIX Demographic and diabetes‐related variables controlled for in regression models
ACKNOWLEDGMENTS
This study was funded by Sanofi, Bridgewater, NJ, USA. The authors gratefully acknowledge the contributions to this manuscript of Hongwei Wang and Liyue Tong. The authors received writing/editorial support in the preparation of this manuscript provided by Grace Richmond, PhD, and Tessa Hartog, PhD, of Excerpta Medica, funded by Sanofi, Bridgewater, NJ, USA.
Conflict of interest
L. M. is a consultant and advisory board member for Novo Nordisk and Sanofi and an advisory board member of Intarcia Therapeutics. L.L. and S.G. are employees of Kantar Health, which received funding from Sanofi to conduct this study. R.P. is an employee of Sanofi.
Meneghini LF, Lee LK, Gupta S, Preblick R. Association of hypoglycaemia severity with clinical, patient‐reported and economic outcomes in US patients with type 2 diabetes using basal insulin. Diabetes Obes Metab. 2018;20:1156–1165. https://doi.org/10.1111/dom.13208
Funding information Sanofi, Bridgewater, New Jersey.
REFERENCES
- 1. International Diabetes Federation . Download the IDF Diabetes Atlas. 7th ed. 2015. http://www.diabetesatlas.org/. Accessed October 4, 2017. [Google Scholar]
- 2. Centers for Disease Control and Prevention . National diabetes statistics report, 2017. https://www.cdc.gov/diabetes/pdfs/data/statistics/national-diabetes-statistics-report.pdf. Accessed October 4, 2017.
- 3. American Diabetes Association . Economic costs of diabetes in the U.S. in 2012. Diabetes Care. 2013;36(4):1033‐1046. [DOI] [PMC free article] [PubMed] [Google Scholar]
- 4. Bommer C, Heesemann E, Sagalova V, et al. The global economic burden of diabetes in adults aged 20‐79 years: a cost‐of‐illness study. Lancet Diabetes Endocrinol. 2017;5(6):423‐430. [DOI] [PubMed] [Google Scholar]
- 5. Inzucchi SE, Bergenstal RM, Buse JB, et al. Management of hyperglycemia in type 2 diabetes, 2015: a patient‐centered approach: update to a position statement of the American Diabetes Association and the European Association for the Study of Diabetes. Diabetes Care. 2015;38(1):140‐149. [DOI] [PubMed] [Google Scholar]
- 6. American Diabetes Association . Standards of medical care in diabetes—2017. Diabetes Care. 2017;40(suppl 1):S1‐S135.27979885 [Google Scholar]
- 7. Amiel SA, Dixon T, Mann R, Jameson K. Hypoglycemia in type 2 diabetes. Diabet Med. 2008;25(3):245‐254. [DOI] [PMC free article] [PubMed] [Google Scholar]
- 8. Brod M, Galstyan G, Unnikrishnan AG, et al. Self‐treated hypoglycemia in type 2 diabetes mellitus: results from the second wave of an international cross‐sectional survey. Diabetes Ther. 2016;7(2):279‐293. [DOI] [PMC free article] [PubMed] [Google Scholar]
- 9. Dømgaard M, Bagger M, Rhee NA, Burton CM, Thorsteinsson B. Individual and societal consequences of hypoglycemia: a cross‐sectional survey. Postgrad Med. 2015;127(5):438‐445. [DOI] [PubMed] [Google Scholar]
- 10. Williams SA, Pollack MF, Dibonaventura M. Effects of hypoglycemia on health‐related quality of life, treatment satisfaction and healthcare resource utilization in patients with type 2 diabetes mellitus. Diabetes Res Clin Pract. 2011;91:363‐370. [DOI] [PubMed] [Google Scholar]
- 11. Fonseca V, Chou E, Chung HW, Gerrits C. Economic burden of hypoglycemia with basal insulin in type 2 diabetes. Am J Manag Care. 2017;23:114‐122. [PubMed] [Google Scholar]
- 12. Dalal MR, Kazemi MR, Ye F. Hypoglycemia in patients with type 2 diabetes newly initiated on basal insulin in the US in a community setting: impact on treatment discontinuation and hospitalization. Curr Med Res Opin. 2017;33(2):209‐214. [DOI] [PubMed] [Google Scholar]
- 13. Dalal MR, Kazemi M, Ye F, Xie L. Hypoglycemia after initiation of basal insulin in patients with type 2 diabetes in the United States: implications for treatment discontinuation and healthcare costs and utilization. Adv Ther. 2017;34(9):2083‐2092. [DOI] [PMC free article] [PubMed] [Google Scholar]
- 14. Alvarez‐Guisasola F, Yin DD, Nocea G, Qiu Y, Mavros P. Association of hypoglycemic symptoms with patients' rating of their health‐related quality of life state: a cross sectional study. Health Qual Life Outcomes. 2010;8:86. [DOI] [PMC free article] [PubMed] [Google Scholar]
- 15. Escalada J, Liao L, Pan C, Wang H, Bala M. Outcomes and healthcare resource utilization associated with medically attended hypoglycemia in older patients with type 2 diabetes initiating basal insulin in a US managed care setting. Curr Med Res Opin. 2016;32(9):1557‐1565. [DOI] [PubMed] [Google Scholar]
- 16. Ginde AA, Blanc PG, Lieberman RM, Camargo CA Jr. Validation of ICD‐9‐CM coding algorithm for improved identification of hypoglycemia visits. BMC Endocr Disord. 2008;8:4. [DOI] [PMC free article] [PubMed] [Google Scholar]
- 17. Wei W, Buysman E, Grabner M, et al. A real‐world study of treatment patterns and outcomes in US managed‐care patients with type 2 diabetes initiating injectable therapies. Diabetes Obes Metab. 2017;19(3):375‐386. [DOI] [PMC free article] [PubMed] [Google Scholar]
- 18. Williams SA, Shi L, Brenneman SK, Johnson JC, Wegner JC, Fonseca V. The burden of hypoglycemia on healthcare utilization, costs, and quality of life among type 2 diabetes mellitus patients. J Diabetes Complications. 2012;26:399‐406. [DOI] [PubMed] [Google Scholar]
- 19. Veronese G, Marchesini G, Forlani G, et al. Costs associated with emergency care and hospitalization for severe hypoglycemia. Nutr Metab Cardiovasc Dis. 2016;26(4):345‐351. [DOI] [PubMed] [Google Scholar]
- 20. Leese GP, Wang J, Broomhall J, et al. Frequency of severe hypoglycemia requiring emergency treatment in type 1 and type 2 diabetes: a population‐based study of health service resource use. Diabetes Care. 2003;26(4):1176‐1180. [DOI] [PubMed] [Google Scholar]
- 21. National Health and Wellness Survey . Patient‐reported healthcare insights. http://www.kantarhealth.com/docs/datasheets/kh-national-health-and-wellness-survey.pdf. Accessed October 4, 2017.
- 22. Kantar Health . NHWS overview. http://www.kantarhealth.com/docs/uploads/kantar-health-nhws-overview.pdf?sfvrsn=2. Accessed December 4, 2017.
- 23. Lightspeed Research . Home page. http://www.lightspeedresearch.com/#home. Accessed October 4, 2017.
- 24. American Diabetes Association Workgroup on Hypoglycemia . Defining and reporting hypoglycemia in diabetes – a report from the American Diabetes Association Workgroup on Hypoglycemia. Diabetes Care. 2005;28(5):1245‐1249. [DOI] [PubMed] [Google Scholar]
- 25. Ware JE, Kosinski M, Turner‐Bowker DM, Gandek B. How to Score Version 2 of the SF‐12® Health Survey (with a Supplement Documenting Version). Lincoln, Rhode Island: QualityMetric Incorporated; 2002. [Google Scholar]
- 26. Maruish ME, ed. User's Manual for the SF‐36v2 Health Survey. 3rd ed. Lincoln, Rhode Island: QualityMetric Incorporated; 2011. [Google Scholar]
- 27. Brazier J, Roberts J, Deverill M. The estimation of a preference‐based measure of health from the SF‐36. J Health Econ. 2002;21(2):271‐292. [DOI] [PubMed] [Google Scholar]
- 28. Reilly MC, Zbrozek AS, Dukes EM. The validity and reproducibility of a work productivity and activity impairment instrument. Pharmacoeconomics. 1993;4:353‐365. [DOI] [PubMed] [Google Scholar]
- 29. Reilly Associates . WPAI scoring. http://www.reillyassociates.net/WPAI_Scoring.html. Accessed October 4, 2017.
- 30. Agency for Healthcare Research and Quality . Medical expenditure panel survey. https://meps.ahrq.gov/mepsweb. Accessed October 4, 2017.
- 31. Bureau of Labor Statistics . Home page. https://www.bls.gov. Accessed October 4, 2017.
- 32. Ware JE, Kosinski M, Bjorner J, et al. User's Manual for the SF‐36v2 Health Survey. 2nd ed. Lincoln, Rhode Island: QualityMetric Incorporated; 2007. [Google Scholar]
- 33. Walters SJ, Brazier JE. Comparison of the minimally important difference for two health state utility measures: EQ‐5D and SF‐6D. Qual Life Res. 2005;14(6):1523‐1532. [DOI] [PubMed] [Google Scholar]
- 34. Drummond M. Introducing economic and quality of life measurements into clinical studies. Ann Med. 2001;33(5):344‐349. [DOI] [PubMed] [Google Scholar]
- 35. Maddigan SL, Feeny DH, Johnson JA. Health‐related quality of life deficits associated with diabetes and comorbidities in a Canadian national population health survey. Qual Life Res. 2005;14(5):1311‐1320. [DOI] [PubMed] [Google Scholar]
- 36. Levy AR, Christensen TL, Johnson JA. Utility values for symptomatic non‐severe hypoglycemia elicited from persons with and without diabetes in Canada and the United Kingdom. Health Qual Life Outcomes. 2008;6:73. [DOI] [PMC free article] [PubMed] [Google Scholar]
- 37. Khunti K, Alsifri S, Aronson R, et al. Rates and predictors of hypoglycaemia in 27 585 people from 24 countries with insulin‐treated type 1 and type 2 diabetes: the global HAT study. Diabetes Obes Metab. 2016;18(9):907‐915. [DOI] [PMC free article] [PubMed] [Google Scholar]
- 38. Elliott L, Fidler C, Ditchfield A, Stissing T. Hypoglycemia event rates: a comparison between real‐world data and randomized controlled trial populations in insulin‐treated diabetes. Diabetes Ther. 2016;7(1):45‐60. [DOI] [PMC free article] [PubMed] [Google Scholar]
- 39. Marrett E, Radican L, Davies MJ, Zhang Q. Assessment of severity and frequency of self‐reported hypoglycemia on quality of life in patients with type 2 diabetes treated with oral antihyperglycemic agents: a survey study. BMC Res Notes. 2011;4:251. [DOI] [PMC free article] [PubMed] [Google Scholar]
- 40. Ohashi Y, Wolden ML, Hyllested‐Winge J, Brod M. Diabetes management and daily functioning burden of non‐severe hypoglycemia in Japanese people treated with insulin. J Diabetes Investig. 2017;8(6):776‐782. [DOI] [PMC free article] [PubMed] [Google Scholar]
- 41. Brod M, Wolden M, Christensen T, Bushnell DM. Understanding the economic burden of nonsevere nocturnal hypoglycemic events: impact on work productivity, disease management, and resource utilization. Value Health. 2013;16(8):1140‐1149. [DOI] [PubMed] [Google Scholar]
- 42. National Center for Health Statistics . Survey Description, National Health Interview Survey, 2013. Hyattsville, Maryland; 2014. [Google Scholar]
Associated Data
This section collects any data citations, data availability statements, or supplementary materials included in this article.
Supplementary Materials
File S1. SUPPLEMENTARY APPENDIX Demographic and diabetes‐related variables controlled for in regression models