

Abstract
Global transcriptional regulators play key roles during bacterial adaptation to environmental fluctuations. Protein MafR from Enterococcus faecalis was shown to activate the transcription of many genes on a genome‐wide scale. We proposed that MafR is a global regulator of the Mga/AtxA family. Here, we purified an untagged form of the MafR protein and found that it binds to linear double‐stranded DNAs in a nonsequence‐specific manner. Moreover, multiple MafR units (likely dimers) bind sequentially to the DNA molecule generating multimeric complexes. On DNAs that contain the promoter of the mafR gene, MafR recognizes a potentially curved DNA region. We discuss that a characteristic of the Mga/AtxA regulators might be their ability to recognize particular DNA shapes across the bacterial genomes.
Keywords: Enterococcus faecalis, gene expression, global regulators, protein–DNA interactions
Abbreviations
dsDNA, double‐stranded DNA
EMSA, electrophoretic mobility shift assay
OD, optical density
Bacterial adaptation to a new niche usually requires global changes in gene expression. Many of these changes are coordinated by proteins that function as global transcriptional regulators. The ability of such proteins to recognize multiple DNA sites across the bacterial genome makes possible to adjust the gene expression pattern in response to environmental fluctuations. Several findings from structural and biochemical studies have shown that simple protein–DNA recognition mechanisms do not exist 1. Rohs et al. 2 classified two main readout mechanisms: base readout and shape readout. In the base readout mechanism, proteins recognize the unique chemical signatures of the DNA bases. In contrast, in the shape readout mechanism, proteins recognize a sequence‐dependent DNA shape. Nevertheless, based on the structures of numerous protein–DNA complexes, it has been reasoned that particular proteins use likely a combination of readout mechanisms to achieve DNA‐binding specificity 2.
The gram‐positive bacterium Enterococcus faecalis is able to colonize different niches of the human host. It is generally found as a harmless commensal of the gastrointestinal tract. However, in immunocompromised hosts, E. faecalis can cause a variety of infections, such as urinary tract infections, endocarditis and bacteraemia 3, 4, 5. Our knowledge of the regulatory elements involved in the adaptation of E. faecalis to particular host niches is still very limited. Genome‐wide microarray assays designed for the E. faecalis strain OG1RF showed that protein MafR activates, directly or indirectly, the expression of numerous genes 6. Some of them were found to be up‐regulated during the growth of E. faecalis in blood and/or in human urine 7, 8. MafR (482 amino acids) has sequence similarity to three regulatory proteins: AtxA (40.7%; 475 amino acids) from Bacillus anthracis, MgaSpn (38.8%; 493 amino acids) from Streptococcus pneumoniae, and Mga (31.3%; 530 amino acids) from S. pyogenes 6. The three proteins are members of an emerging class of global transcriptional regulators involved in virulence (the Mga/AtxA family) 9, 10, 11. Furthermore, according to the Pfam database of protein families 12, MafR has two putative DNA‐binding domains within the N‐terminal region, the so‐called HTH_Mga (Family PF08280, residues 11–69) and Mga (Family PF05043, residues 76–164) domains, which are also present in Mga, AtxA and MgaSpn 6, 13, 14. Based on these findings, we proposed that MafR is a potential regulator of the Mga/AtxA family. However, the DNA‐binding properties of MafR remain to be investigated.
In vitro protein–DNA interaction studies have been reported for Mga and MgaSpn, but not for AtxA. During exponential growth of S. pyogenes, Mga activates directly the transcription of several virulence genes. Some of them encode factors important for adherence to host tissues and for evasion of the host immune responses 15. In vitro experiments showed that a His‐tagged Mga protein binds to regions located upstream of the target promoters. The position of the Mga‐binding sites with respect to the start of transcription differs among the promoters tested 13, 16. Although a consensus Mga‐binding sequence was initially proposed 17, subsequent sequence alignments revealed that the sites recognized by Mga exhibit a low sequence identity (13.4%) 16. Additionally, it has been shown that the His‐tagged Mga protein is able to form higher order oligomers in solution 18.
The pneumococcal MgaSpn protein activates directly the transcription of a four‐gene operon (spr1623–spr1626) of unknown function. This activation requires a region located upstream of the target promoter 14. In vitro experiments showed that MgaSpn binds to linear double‐stranded (ds) DNAs with little or no sequence specificity. Moreover, MgaSpn is able to generate multimeric complexes on linear DNAs 10. Additional results supported that MgaSpn recognizes structural features in its target DNA as follows: (a) MgaSpn binds preferentially to DNA sites that contain a potential intrinsic curvature flanked by regions of bendability, (b) MgaSpn has a high affinity for a naturally occurring curved DNA, and (c) MgaSpn has a preference for AT‐rich DNA sites 10, 19. Because of these results, we proposed that a preference for particular DNA structures rather than for specific DNA sequences might be a general feature of the global regulators that constitute the Mga/AtxA family 19. In agreement with this hypothesis, sequence similarities in the promoter regions of the genes regulated by AtxA are not apparent, and some of those promoter regions are intrinsically curved 20.
In the present work, we purified an untagged form of the MafR protein and analyzed its DNA‐binding properties. By gel retardation assays, we found that MafR binds to linear dsDNAs in a nonsequence‐specific manner. Multiple units of MafR (likely dimers) bind orderly on the same DNA molecule generating multimeric complexes. Moreover, by footprinting experiments, we found that MafR binds to a potentially curved DNA region. Our results support that recognition of sequence‐dependent DNA shapes might be a hallmark of the global regulators that belong to the Mga/AtxA family.
Materials and methods
Oligonucleotides, bacterial strains, and plasmids
Oligonucleotides used in this work are listed in Table 1. Chromosomal DNA was isolated from E. faecalis V583 21, E. faecalis OG1RF 22, and S. pneumoniae R6 23. E. faecalis JH2‐2 24 was used as a host for plasmids based on pDLF 6 and pDLS. The expression vector pDLS is a pDL287 25 derivative. It has a unique restriction site for SphI downstream of the pneumococcal PsulA promoter 26. For its construction, a 202‐bp region (promoter PsulA) of the R6 genome was amplified by PCR using primers pSulF and pSulR. The PCR product was digested with ClaI, and the 181‐bp restriction fragment was ligated to ClaI‐linearized pDL287. Plasmids pDLFmafR V583 and pDLSmafR V583 carry the P2493::mafR V583 and PsulA::mafR V583 fusion genes, respectively. For their construction, a 1546‐bp region of the V583 chromosome was amplified using the mafSphF and mafSphR primers. After SphI digestion, the 1514‐bp restriction fragment was inserted into the SphI site of both expression vectors pDLF and pDLS.
Table 1.
Oligonucleotides used in this work
| Name | Sequence (5′ to 3′)a |
|---|---|
| pSulF | TGTTAATGGGAT C G A TTTCTGTTTG |
| pSulR | GACATATCG A TCACTCCCG CA T G CATTTTCATC |
| mafSphF | TTTTTATCCGTATTCGC A T GCAAAAGGAGG |
| mafSphR | AACCAAACGATG CATG CCGAAAGAAAGC |
| UpmafR | GCAAAAGGAGGTTTTCAT ATGTACTCCATG |
| DwmafR | AGCCAAAAAACT C G A GAATGTCCTCGCTAG |
| DwmafR‐His | CCTCGCTAGTTC TCGAGAAAATAAGAATGA |
| UpmafR‐Δ3N | GGTTTTGCCATGTACCAT ATGTTAAAACGT |
| 3012A | AGGAATGGCTGTTGTAACCA |
| 3012B | AGTGCGGCTCCTGTCGGTAA |
| 3013A | AACAAACGAATTTGCCGAAGC |
| 3013B | CAACTGTTCCAACAAACG |
| 3013C | CCGTTATCACACGTTTTAACA |
| 0091G2 | GGCTATTTTGATGCACATATCTG |
| 0092A2 | CCCGCCTTCCTTCCCTTGCTC |
| EM1 | AGTTGAATGTTTAAAGAAATGATGG |
| 26A | TTCTTTGTGGTATAATTGCAAGAGGT |
| 26B | ACCTCTTGCAATTATACCACAAAGAA |
| 20A | TATATTGTCTCCGTAGTGTT |
| 20B | AACACTACGGAGACAATATA |
| 40A | TATATCATGCTATACCTATTCTTTGTGGTATAATTGCAAG |
| 40B | CTTGCAATTATACCACAAAGAATAGGTATAGCATGATATA |
| 32A | TTCTTTGTGGTATAATTGCAAGAGGTTTAATC |
| 32B | GATTAAACCTCTTGCAATTATACCACAAAGAA |
Restriction sites are in bold, and the base changes that generate restriction sites are underlined.
For protein overproduction, an inducible expression system based on Escherichia coli BL21 (DE3) (a gift of F. W. Studier) and pET24b (Novagen) was used. To overproduce MafRV583, a 1502‐bp region of the V583 chromosome was amplified by PCR using the UpmafR and DwmafR primers. These primers have a single restriction site for NdeI and XhoI, respectively. The amplified product was digested with both enzymes, and the 1470‐bp digestion product was inserted into pET24b (plasmid pET24b‐mafR V583). To overproduce MafRV583‐His and MafROG1RF‐His, a 1481‐bp DNA region was amplified by PCR using the UpmafR and DwmafR‐His primers. The amplified DNA was digested with NdeI and XhoI, and the 1448‐bp digestion product was inserted into pET24b (plasmids pET24b‐mafR V583‐His and pET24b‐mafR OG1RF‐His). To overproduce MafROG1RF∆3N‐His, a 1472‐bp region of the OG1RF chromosome was amplified by PCR using the UpmafR‐Δ3N and DwmafR‐His oligonucleotides. The 1439‐bp digestion product was inserted into pET24b (plasmid pET24b‐mafR OG1RFΔ3N‐His).
DNA isolation
For small‐scale preparations of plasmid DNA, the High Pure Plasmid Isolation Kit (Roche Applied Science, Penzberg, Germany) was used with the modifications reported for Enterococcus 6. Chromosomal DNA was isolated from E. faecalis and S. pneumoniae as previously described 26.
Growth and transformation of bacteria
The E. faecalis was grown in Bacto™ Brain Heart Infusion (BHI) medium, which was supplemented with kanamycin (250 μg·mL−1) when the cells harbored a plasmid based on pDLF or pDLS. E. coli cells carrying a derivative of pET24b were grown in tryptone‐yeast extract (TY) medium supplemented with kanamycin (30 μg·mL−1). Bacteria were grown at 37 °C. The protocols used to transform E. faecalis and E. coli by electroporation have been described 27, 28.
Western blot
Plasmid‐carrying enterococcal cells were grown as indicated above to an optical density at 650 nm (OD650) of 0.3 (exponential phase). To prepare whole‐cell extracts, cells were concentrated 40‐fold in buffer LBW (25 mm Tris‐HCl, pH 7.6, 0.5 mm EDTA, 0.2 mg·mL−1 lysozyme, 260 units·mL−1 mutanolysin), and incubated at 37 °C for 10 min. Total proteins were separated by SDS/PAGE (10%). Prestained proteins (Invitrogen, Waltham, MA, USA) were run in the same gel as molecular weight markers. Proteins were transferred electrophoretically to immunoblot polyvinylidene difluoride (PVDF) membranes (Bio‐Rad) using a Mini Trans Blot (Bio‐Rad, Hercules, CA, USA) as reported previously 26. Membranes were probed with rabbit polyclonal antibodies against MafRV583. Antigen–antibody complexes were detected using antirabbit horseradish peroxidase‐conjugated antibodies, the Immun‐Star™ HRP substrate kit (Bio‐Rad), and the Luminescent Image Analyzer LAS‐3000 (Fujifilm Life Science). Rabbit polyclonal antibodies against MafRV583 were produced in the Animal Facility of the Centro de Investigaciones Biológicas, CSIC (Madrid, Spain). For the immunizations, purified protein (MafRV583) and traditional protocols (Freund′s complete adjuvant, Freund′s incomplete adjuvant, subcutaneous administration) were used.
Polymerase chain reaction (PCR)
The Phusion High‐Fidelity DNA polymerase (Thermo Scientific, Waltham, MA, USA) and the Phusion HF buffer were used. Reaction mixtures (50 μL) contained 5–30 ng of template DNA, 20 pmol of each primer, 200 μm each dNTP, and one unit of DNA polymerase. PCR conditions were reported previously 26. PCR products were purified with the QIAquick PCR purification kit (QIAGEN, Hilden, Germany).
PCR amplification of chromosomal DNA regions
By PCR, four regions of the V583 chromosome were amplified: (a) a 217‐bp region (coordinates 2888932–2889148) using the 3012A and 3013A primers, (b) a 227‐bp region (2888932–2889158) using the 3012A and 3013B primers, (c) a 260‐bp region (coordinates 2888858–2889117) using the 3012B and 3013C primers, and (d) a 321‐bp region (coordinates 94488–94808) using the 0091G2 and 0092A2 primers. From the S. pneumoniae R6 chromosome, a 322‐bp region (coordinates 1598010–1598331) was amplified using the 26A and EM1 primers.
Annealing of complementary oligonucleotides
Oligonucleotides 20A, 26A, 32A, 40A and their complementary oligonucleotides (20B, 26B, 32B, 40B) (Table 1) were used to generate small dsDNA fragments. Equimolar amounts of complementary oligonucleotides were annealed in buffer TE (2 mm Tris‐HCl, pH 8.0, 0.2 mm EDTA) containing 50 mm NaCl. Reaction mixtures (150 μL) were incubated at 95 °C for 10 min, cooled down slowly to 37 °C, kept at 37 °C for 10 min, and placed on ice for 10 min.
Overproduction and purification of proteins
E. coli BL21 (DE3) cells harboring a pET24b derivative were grown as indicated above to an OD600 of 0.45. Then, IPTG (1 mm) was added. After 25 min, cells were treated with rifampicin (200 μg·mL−1) for 60 min. Cells were then collected by centrifugation, washed twice with buffer VL (50 mm Tris‐HCl, pH 7.6, 5% glycerol, 1 mm DTT, 1 mm EDTA) containing 200 mm NaCl, and stored at −80 °C.
To purify MafRV583, bacterial cells were concentrated 40‐fold in buffer VL containing 200 mm NaCl and a protease inhibitor cocktail (Roche). To purify His‐tagged proteins, an EDTA‐free protease inhibitor cocktail (Roche) was used. Cells were lysed using a prechilled French pressure cell, and the whole‐cell extract was centrifuged to remove cell debris. The clarified extract was mixed with 0.2% poly(ethyleneimine), kept on ice for 30 min, and centrifuged at 10 414 g in an Eppendorf F‐34‐6‐38 rotor for 20 min at 4 °C. MafRV583, as well as the His‐tagged variants, were recovered in the poly(ethyleneimine) pellet, which was subsequently washed twice with buffer VL containing 200 mm NaCl. MafRV583 and the His‐tagged variants were eluted with buffer VL containing 500 mm NaCl. Proteins were precipitated with ammonium sulfate (70% saturation; 60 min on ice), followed by a centrifugation step (10 414 g for 20 min at 4 °C).
In the case of MafRV583, the ammonium sulfate precipitate was dissolved in buffer VL containing 200 mm NaCl, and dialyzed against the same buffer at 4 °C. The protein preparation was loaded onto a heparin affinity column (HiPrep Heparin, GE Healthcare, Chicago, IL, USA). To elute MafRV583, a linear gradient of NaCl (200–600 mm) in buffer VL was used. Fractions containing MafRV583 were identified by Coomassie‐stained SDS‐polyacrylamide (12%) gels, pooled, and dialyzed against buffer VL containing 200 mm NaCl. Then, the protein preparation was concentrated (Vivaspin‐20, GE Healthcare), applied to a HiLoad Superdex 200 gel filtration column, and subjected to fast‐pressure liquid chromatography (Biologic Duoflow, Bio‐Rad) at 4 °C. The running buffer contained 200 mm NaCl. Protein fractions containing MafRV583 were pooled, concentrated and stored at −80 °C.
In the case of His‐tagged proteins, the ammonium sulfate precipitate was dissolved in buffer S‐His (10 mm Tris‐HCl, pH 7.6, 5% glycerol, 300 mm NaCl, 1 mm DTT), and dialyzed against the same buffer at 4 °C. Imidazole (10 mm) was added to the protein preparation, which was then loaded onto a nickel affinity column (HisTrap HP column, GE Healthcare). To elute the His‐tagged protein, a linear gradient of imidazole (10–250 mm) in buffer S‐His was used. Fractions containing the His‐tagged protein were pooled, dialyzed against buffer VL containing 200 mm NaCl, concentrated, and stored at −80 °C.
Protein concentration was determined using a NanoDrop ND‐2000 Spectrophotometer (Thermo Scientific). MafRV583, MafROG1RF‐His and MafROG1RFΔ3N‐His were subjected to amino terminal sequencing by Edman degradation using a Procise 494 Sequencer (Perkin Elmer, Waltham, MA, USA).
Gel filtration chromatography
Protein MafRV583 was injected into a HiLoad Superdex 200 gel filtration column using a Biologic Duoflow system (Bio‐Rad). Buffer VL containing 200 mm NaCl was used to equilibrate the column and as running buffer. The column was calibrated with various proteins of known Stokes radius: alcohol dehydrogenase (ADH; 45 Å), albumin (A; 35.5 Å), ovalbumin (O; 30.5 Å), and carbonic anhydrase (CA; 20.1 Å). Elution positions were monitored at 280 nm. The K av value was calculated as (V e – V o)/(V t – V o), where V e is the elution volume, V o is the void volume (determined by elution of blue dextran), and V t is the total volume of the packed bed. Data were plotted according to Siegel and Monty 29.
Analytical ultracentrifugation
Experiments were performed at 12 °C in an Optima XL‐I analytical ultracentrifuge (Beckman‐Coulter, Brea, CA, USA) equipped with an UV‐visible optical detection system, using an An50Ti rotor and Epon‐charcoal standard double sector centerpieces (12 mm optical path). Sedimentation velocity assays were carried out at 185 795 g MafRV583 (5 and 10 μm; 350 μL) was equilibrated in buffer AU (50 mm Tris‐HCl, pH 7.6, 1 mm EDTA, 0.1 mm DTT; 3% glycerol, and 200 mm NaCl). The MafRV583 sedimentation coefficient was estimated applying a direct linear least squares boundary modeling of the sedimentation velocity data using the SEDFIT program (version 12.0) 30. The sedimentation coefficient was corrected to standard conditions to obtain the corresponding S 20,W value using the SEDNTERP program 31. The translational frictional coefficient (f) of MafRV583 was determined from the molecular mass and sedimentation coefficient values 32, whereas the frictional coefficient of the equivalent hydrated sphere (f 0) was estimated using a hydration of 0.37 g H20/g protein 33. With these parameters the translational frictional ratio (f/f 0) was calculated (MafRV583 hydrodynamic shape). Sedimentation equilibrium assays were performed at two protein concentrations (5 and 10 μm). Samples (90 μL) were centrifuged at two successive speeds (5161 and 8064 g) and absorbance readings were done after the sedimentation equilibrium was reached. The absorbance scans were taken at 280 and 291 nm, depending on MafRV583 concentration. In all cases, the baseline signals were measured after high‐speed centrifugation (129 024 g). Apparent average molecular masses of MafRV583 were determined using the HETEROANALYSIS program 34. The partial specific volume of MafRV583 was 0.742 mL·g−1, calculated from the amino acid composition with the SEDNTERP program 31.
Radioactive labeling of DNA fragments
Oligonucleotides were radioactively labeled at the 5′ end using [γ‐32P]‐ATP (3000 Ci/mmol; Perkin Elmer) and T4 polynucleotide kinase (New England Biolabs) as described 10. The 5′ labeled oligonucleotides were used for PCR amplification (labeling at either the coding or the noncoding strand).
Electrophoretic mobility shift assays
In general, binding reactions (10–20 μL) contained either nonlabeled DNA (10 nm) or 32P‐labeled DNA (1–2 nm) and different amounts of the purified protein. The binding buffer contained 30 mm Tris‐HCl, pH 7.6, 1 mm DTT, 0.2 mm EDTA, 1% glycerol, 50 mm NaCl, and 0.5 mg·mL−1 BSA. When indicated, nonlabeled competitor calf thymus DNA and 32P‐labeled DNA were added simultaneously to the binding reaction. Reaction mixtures were incubated at room temperature for 20 min. Free and bound DNA forms were separated by electrophoresis on native polyacrylamide (6% or 8%) gels (Mini‐PROTEAN system, Bio‐Rad). Gels were pre‐electrophoresed (20 min) and run at 100 V and room temperature. Labeled DNA was visualized using a Fujifilm Image Analyzer FLA‐3000.
DNase I footprinting assays
Binding reactions (50 μL) contained 2 nm of 32P‐labeled DNA, 30 mm Tris‐HCl, pH 7.6, 1 mm DTT, 0.2 mm EDTA, 1% glycerol, 50 mm NaCl, 0.5 mg·mL−1 BSA, 1 mm CaCl2, 10 mm MgCl2, and different concentrations of MafRV583. Reaction mixtures were incubated at room temperature for 20 min. Then, DNA was digested using 0.04 units of DNase I (Roche Applied Science). After 5 min at room temperature, reactions were stopped by adding 25 μL of Stop DNase I buffer (2 m ammonium acetate; 0.8 mm sodium acetate, 0.15 m EDTA). DNA was precipitated with ethanol, dried and dissolved in 5 μL of loading buffer (80% formamide, 10 mm NaOH, 0.1% bromophenol blue, 0.1% xylene cyanol, 1 mm EDTA). After heating at 95 °C for 5 min, samples were loaded onto 8 m urea‐6% polyacrylamide gels. Dideoxy‐mediated chain termination sequencing reactions were run in the same gel. Labeled products were visualized using a Fujifilm Image Analyzer FLA‐3000. The intensity of the bands was quantified using the Quantity One software (Bio‐Rad).
In silico prediction of intrinsic curvature
The bendability/curvature propensity plots were calculated with the bend.it server 35 (http://hydra.icgeb.trieste.it/dna/bend_it.html) as described previously 10.
Results
Purification of an untagged form of the MafRV583 protein
To overproduce and then purify an untagged form of the MafRV583 protein, we used a heterologous system based on the E. coli strain BL21 (DE3) and the inducible expression vector pET24b. The procedure used to purify MafRV583 involved basically four steps: (a) precipitation of DNA and MafRV583 with poly(ethyleneimine) using a low ionic strength buffer; (b) elution of MafRV583 from the poly(ethyleneimine) pellet using a higher ionic strength buffer; (c) fractionation of proteins by heparin chromatography; and (d) fractionation of proteins by gel filtration chromatography (Fig. 1A). Purified MafRV583 was analyzed by SDS/PAGE (12%). It migrated between standard proteins of 45 and 66 kDa, which is consistent with the theoretical molecular weight of the MafRV583 monomer (56 247 Da). Further determination of the N‐terminal amino acid sequence (eight residues) of MafRV583 by Edman degradation showed that the first Met residue was not removed.
Figure 1.
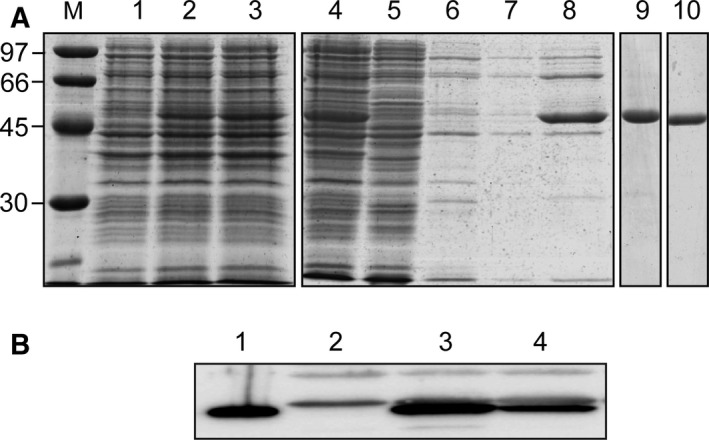
(A) Purification of MafRV583. Proteins were analyzed by SDS/PAGE (12%). Gels were stained with Coomassie Blue. Lane M: molecular weight standards (in kDa) were run in the same gel (LMW Marker, GE Healthcare). Lane 1: total proteins from cells nontreated with IPTG. Lane 2: total proteins from cells treated with IPTG for 25 min. Lane 3: total proteins from cells treated with IPTG (25 min) and then with rifampicin (60 min). Purification steps (lanes 4–10): cleared cell lysate (lane 4); supernatant after DNA precipitation with poly(ethyleneimine) in the presence of 200 mm NaCl (lane 5); proteins eluted from the poly(ethyleneimine) pellet using a buffer that contains 200 mm NaCl (lanes 6, 7); proteins eluted from the poly(ethyleneimine) pellet using a buffer that contains 500 mm NaCl (lane 8); protein preparation after heparin affinity chromatography (lane 9); protein preparation after gel filtration chromatography (lane 10). (B) Detection of MafRV583 in E. faecalis cell extracts by western blotting. Rabbit polyclonal antibodies against MafRV583 were used. Total proteins from JH2‐2 cells harboring plasmid pDLF (lane 2), plasmid pDLFmafR V583 (lane 3), and plasmid pDLSmafR V583 (lane 4) were separated by SDS/PAGE (10%). Purified MafRV583 (lane 1) was run in the same gel.
Next, we obtained polyclonal antibodies against MafRV583 and demonstrated that they are suitable for detection of MafRV583 in enterococcal whole‐cell extracts by western blotting (Fig. 1B). Specifically, we inserted the mafR V583 gene into the expression vectors pDLF 6 and pDLS (this work), which are based on the enterococcal P2493 promoter and the pneumococcal PsulA promoter, respectively 26. Each recombinant plasmid (pDLFmafR V583 and pDLSmafR V583) was introduced into the enterococcal JH2‐2 strain, which is a plasmid‐free strain. As internal control, plasmid pDLF (‘empty’ vector) was introduced into JH2‐2. Compared to cells harboring plasmid pDLSmafR V583, the amount of MafRV583 was ~ 3‐fold higher in cells harboring plasmid pDLFmafR V583 (Fig. 1B). This result is consistent with our previous results, which showed that the activity of the P2493 promoter is ~ 3.8‐fold higher than the activity of the PsulA promoter in E. faecalis JH2‐2 cells 26.
Hydrodynamic behavior of MafRV583
Gel filtration chromatography allowed us to determine the molecular size (Stokes radius) of the untagged MafRV583 protein. MafRV583 eluted from the column as a single peak (Fig. 2A). The elution volume was used to calculate the K av value as indicated in Materials and Methods. A calibration curve was obtained by loading onto the column several standard proteins of known Stokes radius (Fig. 2A). The Stokes radius of MafRV583 determined from the calibration curve was 43 Å, slightly lower than the value of the alcohol dehydrogenase standard protein (45 Å, 150 kDa). This result indicated that MafRV583 behaves as a dimer in solution. This conclusion was further confirmed by analytical ultracentrifugation experiments (sedimentation velocity and sedimentation equilibrium) (Fig. 2B). At 5 and 10 μm of MafRV583, the sedimentation velocity profiles showed a major peak (92–98%) with an S 20,w value of 6 S. A minor peak (4–6%) corresponding to a molecular species of higher sedimentation coefficient (S 20,w = 6.4 S) was also observed. Sedimentation equilibrium assays showed that, at 5 μm of MafRV583, the experimental data are best fit to an average molecular mass (M w,a) of 118 000 ± 1000 Da, a value that corresponds with the theoretical mass of a MafRV583 dimer (112 495 Da). A similar average molecular mass was determined at 10 μm (121 000 ± 1000 Da). Thus, under the conditions tested, the MafRV583 dimer is the major molecular species in the protein preparation. The frictional ratio (f/f 0) calculated from the analytical ultracentrifugation assays was 1.34, indicating that the hydrodynamic behavior of the MafRV583 dimer deviates from the behavior corresponding to a rigid spherical particle (f/f 0 = 1.0). From these results we conclude that the shape of the MafRV583 dimer is an ellipsoid.
Figure 2.
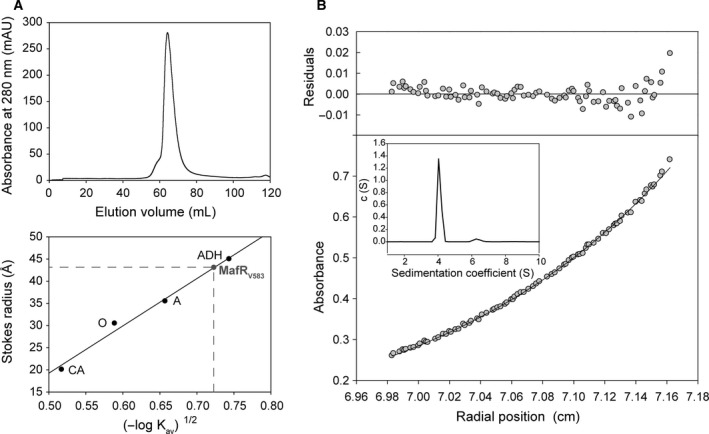
(A) Stokes radius of MafRV583 determined by gel filtration chromatography. Upper part: elution profile of MafRV583 on a HiLoad Superdex 200 gel filtration column. Lower part: four standard proteins of known Stokes radius were loaded on the same column. CA: carbonic anhydrase. O: ovalbumin. A: albumin. ADH: alcohol dehydrogenase. (B) Analytical ultracentrifugation analysis of MafRV583. The sedimentation equilibrium profile of MafRV583 (5 μm) was taken at 280 nm. The lower part shows the experimental data (circles) and the best fit (continuous line) to a single species with a M w,a = 118 000 Da. The residuals to the fit are shown in the upper part. Inset: sedimentation velocity profile of the same MafRV583 sample.
MafRV583 generates multimeric complexes on linear dsDNA
The pneumococcal MgaSpn regulator, a member of the Mga/AtxA family, was shown to generate multimeric complexes on linear dsDNAs 10. In this work, we analyzed whether MafRV583 has a similar ability. Firstly, we performed electrophoretic mobility shift assays (EMSAs) using a 217‐bp DNA fragment (coordinates 2888932–2889148 of the V583 chromosome) (Fig. 3A), which contains the promoter of the mafR gene (promoter Pma) 6. The 32P‐labeled DNA fragment (2 nm) was incubated with increasing concentrations of MafRV583 in the presence of nonlabeled competitor calf thymus DNA (5 μg·mL−1) (Fig. 4A). At 20 nm of MafRV583, free DNA and a protein–DNA complex (C1) were observed. However, as the concentration of MafRV583 was increased, complexes of lower electrophoretic mobility appeared sequentially and faster moving complexes disappeared gradually. Secondly, we performed dissociation experiments (Fig. 4B). The 32P‐labeled DNA fragment (2 nm) was incubated with MafRV583 (260 nm) in the absence of competitor DNA to generate higher order protein–DNA complexes (Fig. 4B, lane 1). Then, different amounts of calf thymus DNA were added to the reaction mixtures. As the concentration of competitor DNA was increased, protein–DNA complexes moving faster appeared gradually, as well as free DNA molecules. Taken together, these results indicated that multiple units of MafRV583 bind orderly on the same linear DNA molecule generating multimeric complexes. Moreover, the MafRV583 units are able to dissociate orderly from the higher order complexes.
Figure 3.
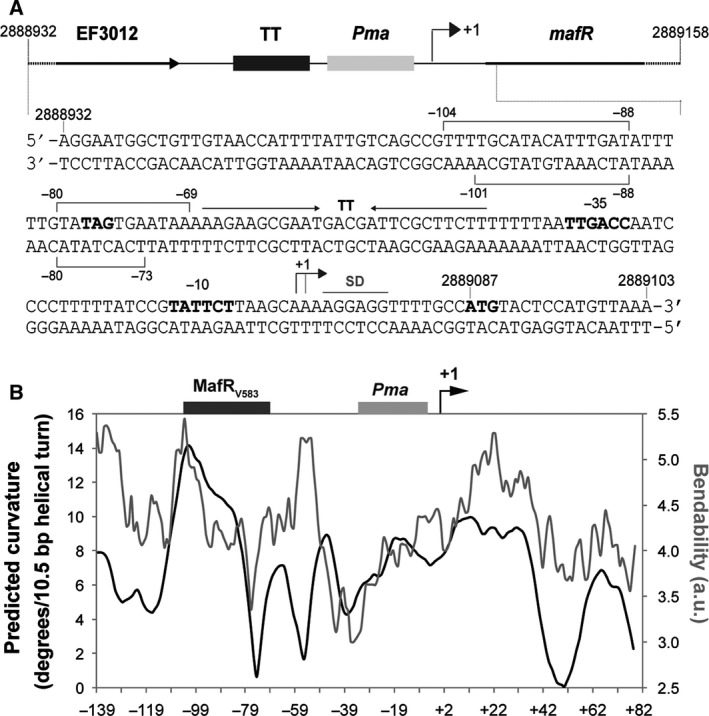
(A) Relevant features of the region located upstream of the mafR gene. The nucleotide sequence of the region that spans coordinates 2888932–2889103 of the E. faecalis V583 chromosome is shown. The stop codon (TAG) of EF3012, the main sequence elements of the Pma promoter (−35 box and −10 box), and the start codon (ATG) of mafR are indicated in boldface letters. The transcriptional terminator (TT) of EF3012, the transcription start site (+ 1 position) of mafR, and the putative Shine‐Dalgarno sequence (SD) of mafR 6 are shown. The brackets denote the primary MafRV583‐binding site defined by DNase I footprinting assays in this work. (B) The region upstream of the Pma promoter is potentially curved. The bendability/curvature propensity plot of the 227‐bp DNA fragment (coordinates 2888932–2889158 of the V583 chromosome) was calculated using the bend.it program 35. The transcription start site (+ 1) of the mafR V583 gene is indicated with an arrow. The location of the main sequence elements of the Pma promoter (−35 and −10 elements) is shown (gray box). The site recognized preferentially by MafRV583 on the 227‐bp DNA fragment (this work, Fig. 5) is indicated (black box).
Figure 4.
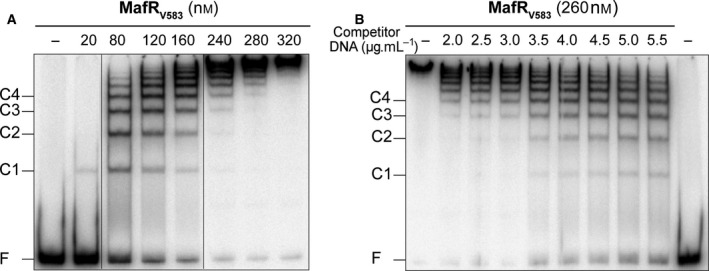
(A) Formation of MafRV583–DNA complexes. The 32P‐labeled 217‐bp DNA fragment (2 nm) was incubated with the indicated concentration of MafRV583 in the presence of nonlabeled calf thymus DNA (5 μg·mL−1). Reaction mixtures were loaded onto a native gel (6% polyacrylamide). All the lanes came from the same gel. Bands corresponding to free DNA (F) and some MafRV583–DNA complexes (C1, C2, C3, and C4) are indicated. (B) Dissociation of MafRV583‐DNA complexes. The indicated concentration of nonlabeled competitor calf thymus DNA was added to preformed MafRV583–DNA complexes (260 nm MafRV583, 2 nm 32P‐labeled 217‐bp DNA).
Further EMSAs using different linear dsDNAs indicated that MafRV583, like the MgaSpn regulator 10, binds to DNA with little or no sequence specificity. Specifically, we used a 321‐bp DNA fragment from the enterococcal V583 chromosome (coordinates 94488–94808) and a 322‐bp DNA fragment from the pneumococcal R6 chromosome (coordinates 1598010–1598331). Although both DNAs have a similar A + T content (72.3% and 71.1%, respectively), sequence similarities between them are not apparent. As shown in Fig. S1 (Supplementary material), MafRV583 was able to form multimeric complexes on both DNA fragments. Moreover, the pattern of complexes was similar to that generated by MafRV583 on the 217‐bp DNA fragment (Fig. 4A).
By EMSA, we also analyzed the ability of a His‐tagged MafRV583 protein (MafRV583‐His) to interact with linear dsDNAs. This variant of MafRV583 carries the Leu‐Glu‐6xHis peptide (His‐tag) fused to its C terminus. As shown in Fig. S2 (Supplementary material), MafRV583‐His was able to generate multiple complexes on a 260‐bp DNA fragment (coordinates 2888858–2889117 of the V583 chromosome) that contains the Pma promoter (Fig. 3A). Thus, the presence of the His‐tag at the C‐terminal end of MafRV583 does not affect its ability to generate multimeric complexes.
MafRV583 binds to a potentially curved DNA region
Regulators of the Mga/AtxA family appear to bind DNA with low sequence specificity. It has been shown that all established Mga‐binding sites exhibit only 13.4% identity 16. In the case of AtxA, sequence similarities in its target promoters are not apparent, and in silico and in vitro analyses revealed that the promoter regions of several target genes are intrinsically curved 20. Moreover, in vitro studies indicated that MgaSpn recognizes structural features in its DNA targets rather than specific nucleotide sequences 10, 19. To further investigate the DNA‐binding properties of MafRV583, we performed DNase I footprinting experiments. We used a 227‐bp DNA fragment (coordinates 2888932–2889158) that contains the Pma promoter (Fig. 3A). Figure 3B shows the bendability/curvature propensity plot of this DNA fragment according to the bend.it program 35. The highest magnitude of curvature propensity (~ 14 degrees per helical turn) is located at position −104 relative to the transcription start site of the mafR V583 gene. Thus, the region upstream of the Pma promoter is potentially curved. Moreover, such a predicted curvature is located at a region of conspicuous bendability.
The 227‐bp DNA fragment (2 nm) was 32P‐labeled either at the 5′‐end of the coding strand or at the 5′‐end of the noncoding strand (Fig. 5). On the coding strand and at 80 nm of MafRV583, two regions protected against DNase I digestion were observed, from position −69 to −80 and from position −88 to −104. On the noncoding strand and at 120 nm of MafRV583, diminished cleavages were observed from −73 to −80 and from −88 to −101. These results indicated that, on the 227‐bp DNA, MafRV583 binds preferentially to a region located upstream of the Pma promoter (between positions −69 and −104) (Fig. 3A). Such a site is adjacent to the peak of the potential curvature (Fig. 3B). On both DNA strands and at 200 nm of MafRV583, regions protected against DNase I digestion were observed along the DNA fragment, which is consistent with the pattern of protein–DNA complexes observed by EMSA (Fig. 4A).
Figure 5.
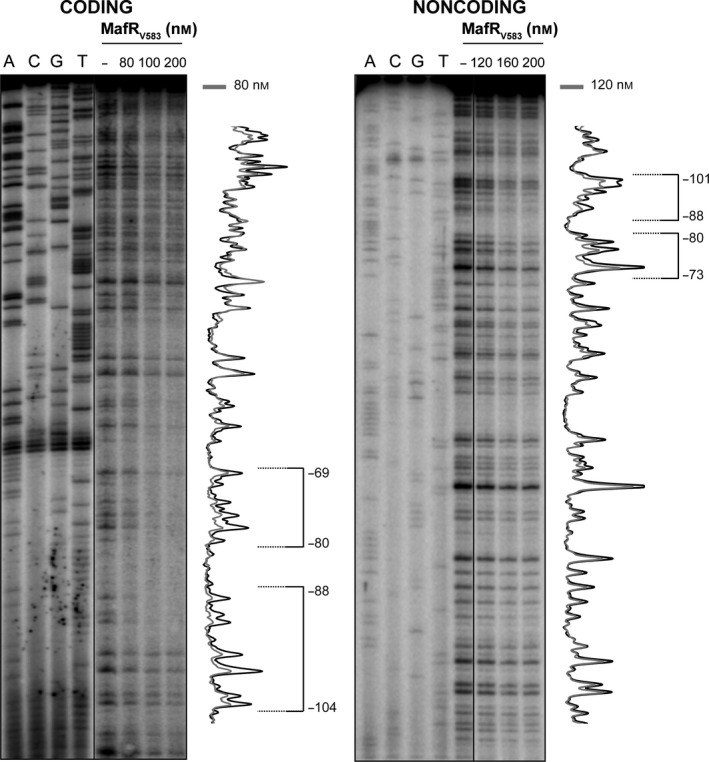
DNase I footprints of complexes formed by MafRV583 on the 227‐bp DNA fragment. Either the coding or the noncoding strand relative to the Pma promoter was 32P‐labeled at the 5′‐end. All the lanes displayed came from the same gel. Dideoxy‐mediated chain termination sequencing reactions were run in the same gel (lanes A, C, G, T). Densitometer scans corresponding to DNA without protein (black line) and DNA with the indicated concentration of protein (gray line) are shown. The regions protected against DNase I digestion are indicated with brackets. The indicated positions are relative to the transcription start site of the mafR V583 gene.
MafRV583 binds to a 32‐bp DNA but not to a 26‐bp DNA
To define the minimum size of DNA needed for binding of MafRV583, we used dsDNAs of 20, 26, 32, and 40 bp, which were obtained by annealing of complementary oligonucleotides. The sequence of such oligonucleotides (Table 1) was based on the pneumococcal R6 genome, and identical sequences were not found in the enterococcal V583 genome. The nonlabeled dsDNAs were incubated with increasing concentrations of MafRV583. Reaction mixtures were then analyzed by electrophoresis on native polyacrylamide gels. In the case of the 20‐bp DNA, a faint band was observed at 0.3 μm of MafRV583 (Fig. 6A). However, its intensity did not change significantly as the protein concentration was increased. Most of the DNA moved as free DNA even at high protein concentrations (6–9 μm). In the case of the 26‐bp DNA, most of the DNA moved as free DNA at 4 μm of MafRV583 (Fig. 6B). Different results were obtained with the 32‐bp DNA (Fig. 6B) and the 40‐bp DNA (not shown). In both cases, a protein–DNA complex was detected at 0.2 μm of MafRV583, and its amount increased as the amount of free DNA decreased. From these results we conclude that the minimum size of DNA required for MafRV583 binding is between 26 bp and 32 bp. In the case of the pneumococcal MgaSpn regulator, the minimum DNA size for binding was reported to be between 20 bp and 26 bp 10.
Figure 6.
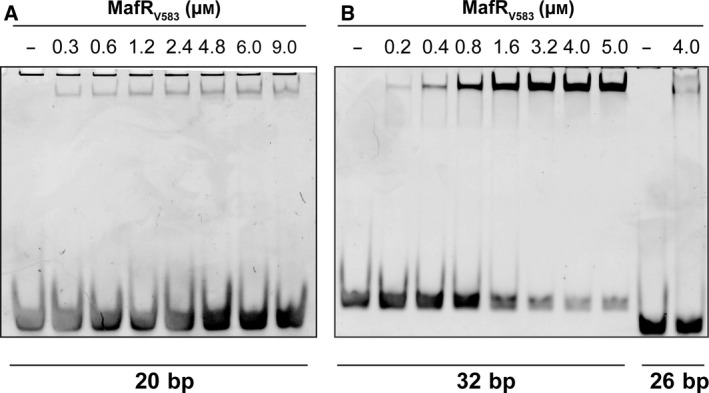
EMSAs using MafRV583 and small DNA fragments. DNA fragments were obtained by annealing of complementary oligonucleotides. (A) Oligonucleotides 20A/20B were used to generate the 20‐bp DNA. (B) Oligonucleotides 26A/26B and 32A/32B were used to generate the 26‐ and 32‐bp DNAs, respectively. The indicated concentration of MafRV583 was mixed with 300 nm (20 and 26 bp) or 200 nm (32 bp) of DNA. Binding reactions were analyzed by native polyacrylamide (8%) gel electrophoresis. DNA was stained with GelRed (Biotium) and visualized using a Gel Doc system (Bio‐Rad).
Protein MafROG1RF‐His, but not MafROG1RF∆3N‐His, binds to DNA
The genome sequence of the enterococcal OG1RF strain was published in 2008 22. Compared to strain V583 21, the OG1RF genome contains 227 unique open reading frames but has fewer mobile genetic elements. Despite this difference between both genomes, the nucleotide sequence of the region that spans coordinates 2888932–2889103 in V583 is identical in OG1RF (Fig. 3A). Such a region contains the Pma promoter 6 and the primary binding site of MafRV583 (this work). However, in contrast to MafRV583, MafR encoded by the OG1RF genome (MafROG1RF) has five amino acid changes (Ala37Thr, Gln131Leu, Met145Thr, Ser193Asn, Ile388Ser), and three of them (Ala37Thr, Gln131Leu, Met145Thr) are located within the predicted DNA‐binding domain (residues 11–164). To analyze whether these changes affect the formation of protein–DNA complexes, we purified a His‐tagged MafROG1RF protein (MafROG1RF‐His). MafROG1RF‐His carries the His‐tag fused to its C terminus. EMSA experiments showed that MafROG1RF‐His is able to form multimeric complexes on the 217‐bp DNA fragment that contains the Pma promoter (Fig. 7). The pattern of complexes was similar to that generated by MafRV583 (Fig. 4A). Thus, the amino acid substitutions of MafROG1RF do not affect its interaction with DNA.
Figure 7.
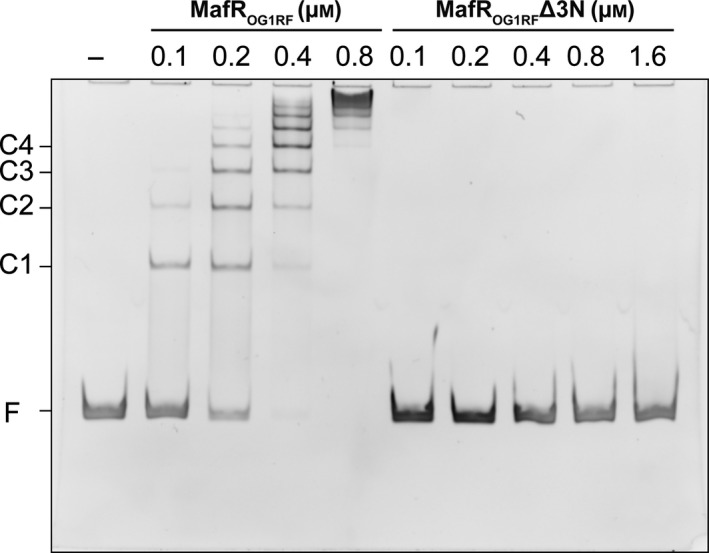
EMSAs with MafROG1RF‐His and MafROG1RF∆3N‐His The 217‐bp DNA fragment (10 nm) was incubated with the indicated concentration of protein. Reaction mixtures were loaded onto a native gel (6% polyacrylamide). Bands corresponding to free DNA (F) and protein–DNA complexes (C1, C2, C3, and C4) are indicated. DNA was stained with GelRed (Biotium) and visualized using a Gel Doc system (Bio‐Rad).
We identified previously the transcription initiation site of the mafR V583 gene at coordinate 2889071, and proposed that the first ATG codon is likely the translation start site 6 (Fig. 3A). Translation from this ATG generates a protein of 482 amino acid residues (MafRV583 and MafROG1RF). However, there is a second ATG codon that might function as a translation start site. Translation from this second ATG would result in a variant that lacks the first three amino acid residues (here named MafROG1RF∆3N). To analyze whether the lack of these residues (Met‐Tyr‐Ser) impairs the formation of protein–DNA complexes, we purified a His‐tagged MafROG1RF∆3N protein (MafROG1RF∆3N‐His). The sequence of its N‐terminal end (eight residues) was confirmed by Edman degradation. EMSA experiments showed that MafROG1RF∆3N‐His has lost the capacity to interact with DNA (Fig. 7). From these results we conclude that (a) the first ATG codon is the translation start site, and (b) the first three amino acid residues of MafROG1RF are crucial for its structure and/or function.
Discussion
Bacteria have evolved complex regulatory networks to rapidly adapt to environmental fluctuations. Global transcriptional regulators are key elements in such networks due to their ability to activate and/or repress the expression of multiple genes through a variety of mechanisms. In E. faecalis, various transcriptome analyses support the notion that bacterial adaptation is associated with global changes in gene expression 7, 8, 36. Our previous work identified MafR as a protein involved in global regulation of gene expression. Moreover, we proposed that MafR is a member of the Mga/AtxA family of global regulators. This proposal was based on amino acid sequence similarities and predictions of functional domains 6. However, the interaction of MafR with DNA has not previously been investigated.
In this work, we purified an untagged form of the MafRV583 protein. Using MafRV583 and various linear dsDNAs, we have found that the DNA‐binding behavior of MafRV583 is very similar to the one described for the pneumococcal MgaSpn regulator 10. First, gel retardation assays indicated that MafRV583 is able to bind DNA with low sequence specificity. Second, on a 227‐bp DNA fragment that contains the Pma promoter, footprinting experiments showed that MafRV583 binds preferentially to a site that is adjacent to the peak of a potential curvature. Such a binding site is located upstream of the Pma promoter (positions −69 to −104). In the case of MgaSpn, two primary binding sites were identified by footprinting experiments: the P1623B promoter site (positions −60 to −99) and the Pmga promoter site (positions −23 to + 21) 10. Both binding sites have a low sequence identity but contain an intrinsic curvature flanked by regions of bendability. Regarding the Mga and AtxA regulators, a low sequence identity has been found in the target promoters 13, 16, 20. Moreover, the promoter regions of some AtxA target genes are intrinsically curved 20.
Another interesting finding of our current study is that MafRV583, like MgaSpn 10 , is able to generate multimeric complexes on linear dsDNAs. In both cases, the pattern of complexes observed by EMSA is compatible with a sequential binding of multiple protein units (likely dimers) to the same DNA molecule. Furthermore, in both cases, the protein units dissociate sequentially from the higher order complexes in the presence of increasing amounts of competitor DNA. Formation of multimeric protein–DNA complexes has not been reported for the Mga regulator. Nevertheless, a correlation between its ability to oligomerize in solution (without DNA) and its ability to activate transcription has been shown 18. Regarding AtxA, protein–DNA interaction studies have not been reported, but protein–protein interaction analyses revealed that AtxA exists in a homo‐oligomeric state 37.
The genome sequence of the E. faecalis V583 clinical isolate was published in 2003 21. Five years later the genome sequence of the OG1RF strain was published 22. This strain is a derivative of the OG1 human isolate. At present, 557 E. faecalis genomes have been totally or partially sequenced (NCBI, Genome Assembly and Annotation Report, 22/12/2017). Among them, we have found that 146 E. faecalis genomes encode a protein that is identical to MafRV583 (Table S1). Furthermore, we have found that 50 E. faecalis genomes encode a protein that is identical to MafROG1RF (Table S2). Compared to MafRV583, MafROG1RF has five amino acid substitutions, and three of them (Ala37Thr, Gln131Leu, Met145Thr) are located within the putative DNA‐binding domain (Table 2). Despite this difference between MafRV583 and MafROG1RF, we have shown that both proteins are able to generate multimeric complexes on linear dsDNAs, which could be an indication of functional conservation. Moreover, we have shown that removal of the first three amino acids in MafROG1RF, and likely in MafRV583, results in a protein unable to interact with DNA. Similar DNA‐binding properties are expected for MafR from the strains that belong to the groups GA2, KS19, MTmid8, B653, X98, AZ19 and Com1 (Table S3). Compared to MafRV583, MafR from such strains has one to four amino acid substitutions, and all of them are present in MafROG1RF (Table 2).
Table 2.
Amino acid substitutions in the indicated MafR proteins compared to MafRV583. Data from the National Center for Biotechnology Information (Identical Protein Groups) (22/12/2017)
In conclusion, recognition of specific sites across the genome by transcriptional regulators is essential for controlling gene expression. Different mechanisms for protein recognition of specific DNA sites have been characterized. In some cases, DNA‐binding proteins recognize intrinsic DNA structural characteristics rather than particular nucleotide sequences 2, 38. Examples where both DNA base sequence and shape recognition are required for protein binding have been also reported 39, 40, 41. Our study on the DNA‐binding properties of MafR reinforces that recognition of particular DNA structures might be a general feature of the global regulators that constitute the Mga/AtxA family.
Author contributions
SR‐C and AM‐B performed experiments. SR‐C, ME and AB designed the study and wrote the manuscript. All authors read and approved the final manuscript.
Supporting information
Data S1. Supplementary material.
Acknowledgements
We thank Dr. Virtu Solano‐Collado for helpful discussions. This work was supported by grants BIO2016‐76412‐C2‐2‐R (AEI/FEDER, UE) and BIO2015‐69085‐REDC from the Spanish Ministry of Economy and Competitiveness.
Edited by Renee Tsolis
References
- 1. Siggers T and Gordân R (2014) Protein‐DNA binding: complexities and multi‐protein codes. Nucleic Acids Res 42, 2099–2111. [DOI] [PMC free article] [PubMed] [Google Scholar]
- 2. Rohs R, Jin X, West SM, Joshi R, Honig B and Mann RS (2010) Origins of specificity in protein‐DNA recognition. Annu Rev Biochem 79, 233–269. [DOI] [PMC free article] [PubMed] [Google Scholar]
- 3. Ramsey M, Hartke A and Huycke M (2014) The physiology and metabolism of Enterococci In Enterococci: From Commensals to Leading Causes of Drug Resistant Infection (Internet) (Gilmore MS, Clewell DB, Ike Y. and Shankar N, eds), pp. 1–43. Massachusetts Eye and Ear Infirmary, Boston. [PubMed] [Google Scholar]
- 4. Hollenbeck BL and Rice LB (2012) Intrinsic and acquired resistance mechanisms in enterococcus. Virulence 3, 421–433. [DOI] [PMC free article] [PubMed] [Google Scholar]
- 5. Fisher K and Phillips C (2009) The ecology, epidemiology and virulence of Enterococcus . Microbiology 155, 1749–1757. [DOI] [PubMed] [Google Scholar]
- 6. Ruiz‐Cruz S, Espinosa M, Goldmann O and Bravo A (2016) Global regulation of gene expression by the MafR protein of Enterococcus faecalis . Front Microbiol 6, 1521. [DOI] [PMC free article] [PubMed] [Google Scholar]
- 7. Vebø HC, Snipen L, Nes IF and Brede DA (2009) The transcriptome of the nosocomial pathogen Enterococcus faecalis V583 reveals adaptive responses to growth in blood. PLoS One 4, e7660. [DOI] [PMC free article] [PubMed] [Google Scholar]
- 8. Vebø HC, Solheim M, Snipen L, Nes IF and Brede DA (2010) Comparative genomic analysis of pathogenic and probiotic Enterococcus faecalis isolates, and their transcriptional responses to growth in human urine. PLoS One 5, e12489. [DOI] [PMC free article] [PubMed] [Google Scholar]
- 9. Hondorp ER, Hou SC, Hause LL, Gera K, Lee C‐E and McIver KS (2013) PTS phosphorylation of Mga modulates regulon expression and virulence in the group A streptococcus. Mol Microbiol 88, 1176–1193. [DOI] [PMC free article] [PubMed] [Google Scholar]
- 10. Solano‐Collado V, Lurz R, Espinosa M and Bravo A (2013) The pneumococcal MgaSpn virulence transcriptional regulator generates multimeric complexes on linear double‐stranded DNA. Nucleic Acids Res 41, 6975–6991. [DOI] [PMC free article] [PubMed] [Google Scholar]
- 11. Hammerstrom TG, Horton LB, Swick MC, Joachimiak A, Osipiuk J and Koehler TM (2015) Crystal structure of Bacillus anthracis virulence regulator AtxA and effects of phosphorylated histidines on multimerization and activity. Mol Microbiol 95, 426–441. [DOI] [PMC free article] [PubMed] [Google Scholar]
- 12. Finn RD, Coggill P, Eberhardt RY, Eddy SR, Mistry J, Mitchell AL, Potter SC, Punta M, Qureshi M, Sangrador‐Vegas A et al (2016) The Pfam protein families database: towards a more sustainable future. Nucleic Acids Res 44, D279–D285. [DOI] [PMC free article] [PubMed] [Google Scholar]
- 13. Hondorp ER and McIver KS (2007) The Mga virulence regulon: infection where the grass is greener. Mol Microbiol 66, 1056–1065. [DOI] [PubMed] [Google Scholar]
- 14. Solano‐Collado V, Espinosa M and Bravo A (2012) Activator role of the pneumococcal Mga‐like virulence transcriptional regulator. J Bacteriol 194, 4197–4207. [DOI] [PMC free article] [PubMed] [Google Scholar]
- 15. Ribardo DA and McIver KS (2006) Defining the Mga regulon: comparative transcriptome analysis reveals both direct and indirect regulation by Mga in the group A streptococcus. Mol Microbiol 62, 491–508. [DOI] [PubMed] [Google Scholar]
- 16. Hause LL and McIver KS (2012) Nucleotides critical for the interaction of the Streptococcus pyogenes Mga virulence regulator with Mga‐regulated promoter sequences. J Bacteriol 194, 4904–4919. [DOI] [PMC free article] [PubMed] [Google Scholar]
- 17. McIver KS, Heath AS, Green BD and Scott JR (1995) Specific binding of the activator Mga to promoter sequences of the emm and scpA genes in the group A streptococcus. J Bacteriol 177, 6619–6624. [DOI] [PMC free article] [PubMed] [Google Scholar]
- 18. Hondorp ER, Hou SC, Hempstead AD, Hause LL, Beckett DM and McIver KS (2012) Characterization of the group A streptococcus Mga virulence regulator reveals a role for the C‐terminal region in oligomerization and transcriptional activation. Mol Microbiol 83, 953–967. [DOI] [PMC free article] [PubMed] [Google Scholar]
- 19. Solano‐Collado V, Hüttener M, Espinosa M, Juárez A and Bravo A (2016) MgaSpn and H‐NS: two unrelated global regulators with similar DNA‐binding properties. Front Mol Biosci 3, 60. [DOI] [PMC free article] [PubMed] [Google Scholar]
- 20. Hadjifrangiskou M and Koehler TM (2008) Intrinsic curvature associated with the coordinately regulated anthrax toxin gene promoters. Microbiology 154, 2501–2512. [DOI] [PMC free article] [PubMed] [Google Scholar]
- 21. Paulsen IT, Banerjei L, Myers GSA, Nelson KE, Seshadri R, Read TD, Fouts DE, Eisen JA, Gill SR, Heidelberg JF et al (2003) Role of mobile DNA in the evolution of vancomycin‐resistant Enterococcus faecalis . Science 299, 2071–2074. [DOI] [PubMed] [Google Scholar]
- 22. Bourgogne A, Garsin DA, Qin X, Singh KV, Sillanpaa J, Yerrapragada S, Ding Y, Dugan‐Rocha S, Buhay C, Shen H et al (2008) Large scale variation in Enterococcus faecalis illustrated by the genome analysis of strain OG1RF. Genome Biol 9, R110. [DOI] [PMC free article] [PubMed] [Google Scholar]
- 23. Hoskins J, Alborn WE Jr, Arnold J, Blaszczak LC, Burgett S, DeHoff BS, Estrem ST, Fritz L, Fu D‐J, Fuller W et al (2001) Genome of the bacterium Streptococcus pneumoniae strain R6. J Bacteriol 183, 5709–5717. [DOI] [PMC free article] [PubMed] [Google Scholar]
- 24. Jacob AE and Hobbs SJ (1974) Conjugal transfer of plasmid‐borne multiple antibiotic resistance in Streptococcus faecalis var. zymogenes . J Bacteriol 117, 360–372. [DOI] [PMC free article] [PubMed] [Google Scholar]
- 25. LeBlanc DJ, Chen YY and Lee LN (1993) Identification and characterization of a mobilization gene in the streptococcal plasmid, pVA380‐1. Plasmid 30, 296–302. [DOI] [PubMed] [Google Scholar]
- 26. Ruiz‐Cruz S, Solano‐Collado V, Espinosa M and Bravo A (2010) Novel plasmid‐based genetic tools for the study of promoters and terminators in Streptococcus pneumoniae and Enterococcus faecalis . J Microbiol Methods 83, 156–163. [DOI] [PubMed] [Google Scholar]
- 27. Dower WJ, Miller JF and Ragsdale CW (1988) High efficiency transformation of E. coli by high voltage electroporation. Nucleic Acids Res 16, 6127–6145. [DOI] [PMC free article] [PubMed] [Google Scholar]
- 28. Shepard BD and Gilmore MS (1995) Electroporation and efficient transformation of Enterococcus faecalis grown in high concentrations of glycine. Methods Mol Biol 47, 217–226. [DOI] [PubMed] [Google Scholar]
- 29. Siegel LM and Monty KJ (1966) Determination of molecular weights and frictional ratios of proteins in impure systems by the use of gel filtration and density gradient centrifugation. Applications to crude preparations of sulfite and hydroxylamine reductases. Biochim Biophys Acta 112, 346–362. [DOI] [PubMed] [Google Scholar]
- 30. Schuck P and Rossmanith P (2000) Determination of the sedimentation coefficient distribution by least‐squares boundary modeling. Biopolymers 54, 328–341. [DOI] [PubMed] [Google Scholar]
- 31. Laue TM, Shah BD, Ridgeway TM and Pelletier SL (1992) Computer‐aided interpretation of analytical sedimentation data for proteins In Analytical Ultracentrifugation in Biochemistry and Polymer Sciences (Harding SE, Rowe A. and Horton JC, eds), pp. 90–125. Royal Society of Chemistry, Cambridge. [Google Scholar]
- 32. van Holde KE (1985) Physical Biochemistry. Prentice‐Hall, Englewood Cliffs. [Google Scholar]
- 33. Pessen H and Kumosinski TF (1985) Measurements of protein hydration by various techniques. Methods Enzymol 117, 219–255. [DOI] [PubMed] [Google Scholar]
- 34. Cole JL (2004) Analysis of heterogeneous interactions. Methods Enzymol 384, 212–232. [DOI] [PMC free article] [PubMed] [Google Scholar]
- 35. Vlahovicek K, Kaján L and Pongor S (2003) DNA analysis servers: plot.it, bend.it, model.it and IS. Nucleic Acids Res 31, 3686–3687. [DOI] [PMC free article] [PubMed] [Google Scholar]
- 36. Lindenstrauss AG, Ehrmann MA, Behr J, Landstorfer R, Haller D, Sartor RB and Vogel RF (2014) Transcriptome analysis of Enterococcus faecalis toward its adaption to surviving in the mouse intestinal tract. Arch Microbiol 196, 423–433. [DOI] [PubMed] [Google Scholar]
- 37. Hammerstrom TG, Roh JH, Nikonowicz EP and Koehler TM (2011) Bacillus anthracis virulence regulator AtxA: oligomeric state, function and CO2 ‐signalling. Mol Microbiol 82, 634–647. [DOI] [PMC free article] [PubMed] [Google Scholar]
- 38. Abe N, Dror I, Yang L, Slattery M, Zhou T, Bussemaker HJ, Rohs R and Mann RS (2015) Deconvolving the recognition of DNA shape from sequence. Cell 161, 307–318. [DOI] [PMC free article] [PubMed] [Google Scholar]
- 39. Deng Z, Wang Q, Liu Z, Zhang M, Machado ACD, Chiu TP, Feng C, Zhang Q, Yu L, Qi L et al (2015) Mechanistic insights into metal ion activation and operator recognition by the ferric uptake regulator. Nat Commun 6, 7642. [DOI] [PMC free article] [PubMed] [Google Scholar]
- 40. Ding P, McFarland KA, Jin S, Tong G, Duan B, Yang A, Hughes TR, Liu J, Dove SL, Navarre WW et al (2015) A novel AT‐rich DNA recognition mechanism for bacterial xenogeneic silencer MvaT. PLoS Pathog 11, e1004967. [DOI] [PMC free article] [PubMed] [Google Scholar]
- 41. Al‐Zyoud WA, Hynson RMG, Ganuelas LA, Coster ACF, Duff AP, Baker MAB, Stewart AG, Giannoulatou E, Ho JWK, Gaus K et al (2016) Binding of transcription factor GabR to DNA requires recognition of DNA shape at a location distinct from its cognate binding site. Nucleic Acids Res 44, 1411–1420. [DOI] [PMC free article] [PubMed] [Google Scholar]
Associated Data
This section collects any data citations, data availability statements, or supplementary materials included in this article.
Supplementary Materials
Data S1. Supplementary material.