

Abstract
Atopic dermatitis is a chronic inflammatory skin disease. The objective of this study was to characterize the burden of atopic dermatitis in Japanese adult patients relative to the general population. Japanese adults (≥18 years) with a self‐reported diagnosis of atopic dermatitis and adult controls without atopic dermatitis/eczema/dermatitis were identified from the 2013 Japan National Health and Wellness Survey. Atopic dermatitis patients were propensity‐score matched with non‐atopic dermatitis controls (1:2 ratio) on demographic variables. Patient‐reported outcome data on comorbidities, mood and sleep disorders, health‐related quality of life, work productivity and activity impairment, and health‐care resource utilization were analyzed in atopic dermatitis patients and matched controls. A total of 638 Japanese adult patients with atopic dermatitis were identified, of whom 290 (45.5%) rated their disease as “moderate/severe” and 348 (54.5%) as “mild”. The analysis cohort comprised 634 atopic dermatitis patients and 1268 matched controls. Atopic dermatitis patients reported a significantly higher prevalence of arthritis, asthma, nasal allergies/hay fever, anxiety, depression and sleep disorders compared with controls (all P < 0.001). Atopic dermatitis patients also reported a significantly poorer health‐related quality of life, higher overall work and activity impairment, and higher health‐care resource utilization (all P < 0.001). Self‐rated disease severity was not associated with disease burden, except for a significantly higher overall work and activity impairment. In conclusion, Japanese adult patients with atopic dermatitis reported a substantial disease burden relative to adults without atopic dermatitis, suggesting an unmet need for effective strategies targeting disease management.
Keywords: atopic dermatitis, burden of disease, patient‐reported outcomes, productivity, quality of life
Introduction
Atopic dermatitis (AD) is a chronic inflammatory skin disease characterized by xerosis, intense pruritus and eczematous lesions. Patients with AD experience a fluctuating course of flares and spontaneous apparent remission.1, 2 In most cases, AD presents in early infancy or childhood and often resolves by puberty. However, in approximately 50% of cases, it extends into adult life, evolving into a chronic lifelong condition.2, 3, 4 In addition, it is increasingly being recognized that AD can present for the first time in adults as adult‐onset AD.5, 6, 7
Atopic dermatitis is the most common inflammatory skin disease, with a 1‐year prevalence in US adults of 10.2%.8 By comparison, in Japanese adults, the point prevalence of AD (2004) was estimated at 6.9%,9 presenting in a mild form in 76.7% of patients, as moderate disease in 18.5% of cases and as severe or very severe disease in 4.8% of patients.9
Skin diseases are among the leading causes of non‐fatal disease burden worldwide, as demonstrated by the Global Burden of Diseases Study.10 Accordingly, characterizing the burden of disease in patients with AD is crucial in promoting evidence‐based allocation of health‐care resources and highlighting AD as a global health problem. The multidimensional burden of disease in North American and European AD patients is well documented. Relative to the general population, patients with AD experience increased levels of itch, pain, sleep disturbance, anxiety and depression, as well as an impaired health‐related quality of life (HRQoL).11, 12, 13, 14, 15 In contrast, published data on the burden of AD in the Japanese patient population is limited to two relatively small studies.16, 17
With this in mind, the objective of the present study was to perform a comprehensive characterization of the real‐world burden of AD in Japanese adult patients, encompassing comorbidities, mood and sleep disorders, HRQoL, work productivity, activity and health‐care resource utilization (HCRU), based on data from the 2013 National Health and Wellness Survey (NHWS).18 The study also aimed to evaluate the impact of patient‐rated AD severity on the burden of AD in Japanese adult patients.
Methods
Data source
Patient data were obtained from the 2013 Japan NHWS, an Internet‐based, international population survey conducted in Japan, the USA, China, Russia, Brazil and Europe.18 The Japanese NHWS uses a random, stratified sampling framework, including sex and age, to ensure that it is representative of the demographic composition of the Japanese adult population, based on data from the Japan population census.19 A total of 607 712 individuals were asked to complete the 2013 Japanese NHWS, of whom 41 893 responded (6.9%). Of the responders, 30 000 (71.6%) met the inclusion criteria (Japanese adults, age ≥18 years, who can read and write Japanese), completed the survey and gave informed consent for their anonymized data to be used for research purposes. The NHWS was approved by the Essex Institutional Review Board (Lebanon, NJ, USA).15
Analysis cohort
The AD cohort comprised adult respondents who indicated that they had experienced AD in response to the question: “Which of the following conditions have you experienced in the past 12 months?”. Possible response options were: select all that apply/I have not experienced any of the above conditions in the past 12 months/decline to answer. To be included in the analysis, respondents also had to answer “yes” to the NHWS question: “Has your AD been diagnosed by a physician?”. The non‐AD control cohort comprised adult respondents who did not report experiencing AD, dermatitis or eczema in the past 12 months. Adults with AD graded their disease severity as “mild”, “moderate” or “severe” in response to the NHWS question, “How severe is your dermatitis/eczema?”.
Propensity‐score matching
To correct for potential confounding, AD patients were propensity‐score matched20 to non‐AD controls in a 1:2 ratio. Matching of AD patients and non‐AD controls was based on the demographic variables age, sex, marital status, education, income, insurance status, body mass index, smoking status and the Charlson comorbidity index (CCI).21 The CCI is a weighted index that predicts the 1‐year mortality of patients based on the presence of a total of 19 comorbid conditions. In the NHWS, hemiplegia and moderate/severe liver disease are not included; thus, data is collected for 17 comorbid conditions. Each condition is assigned a score of 1, 2, 3 or 6, with higher scores indicating a higher risk of mortality. Scores are summed to provide an overall measure of comorbidity and risk of mortality. Variables were entered into a logistic regression model using the SAS/STAT® LOGISTIC procedure to generate the propensity score. Matching was completed using the “greedy matching” technique.22 The algorithm creates the “best” matches first and the “next‐best” matches next, in a hierarchical sequence, until no more matches can be made. Best matches are those with the highest digit match on propensity score. Matched pairs were defined as those with the lowest difference in propensity score.
Comorbidities
Self‐reported diagnoses of arthritis (including osteoarthritis, rheumatoid arthritis and psoriatic arthritis), atopic‐related comorbidities (asthma, hay fever/nasal allergies), diabetes, hypertension, high cholesterol and osteoporosis/osteopenia were based on respondents’ answers to the questions: “Which of the following conditions have you experienced in the past 12 months?” or “Which of the following conditions have you ever experienced”. In addition, respondents had to answer “yes” to the question, “Has your condition been diagnosed by a physician?”.
Mental health
Self‐reported diagnoses of anxiety, depression and/or sleep disorders were based on responses to the questions: “Have you experienced anxiety/depression/sleep disorder (separate question for each disorder) in the past 12 months?”. Additionally, respondents had to answer “yes” to the question, “Has your anxiety/depression/sleep disorder been diagnosed by a physician?” (separate question for each disorder).
Outcomes
Health‐related quality of life
Health‐related quality of life during the past 4 weeks was assessed with the Japanese version23 of the 36‐item Short Form Health Survey (SF‐36v2) Mental Component Summary (MCS) and Physical Component Summary (PCS) scores, normed to a mean of 50 (standard deviation [SD] of 10) based on the US population, with higher scores indicating better health.24, 25 In addition, the Short Form 6‐Dimension (SF‐6D) utility score was calculated, a preference‐based single index measure for health based on SF‐36 data, weighted according to general population values for health, with a hypothetical range of 0–1.0, where 1.0 indicates “full health”.26
Work productivity and activity impairment
The Japanese version16 of the work productivity and activity impairment questionnaire27 evaluated respondents in full‐time or part‐time employment across four domains: absenteeism (percentage of work time missed during the past 7 days due to the health problem); presenteeism (percentage of work time impaired due to the health problem during the past 7 days); overall work impairment (percentage of total work impairment due to the health problem [absenteeism + presenteeism]); and activity impairment (percentage of activity impairment due to the health problem).
Health‐care resource utilization
Health‐care resource utilization (HCRU) in the past 6 months was evaluated based on responses to the following survey questions: “How many visits did you make to the following traditional health‐care provider(s) (e.g. general/family practitioner, internist, cardiologist, allergist, dermatologist) in the past 6 months?”, “How many times have you been to the emergency room (ER) for your own medical condition in the past 6 months?” and “How many times have you been hospitalized for your own medical condition in the past 6 months?”.
Statistical methods
Bivariate analyses of variables were conducted for AD patients versus matched non‐AD controls, and moderate/severe AD versus mild AD groups. Pearson's χ2‐test or Student's t‐test were used to compare differences between groups for categorical or continuous variables, respectively. Analyses were performed using SAS version 9.3 (SAS Institute, Cary, NC, USA).
Results
Analysis cohort
The AD cohort contained 638 Japanese adult patients with AD, of whom 290 (45.45%) rated their disease as moderate/severe and 348 (54.54%) as mild (Table 1). Four AD patients could not be matched with non‐AD control subjects and were removed from the analysis. Therefore, a total of 1902 adults were included in the matched analysis cohort, comprising 634 AD patients and 1268 non‐AD controls (1:2 ratio). The mean (SD) age of the analysis cohort was 38.51 (12.92) years and approximately half were female (50.16%). Demographic characteristics were similar between AD patients and matched non‐AD controls (Table 1), confirming that propensity‐score matching had been effective in matching AD patients to non‐AD controls. Demographic characteristics were also generally similar between moderate/severe and mild AD patients, but some significant differences were identified. A significantly lower proportion of moderate/severe AD patients reported being married or living with a partner compared with mild AD patients (37.24% vs 49.14%, respectively; P = 0.003). Annual household income also tended to be lower among patients with moderate/severe AD, with 18.62% of these patients reporting an annual income of at least ¥8 million compared with 25.86% of mild AD patients (P = 0.024) (Table 1). In addition, a lower proportion of patients with moderate/severe AD reported smoking compared with mild AD patients (19.66% vs 23.56%; P = 0.016).
Table 1.
Demographic characteristics in the matched analysis cohort of AD patients and non‐AD controls and in AD patients according to self‐rated disease severity
| Total (n = 1902) | AD (n = 634)† | Non‐AD (n = 1268) | P | Moderate/severe AD (n = 290)† | Mild AD (n = 348)† | P | |
|---|---|---|---|---|---|---|---|
| Age, years, mean (SD) | 38.51 (12.92) | 38.67 (13.07) | 38.43 (12.85) | 0.695 | 37.53 (12.81) | 39.51 (13.21) | 0.056 |
| Female, n (%) | 954 (50.16) | 332 (52.37) | 622 (49.05) | 0.173 | 148 (51.03) | 186 (53.45) | 0.543 |
| Married/living with partner, n (%) | 833 (43.80) | 277 (43.69) | 556 (43.85) | 0.948 | 108 (37.24) | 171 (49.14) | 0.003 |
| College educated, n (%) | 1040 (54.68) | 338 (53.31) | 702 (55.36) | 0.397 | 146 (50.34) | 195 (56.03) | 0.151 |
| Annual household income ≥¥8 million, ‡ n (%) | 400 (21.03) | 140 (22.08) | 260 (20.50) | 0.929 | 54 (18.62) | 90 (25.86) | 0.024 |
| Employed full time, n (%) | 864 (45.43) | 279 (44.01) | 585 (46.14) | 0.379 | 127 (43.79) | 155 (44.54) | 0.850 |
| Student, n (%) | 132 (6.94) | 52 (8.20) | 80 (6.31) | 0.126 | 31 (10.69) | 22 (6.32) | 0.047 |
| Body mass index, mean (SD) | 21.84 (3.77) | 21.81 (3.69) | 21.86 (3.81) | 0.805 | 21.79 (4.11) | 21.83 (3.33) | 0.880 |
| Alcohol use, n (%) | 1286 (67.61) | 434 (68.45) | 852 (67.19) | 0.579 | 195 (67.24) | 243 (69.83) | 0.483 |
| Current smoker, n (%) | 427 (22.45) | 135 (21.29) | 292 (23.03) | 0.381 | 57 (19.66) | 82 (23.56) | 0.016 |
| Taking regular exercise, n (%) | 777 (40.85) | 274 (43.22) | 503 (39.67) | 0.138 | 120 (41.38) | 158 (45.40) | 0.308 |
| Charlson comorbidity index, mean (SD) | 0.17 (0.60) | 0.18 (0.59) | 0.16 (0.60) | 0.499 | 0.34 (2.80) | 0.34 (1.87) | 0.970 |
†Of the 638 AD patients who met the inclusion criteria, four were not able to be matched to non‐AD controls. As of July 2017, ¥8 million was equivalent to approximately $US70 000. AD, atopic dermatitis; SD, standard deviation.
Comorbidities
Significantly higher self‐reported prevalences of arthritis (3.79% vs 0.87%), asthma (12.62% vs 2.44%) and nasal allergies/hay fever (36.91% vs 14.83%) were observed in AD patients compared with matched non‐AD controls (all P < 0.001; Table 2). Additionally, the self‐reported prevalences of high cholesterol (8.99% vs 4.26%; P < 0.001) and osteoporosis/osteopenia (1.42% vs 0.47%; P < 0.028) were also significantly higher in AD patients compared with non‐AD controls. No statistically significant differences were reported for diabetes and hypertension. In addition, there were no significant differences in the self‐reported prevalence of any of the evaluated comorbidities between moderate/severe and mild AD patients (Table 2).
Table 2.
Self‐reported prevalence of comorbid conditions in AD patients versus matched non‐AD controls and moderate/severe versus mild AD patients
| Comorbidity, n (%) | AD (n = 634) | Non‐AD (n = 1268) | P | Moderate/severe AD (n = 290) | Mild AD (n = 348) | P |
|---|---|---|---|---|---|---|
| Diabetes | 17 (2.68) | 34 (2.68) | 1 | 8 (2.76) | 12 (3.45) | 0.619 |
| Hypertension | 47 (7.41) | 72 (5.68) | 0.141 | 18 (6.21) | 32 (9.20) | 0.162 |
| High cholesterol | 57 (8.99) | 54 (4.26) | <0.001 | 22 (7.59) | 38 (10.92) | 0.151 |
| Osteoporosis/osteopenia | 9 (1.42) | 6 (0.47) | 0.028 | 4 (1.38) | 9 (2.59) | 0.283 |
| Arthritis (osteoarthritis, rheumatoid, psoriatic) | 24 (3.79) | 11 (0.87) | <0.001 | 11 (3.79) | 17 (4.89) | 0.503 |
| Asthma | 80 (12.62) | 31 (2.44) | <0.001 | 34 (11.72) | 50 (14.37) | 0.325 |
| Nasal allergies/hay fever | 234 (36.91) | 188 (14.83) | <0.001 | 107 (36.90) | 131 (37.64) | 0.846 |
AD, atopic dermatitis.
Mood and sleep disorders
The self‐reported prevalences of depression (10.25% vs 4.26%), anxiety (3.31% vs 1.03%) and sleep disorders (12.93% vs 4.57%) were all significantly greater in AD patients compared with matched non‐AD controls (all P < 0.001; Fig. 1a). No significant differences were observed in the self‐reported prevalence of mood or sleep disorders between moderate/severe and mild AD patients (Fig. 1b).
Figure 1.
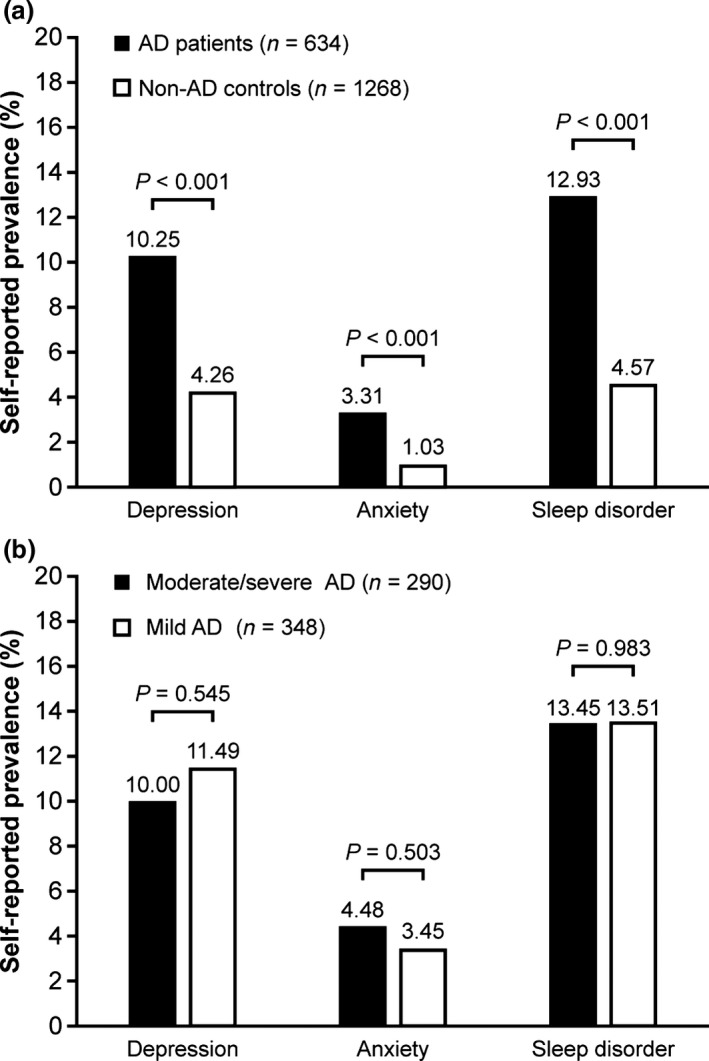
Self‐reported prevalence of mood and sleep disorders in (a) atopic dermatitis (AD) patients versus matched non‐AD controls and (b) moderate/severe versus mild AD patients.
Health‐related quality of life
Table 3 shows that AD patients reported significantly reduced HRQoL relative to matched non‐AD controls, with regards to both mental (SF‐36v2 MCS) and physical (SF‐36v2 PCS) domains, as well as overall health (SF‐6D utility). Mean MCS, PCS and SF‐6D scores were numerically lower for moderate/severe AD patients compared with mild AD patients; however, the differences did not reach statistical significance (Table 3).
Table 3.
Health‐related quality of life in AD patients versus matched non‐AD controls and moderate/severe versus mild AD patients
| Score, mean (SD) | AD (n = 634) | Non‐AD (n = 1268) | P | Moderate/severe AD (n = 290) | Mild AD (n = 348) | P |
|---|---|---|---|---|---|---|
| SF‐36 MCS | 42.29 (11.49) | 46.05 (9.92) | <0.001 | 41.42 (11.78) | 42.82 (11.31) | 0.127 |
| SF‐36 PCS | 52.04 (6.81) | 54.12 (6.07) | <0.001 | 51.66 (6.92) | 52.29 (6.75) | 0.246 |
| SF‐6D utility | 0.71 (0.13) | 0.76 (0.13) | <0.001 | 0.69 (0.13) | 0.71 (0.13) | 0.059 |
AD, atopic dermatitis; MCS, mental component summary, PCS, physical component summary; SF‐36, 36‐item Short Form Health Survey; SF‐6D, Short Form 6‐Dimension.
Work productivity and activity
Table 4 shows that employed AD patients reported significantly higher presenteeism than matched non‐AD controls (28.63% vs 22.37%; P < 0.001) but there was no statistically significant difference in absenteeism between the two groups. This translated into significantly higher overall work impairment in employed AD patients relative to employed non‐AD controls (30.61% vs 24.62%; P < 0.001). Activity was also significantly impaired in AD patients compared with non‐AD controls (32.18% vs 24.72%; P < 0.001). This data pattern was replicated in the analyses according to self‐rated disease severity. Patients with moderate/severe AD reported significantly higher presenteeism (32.17% vs 26.10%; P = 0.018), overall work impairment (33.79% vs 28.08%; P = 0.040) and activity impairment (35.14% vs 30.06%; P = 0.023) compared with patients with mild AD (Table 4).
Table 4.
Work productivity and activity impairment in AD patients versus matched non‐AD controls and moderate/severe versus mild AD patients
| Impairment in the last 7 days, mean (SD)a | AD (n = 634) | Non‐AD (n = 1268) | P | Moderate/severe AD (n = 290) | Mild AD (n = 348) | P |
|---|---|---|---|---|---|---|
| Absenteeism | 4.01 (12.32) | 3.54 (13.78) | 0.565 | 3.82 (10.39) | 4.33 (13.95) | 0.689 |
| Unemployed/missing data, n | 248 | 447 | 112 | 138 | ||
| Presenteeism | 28.63 (25.33) | 22.37 (24.91) | <0.001 | 32.17 (24.86) | 26.10 (25.92) | 0.018 |
| Unemployed/missing data, n | 239 | 427 | 110 | 130 | ||
| Overall work impairment | 30.61 (27.17) | 24.62 (27.16) | <0.001 | 33.79 (26.26) | 28.08 (28.00) | 0.040 |
| Unemployed/missing data, n | 248 | 447 | 112 | 138 | ||
| Activity impairment | 32.18 (27.93) | 24.72 (26.62) | <0.001 | 35.14 (27.58) | 30.06 (28.35) | 0.023 |
The percentage of time missed from work/daily activity. AD, atopic dermatitis; SD, standard deviation.
Health‐care resource utilization
As shown in Table 5, patients with AD reported significantly greater mean (SD) numbers of visits to a health‐care provider in the past 6 months compared with non‐AD controls (8.06 [16.90] vs 3.05 [6.27]; P < 0.001). Although ER visits also showed a significant difference (0.26 [1.86] vs 0.07 [0.53]; P < 0.001), the overall number of ER visits was very low, suggesting that Japanese AD patients do not usually visit the ER. There were no significant differences in HCRU between moderate/severe and mild AD patients (Table 5).
Table 5.
Health‐care resource utilization in AD patients versus matched non‐AD controls and moderate/severe versus mild AD patients
| HCRU in the past 6 months, mean (SD) | AD (n = 634) | Non‐AD (n = 1268) | P | Moderate/severe AD (n = 290) | Mild AD (n = 348) | P |
|---|---|---|---|---|---|---|
| Health‐care provider visits | 8.06 (16.90) | 3.05 (6.27) | <0.001 | 10.08 (25.97) | 8.06 (20.81) | 0.275 |
| Hospitalizations | 0.59 (3.42) | 0.39 (4.20) | 0.313 | 0.57 (3.10) | 0.72 (4.00) | 0.611 |
| Emergency room visits | 0.26 (1.86) | 0.07 (0.53) | <0.001 | 0.24 (1.47) | 0.33 (2.23) | 0.588 |
AD, atopic dermatitis; HCRU, health‐care resource utilization; SD, standard deviation.
Discussion
In this population‐based survey study, we sought to provide a comprehensive evaluation of the patient‐reported burden of AD in the Japanese adult population. Japanese adult patients with AD reported a higher prevalence of arthritis, as well as the atopic comorbidities asthma and nasal allergies/hay fever relative to matched non‐AD controls. The association between AD and other atopic conditions has been recognized in previous studies,6, 28, 29 and is consistent with the concept of the “atopic march”, which postulates that AD predicts the development of other common allergic conditions.30
Rates of self‐reported depression, anxiety and sleep disorders were also significantly higher in patients with AD relative to non‐AD controls, corroborating the psychological impact of AD observed in previous studies of European11 and Japanese17 AD patients. It is to be noted that these comorbidities may be in addition to other comorbidities of AD which have been recently identified. For example, a German retrospective cohort study demonstrated that patients with AD were at increased risk for incident rheumatoid arthritis (risk ratio, 1.72; 95% confidence interval [CI], 1.25–2.37) with no disproportionate occurrence of known genetic risk alleles.31 A similar observation was reported in a study conducted in Taiwan, with a significant association between rheumatoid arthritis and atopy (hazard ratio, 1.74; 95% CI, 1.31–2.33).32 These results suggest that the link between AD and rheumatoid arthritis appears in different races. The present Japanese data also suggest a similar trend; however, owing to the limited numbers of participants, further investigations are warranted to establish and explain the mechanism underlying the observed correlations.33 A Taiwanese cohort study also demonstrated a link between AD and osteoporosis, compared with a non‐AD cohort.34 We believe the present background‐matched study may add another line of evidence of particular comorbidities in patients with AD.
Atopic dermatitis patients also reported significantly reduced HRQoL relative to non‐AD controls, with regards to both mental (MCS) and physical (PCS) domains and overall utility score. The mean MCS score in AD patients (42.29) was substantially less than the norm of 50, consistent with the self‐reported prevalence of depression, anxiety and sleep disorders in AD patients. A salient question is whether the observed differences in MCS and PCS scores between AD patients and controls are clinically meaningful. Previous studies of several chronic health conditions have cited SF‐36 score changes of 3–5 points as clinically meaningful,35, 36, 37, 38, 39 suggesting that the 4‐point reduction in mean MCS score between the AD and control groups observed in the current study is clinically significant. However, it should be noted that the minimal clinically important difference for MCS and PCS have yet to be defined for AD. Nevertheless, the self‐reported psychological burden of AD combined with the impact on HRQoL demonstrated in this study suggest the need for improved management of AD in order to improve the general well‐being and quality of life of patients with AD.40, 41
In line with previous studies of Japanese patients with AD,16, 37 both work productivity and activity were negatively affected by AD. Overall, Japanese workers with AD reported 30.61% work impairment, very similar to the 30% figure reported in the US NHWS AD study.15 Of interest, employed Japanese AD patients reported significantly higher presenteeism, but not absenteeism, compared with employed non‐AD controls. This is an important finding as it has been estimated that the cost of presenteeism to the US economy is 10‐times higher than that of absenteeism, amounting to $US1500 billion per year.42 In contrast, in the US NHWS study, both presenteeism and absenteeism were significantly greater in AD patients than in non‐AD controls.15 The contrasting work productivity data in the two NHWS studies may reflect cultural differences in attitudes towards absence from work in Japan and the USA.
In accordance with the high comorbidity and psychological burden associated with AD, HCRU was significantly higher in patients with AD compared with non‐AD controls. Similar findings were seen in the US NHWS study, where units of resource use, including health‐care practitioner, ER and hospital visits, were also significantly higher for patients with AD relative to non‐AD controls.15 In the current study, health‐care provider visits were the main driver behind the increased HCRU in patients with AD.
Self‐rated disease severity did not demonstrate a consistent association with the burden of AD, in that patients who rated their disease as moderate/severe reported similar levels of comorbidities, HRQoL impairment and HCRU as those with mild AD. However, work productivity and activity was associated with self‐rated disease severity. Moderate/severe AD patients reported significantly higher presenteeism, overall work impairment and activity impairment relative to mild AD patients. The non‐significant differences between severity levels in this study were likely due to lack of adequate power on account of small sample size. In addition, approximately 11% of the patients in the “moderate or severe” group self‐reported their disease as “severe”; thus, the burden reported for these patients reflects outcomes for patients with moderate AD much more so than for patients with severe disease. Also, there is poor concordance between self‐rated (subjective) disease severity and clinical (objective) disease severity among AD patients, which might have obscured the putative association between disease severity and burden. In support of this hypothesis, we note that the self‐rated severity distribution reported here (moderate/severe, 45.54%; mild, 54.45%) is somewhat different from that based on clinical examination of Japanese adult AD patients (23.3% and 76.7%, respectively).9 It is evident that further studies are required to determine the extent of the concordance (or lack thereof) between patient‐rated and physician‐rated AD severity in the real‐world clinical setting.
A particular strength of this study is that the NHWS is representative of the demographic composition of the indigenous adult population, and thus the results presented here are likely to be applicable to the wider population of Japanese AD adult patients. Adding to this, propensity‐score matching of AD patients and non‐AD controls was carried out in an effort to minimize confounding due to demographic characteristics. However, the study is limited by the fact that it evaluates patient‐reported data which are subjective and, as such, are susceptible to recall error,43 given that NHWS data is not independently verified against clinical records. In addition, NHWS also does not include data on key AD‐specific outcome measures, such as itch and pain. A further limitation is that the HCRU data could not be conclusively attributed to AD, because claims specifically linking resource use with these conditions are not captured by the NHWS database.
In conclusion, the results of this population‐based survey study demonstrate the substantial burden experienced by Japanese adults with AD, suggesting an unmet need for effective strategies targeting AD disease prevention and treatment. The inconsistent association of self‐rated disease severity with the burden of disease suggests a need for studies that evaluate the concordance between patient‐rated and physician‐rated AD severity in the real‐world clinical setting.
Conflict of Interest
K. A., S. D. and L E. are employees of and stockholders in Sanofi. A. G. is an employee of and stockholder in Regeneron Pharmaceuticals, Inc. S. G. is an employee of Kantar Health which received research funding from Sanofi/Regeneron Pharmaceuticals, Inc. for the current study. T. H., T. K. and I. K. have nothing to disclose in relation to this study.
Acknowledgments
The authors would like to thank the NHWS respondents and all investigators involved in this study. Medical writing support, including developing outline and first drafts and incorporation of author/reviewer comments, was provided by Fernando Gibson, Ph.D., and Elien Moës, Ph.D., of Prime, London, UK. Editorial support, including formatting and manuscript submission, was provided by Sinead Stewart, of Prime Global, Knutsford, UK. Medical writing and editorial support was funded by Sanofi/Regeneron Pharmaceuticals according to Good Publication Practice guidelines (Ann Intern Med, http://annals.org/article.aspx?articleid=2424869). The authors were responsible for all content and editorial decisions, and received no honoraria related to the development of this publication.
References
- 1. Weidinger S, Novak N. Atopic dermatitis. Lancet 2016; 387: 1109–1122. [DOI] [PubMed] [Google Scholar]
- 2. Bieber T. Atopic dermatitis. N Engl J Med 2008; 358: 1483–1494. [DOI] [PubMed] [Google Scholar]
- 3. Gittler JK, Shemer A, Suarez‐Farinas M et al Progressive activation of T(H)2/T(H)22 cytokines and selective epidermal proteins characterizes acute and chronic atopic dermatitis. J Allergy Clin Immunol 2012; 130: 1344–1354. [DOI] [PMC free article] [PubMed] [Google Scholar]
- 4. Margolis JS, Abuabara K, Bilker W, Hoffstad O, Margolis DJ. Persistence of mild to moderate atopic dermatitis. JAMA Dermatol 2014; 150: 593–600. [DOI] [PMC free article] [PubMed] [Google Scholar]
- 5. Bannister MJ, Freeman S. Adult‐onset atopic dermatitis. Australas J Dermatol 2000; 41: 225–228. [DOI] [PubMed] [Google Scholar]
- 6. Leung DY, Guttman‐Yassky E. Deciphering the complexities of atopic dermatitis: shifting paradigms in treatment approaches. J Allergy Clin Immunol 2014; 134: 769–779. [DOI] [PMC free article] [PubMed] [Google Scholar]
- 7. Ozkaya E. Adult‐onset atopic dermatitis. J Am Acad Dermatol 2005; 52: 579–582. [DOI] [PubMed] [Google Scholar]
- 8. Silverberg JI, Hanifin JM. Adult eczema prevalence and associations with asthma and other health and demographic factors: a US population‐based study. J Allergy Clin Immunol 2013; 132: 1132–1138. [DOI] [PubMed] [Google Scholar]
- 9. Saeki H, Tsunemi Y, Fujita H et al Prevalence of atopic dermatitis determined by clinical examination in Japanese adults. J Dermatol 2006; 33: 817–819. [DOI] [PubMed] [Google Scholar]
- 10. Hay RJ, Johns NE, Williams HC et al The global burden of skin disease in 2010: an analysis of the prevalence and impact of skin conditions. J Invest Dermatol 2014; 134: 1527–1534. [DOI] [PubMed] [Google Scholar]
- 11. Dalgard FJ, Gieler U, Tomas‐Aragones L et al The psychological burden of skin diseases: a cross‐sectional multicenter study among dermatological out‐patients in 13 European countries. J Invest Dermatol 2015; 135: 984–991. [DOI] [PMC free article] [PubMed] [Google Scholar]
- 12. Drucker AM, Wang AR, Li WQ, Sevetson E, Block JK, Qureshi AA. The burden of atopic dermatitis: summary of a report for the National Eczema Association. J Invest Dermatol 2017; 137: 26–30. [DOI] [PubMed] [Google Scholar]
- 13. Kiebert G, Sorensen SV, Revicki D et al Atopic dermatitis is associated with a decrement in health‐related quality of life. Int J Dermatol 2002; 41: 151–158. [DOI] [PubMed] [Google Scholar]
- 14. Simpson EL, Bieber T, Eckert L et al Patient burden of moderate to severe atopic dermatitis (AD): insights from a phase 2b clinical trial of dupilumab in adults. J Am Acad Dermatol 2016; 74: 491–498. [DOI] [PubMed] [Google Scholar]
- 15. Whiteley J, Emir B, Seitzman R, Makinson G. The burden of atopic dermatitis in US adults: results from the 2013 National Health and Wellness Survey. Curr Med Res Opin 2016; 32: 1645–1651. [DOI] [PubMed] [Google Scholar]
- 16. Yano C, Saeki H, Ishiji T et al Impact of disease severity on work productivity and activity impairment in Japanese patients with atopic dermatitis. J Dermatol 2013; 40: 736–739. [DOI] [PubMed] [Google Scholar]
- 17. Yano C, Saeki H, Ishiji T et al Impact of disease severity on sleep quality in Japanese patients with atopic dermatitis. J Dermatol Sci 2013; 72: 195–197. [DOI] [PubMed] [Google Scholar]
- 18. Kantar Health . The National Health and Wellness Survey 2014. Available from URL: http://www.kantarhealth.com/docs/ebooks/global-health-and-wellness-report.pdf [Accessed 12 May, 2017]
- 19. International Database of the U.S. Census Bureau and Organization for Economic Cooperation and Development. Available from URL: http://www.census.gov/population/international/data/idb [Accessed 23 December, 2016]
- 20. Austin PC. A critical appraisal of propensity‐score matching in the medical literature between 1996 and 2003. Stat Med 2008; 27: 2037–2049. [DOI] [PubMed] [Google Scholar]
- 21. Charlson ME, Pompei P, Ales KL, MacKenzie CR. A new method of classifying prognostic comorbidity in longitudinal studies: development and validation. J Chronic Dis 1987; 40: 373–383. [DOI] [PubMed] [Google Scholar]
- 22. Austin PC. A comparison of 12 algorithms for matching on the propensity score. Stat Med 2014; 33: 1057–1069. [DOI] [PMC free article] [PubMed] [Google Scholar]
- 23. Fukuhara S, Bito S, Green J, Hsiao A, Kurokawa K. Translation, adaptation, and validation of the SF‐36 Health Survey for use in Japan. J Clin Epidemiol 1998; 51: 1037–1044. [DOI] [PubMed] [Google Scholar]
- 24. Ware JE Jr. SF‐36 health survey update. Spine 2000; 25: 3130–3139. [DOI] [PubMed] [Google Scholar]
- 25. Ware JE, Kosinski M, Bjorner JB, Turner‐Bowker DM, Gandek B, Maruish ME. User's manual for the SF‐36v2 Health Survey, 2nd edn Lincoln, RI, USA: QualityMetric Incorporated, 2007. [Google Scholar]
- 26. Brazier J, Roberts J, Deverill M. The estimation of a preference‐based measure of health from the SF‐36. J Health Econ 2002; 21: 271–292. [DOI] [PubMed] [Google Scholar]
- 27. Reilly MC, Zbrozek AS, Dukes EM. The validity and reproducibility of a work productivity and activity impairment instrument. Pharmacoeconomics 1993; 4: 353–365. [DOI] [PubMed] [Google Scholar]
- 28. Boguniewicz M, Leung DY. Atopic dermatitis: a disease of altered skin barrier and immune dysregulation. Immunol Rev 2011; 242: 233–246. [DOI] [PMC free article] [PubMed] [Google Scholar]
- 29. Illi S, von Mutius E, Lau S et al The natural course of atopic dermatitis from birth to age 7 years and the association with asthma. J Allergy Clin Immunol 2004; 113: 925–931. [DOI] [PubMed] [Google Scholar]
- 30. Shaker M. New insights into the allergic march. Curr Opin Pediatr 2014; 26: 516–520. [DOI] [PubMed] [Google Scholar]
- 31. Schmitt J, Schwarz K, Baurecht H et al Atopic dermatitis is associated with an increased risk for rheumatoid arthritis and inflammatory bowel disease, and a decreased risk for type 1 diabetes. J Allergy Clin Immunol 2016; 137: 130–136. [DOI] [PubMed] [Google Scholar]
- 32. Hou YC, Hu HY, Liu IL, Chang YT, Wu CY. The risk of autoimmune connective tissue diseases in patients with atopy: a nationwide population‐based cohort study. Allergy Asthma Proc 2017; 38: 383–389. [DOI] [PubMed] [Google Scholar]
- 33. Cipriani F, Marzatico A, Ricci G. Autoimmune diseases involving skin and intestinal mucosa are more frequent in adolescents and young adults suffering from atopic dermatitis. J Dermatol 2017; 44: 1341–1348. [DOI] [PubMed] [Google Scholar]
- 34. Wu CY, Lu YY, Lu CC, Su YF, Tsai TH, Wu CH. Osteoporosis in adult patients with atopic dermatitis: a nationwide population‐based study. PLoS ONE 2017; 12: e0171667. [DOI] [PMC free article] [PubMed] [Google Scholar]
- 35. Angst F, Aeschlimann A, Stucki G. Smallest detectable and minimal clinically important differences of rehabilitation intervention with their implications for required sample sizes using WOMAC and SF‐36 quality of life measurement instruments in patients with osteoarthritis of the lower extremities. Arthritis Rheum 2001; 45: 384–391. [DOI] [PubMed] [Google Scholar]
- 36. Hays RD, Morales LS. The RAND‐36 measure of health‐related quality of life. Ann Med 2001; 33: 350–357. [DOI] [PubMed] [Google Scholar]
- 37. Lubeck DP. Patient‐reported outcomes and their role in the assessment of rheumatoid arthritis. Pharmacoeconomics 2004; 22: 27–38. [DOI] [PubMed] [Google Scholar]
- 38. Jaeschke R, Singer J, Guyatt GH. Measurement of health status. Ascertaining the minimal clinically important difference. Control Clin Trials 1989; 10: 407–415. [DOI] [PubMed] [Google Scholar]
- 39. Stewart AL, Greenfield S, Hays RD et al Functional status and well‐being of patients with chronic conditions. Results from the Medical Outcomes Study. JAMA 1989; 262: 907–913. [PubMed] [Google Scholar]
- 40. Drucker AM, Wang AR, Qureshi AA. Research gaps in quality of life and economic burden of atopic dermatitis: the National Eczema Association burden of disease audit. JAMA Dermatol 2016; 152: 873–874. [DOI] [PubMed] [Google Scholar]
- 41. Lifschitz C. The impact of atopic dermatitis on quality of life. Ann Nutr Metab 2015; 66(Suppl 1): 34–40. [DOI] [PubMed] [Google Scholar]
- 42. EHS Today . Presenteeism Costs Business 10 Times More than Absenteeism. Available from URL: http://ehstoday.com/safety-leadership/presenteeism-costs-business-10-times-more-absenteeism [Accessed 16 January, 2017].
- 43. Brusco NK, Watts JJ. Empirical evidence of recall bias for primary health care visits. BMC Health Serv Res 2015; 15: 381. [DOI] [PMC free article] [PubMed] [Google Scholar]