

Abstract
The knowledge of structure and dynamics is crucial to explain the function of RNAs. While nuclear magnetic resonance (NMR) is well suited to probe these for complex biomolecules, it requires expensive, isotopically labeled samples, and long measurement times. Here we present SELOPE, a new robust, proton‐only NMR method that allows us to obtain site‐specific overview of structure and dynamics in an entire RNA molecule using an unlabeled sample. SELOPE simplifies assignment and allows for cost‐effective screening of the response of nucleic acids to physiological changes (e.g. ion concentration) or screening of drugs in a high throughput fashion. This single technique allows us to probe an unprecedented range of exchange time scales (the whole μs to ms motion range) with increased sensitivity, surpassing all current experiments to detect chemical exchange. For the first time we could describe an RNA excited state using an unlabeled RNA.
Keywords: biomolecular dynamics, NMR spectroscopy, relaxation dispersion, RNA, unlabeled
RNAs are flexible molecules that adopt different structures each correlated with a different function.1 The interest in studying RNA structure and dynamics has increased due to the discovery of new roles, for systems such as the ribosome, ribozymes, riboswitches, RNA viruses, and a wide variety of regulatory RNAs. These RNAs affect many biological processes and are involved in various human diseases such as cardiac diseases, Alzheimer's, diabetes or cancer, making them prime drug targets and candidates for molecular diagnostics.2 To understand the function of RNA it is essential to obtain high‐resolution structural information on the highly populated ground state (GS) but also on the lower‐populated, shorter‐lived states, and therefore on the RNA dynamics. Currently, nuclear magnetic resonance (NMR) is the method of choice to obtain this information, despite the requirement of expensive isotopic labeling (15N, 13C).3 RNA 1H chemical shift is a reliable and accurate structural probe4 and recently dynamics of protons, in a range of time scales (relaxation dispersion (RD),5 CEST,6 real‐time NMR7) have been exploited for proteins and nucleic acids. While the most abundant isotope of hydrogen, 1H, is NMR active, highly sensitive and therefore easily detected, labeled heteronuclei are usually necessary for selective excitation or to introduce a second spectral dimension to decrease signal overlap in 1H 1D spectra (Figure 1).
Figure 1.
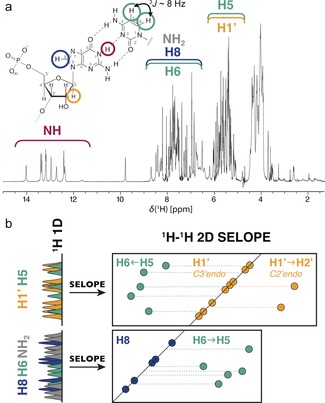
a) Example RNA (G‐C base pair) and a 1D 1H NMR spectrum of a 25 nucleotide RNA (Figure 3 a). Chemical shift regions of different 1H types are indicated. b) A simplified Scheme of the de‐crowded spectra obtained with the 2D SELOPE approach.
In this work we present a new homonuclear 2D NMR method, the SELective Optimized Proton Experiment (SELOPE). It allows us to obtain well‐resolved 1H 1D and 2D spectra of unlabeled RNA by combining two simple key elements: (1) the selective excitation of specific groups of protons and (2) spectral editing and de‐crowding using a coherence transfer through homonuclear J‐couplings. This idea is shown in the Scheme in Figure 1 b. Similar to other J‐correlation elements, SELOPE can be combined with other pulse sequence blocks, for example, spin locks (SL), to record dynamics on unlabeled samples on timescales covering the complete μs to ms timescale.
Figure 2 (a), shows the SELOPE pulse sequence, that is used to edit the 1H−1H 2D spectrum. Panels (b) and (c) show the H8 and H6/H5 regions of the 2D spectrum of a 25‐nucleotide unlabeled RNA construct, henceforth called “GUG” (secondary structure displayed in Figure 3 b). Using SELOPE one can probe the nucleobases adenine (A) and guanine (G) through H8 and H2, cytidine (C) and uracil (U) through H5 and H6, as well as the sugar moiety through H1′, covering the whole RNA molecule without the need for labeling. After selective excitation of the H8/H6 region (Figure 1) we introduce a coherence transfer element to transfer the selected, transverse magnetization from H6 to H5 in order to introduce a second dimension. H8 has no coupling partner hence its magnetization remains on H8. This leads to well‐resolved 2D spectra with H6−H5 cross peaks (Figure 2 c) while the crowded aromatic region is now depleted and the signals along the diagonal are due only to H8 (Figure 2 b), reducing overlap for every nucleotide in the whole unlabeled RNA sample. The depletion and editing effect is achieved due to the uniformity of H5−H6 J‐couplings (8–10 Hz) throughout the RNA molecule paired with careful selection of the duration τ (=1/(4J)) in the presented pulse sequence. The J‐transfer element also acts as a T 2‐filter and hence in addition rids the H8 region from overlapping NH2 peaks. This depletion of the diagonal is not exploited when using standard homonuclear 1H−1H 2D experiments, or, such as for 2QF‐COSY experiments, cannot be achieved. The depletion/ SELOPE idea can be realized using even shorter transfer times, albeit not as well due to residual NH2 peaks, using a 1H‐1H TOCSY transfer sequence instead of the 90–τ–180–τ–90–τ–180–τ transfer (Supporting Information section 5). The H5/H1′ region (Figure 1) can be edited in a similar fashion. In this case the magnetization is fully transferred from H5 to H6, while for H1′ it either remains along the diagonal, or is otherwise transferred to H2′, depending on the sugar pucker conformation (Supporting Information Figures S02, S03 for spectra and more detailed discussion). Whilst the experiment is presented as a 2D Scheme here, the resolution obtained may also be sufficient for use as a 1D Scheme, that is, retaining transfer but omitting t 1, especially for the depleted excitation region—the diagonal (Figure 2 b 1D projection). The cross peak region shows more overlap due to the homonuclear H5−H6 J‐coupling. However, H5−H6 coupling constants are uniform throughout the RNA molecule, therefore in future, S3E or IPAP type schemes could be used similar to 13C detected protein NMR,8 to virtually decouple this region and thereby further reduce overlap to allow acquisition as 1D as well. The SELOPE idea was tested on different unlabeled RNA and DNA samples of different concentrations, as well as a protein sample. The results are summed up in the Supporting Information (sections 1.5 and 4.1). Although this pulse sequence was developed for unlabeled samples, it can be applied to 13C/15N labeled RNA constructs, however, decoupling has to be applied during the transfer delays τ and acquisition (Supporting Information 1.5).
Figure 2.
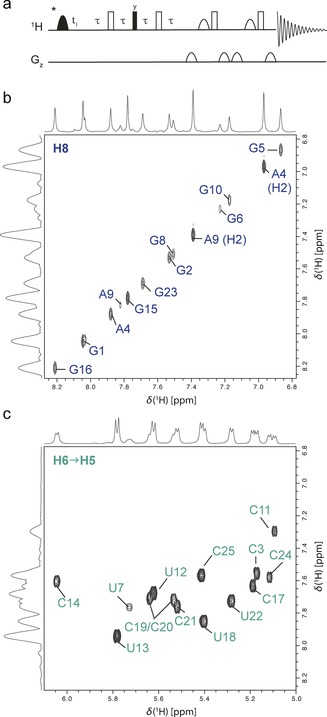
(a) 2D SELOPE pulse sequence. Filled and open rectangles correspond to 90° and 180° hard pulses, respectively. Filled semi‐oval shapes indicate 90° shape pulses for selective excitation of the H8/H6 or H5/H1′ region of the proton spectrum. The coherence transfer delay τ is set to 1/ (4 3 J HH). The asterisk indicates a possible point in the sequence where an element to diversify the sequence can be implemented (e.g. spin lock element). (b and c) Expansions of one SELOPE spectrum of GUG obtained through selective excitation of the H8/H6 region and subsequent coherence transfer from H6 to H5. For this spectrum 44 FIDs were recorded for an indirect dimension of 1.8 ppm spectral width. 16 scans were recorded per increment with a recovery delay of 1.5 s leading to an experimental time of 27 min. For more detailed description and experimental parameters see Supporting Information (sections 1.1–1.3).
Figure 3.
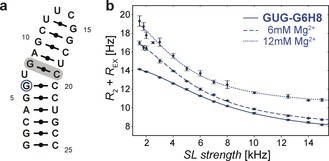
Secondary structure of GUG construct (a) and (b) on‐resonance 1H R 1ρ RD curve for G6H8 including fits to a two‐state fast‐exchange model obtained for the pure GUG RNA (solid line) and titrated with MgCl2 (6 mm, and 12 mm Mg2+, dashed and dotted lines, respectively).
To show the potential of the new method, we combined the SELOPE element with a SL (inserted at the * in Figure 2) to measure 1H R 1ρ RD and therefore obtain site‐specific structural information of possible excited states (ES) of the unlabeled RNA (see Supporting Information 2.1 for modified pulse sequence). To our knowledge, 1H relaxation dispersion without using heteronuclei has so far only been carried out to study small molecules9 or small molecules in ligand‐biomolecule complexes,10 in which it is possible to obtain information using standard 1D 1H spectra. As a consequence of the highly resolved two‐dimensional proton spectra obtained through SELOPE, it was possible to obtain RD curves for every single residue in the GUG RNA construct (Figure 3 a). A representative dispersion curve (G6H8) including a fit obtained using a two‐state fast exchange model is shown in Figure 3 b and Table 1. Recording the data as 2D spectra allows us to extract dispersion curves for H6 and H8 of all residues at once saving time, as shown in the Supporting Information (Figures S11, S12). As has been shown in our previous work for labeled samples, 1H R 1ρ RD experiments extend accessible timescales towards faster exchange processes,5e allowing us to measure very fast exchange rates of more than 50 kHz (Table 1). The new experiment complements the previous 1H R 1ρ method for labeled samples5e because of the different signal dispersion due to the different nuclei sampled in the indirect dimension (proton vs. carbon) and the additional depletion effect in the proton spectrum, leading to resolved peaks of interest in the new 1H−1H 2D experiment, which may overlap in the 1H−13C 2D and vice versa (See Supporting Information section 1.5 for an example).
Table 1.
Exchange rates, k EX, obtained for different Mg2+ concentrations for selected residues in GUG.
| [Mg2+] | k EX (U7H6) | k EX (G6H8) | k EX (G6NH) |
|---|---|---|---|
| 0 mm | 52.5±3.9 kHz | 44.1±1.1 kHz | 48.2±0.5 kHz |
| 6 mm | 42.0±3.7 kHz | 32.8±0.9 kHz | 36.0±1.1 kHz |
| 12 mm | 36.8±4.5 kHz | 26.9±1.9 kHz | 31.8±1.3 Hz |
Furthermore, SELOPE is well suited for monitoring the response of the system to environmental changes. We titrated GUG RNA with MgCl2 and measured 1H chemical shift perturbations (Figures S17–S19) and dynamics using the SELOPE method. Figure 3 b, Figure S16 and Table 1 show the results of the RD measurement for residues in the bulge region, in which a shift towards slower exchange rates was observed.
Our method opens the door to using unlabeled RNA samples for drug screening. It has been shown that the efficacy of drugs cannot only be explained by the structural changes they cause, but also need an understanding of changes in the RNA dynamics.1a, 1d As proof of concept we added an aminoglycoside, Neomycin, to the GUG RNA. RD curves for selected residues are shown in the Supporting Information (Figure S20). Hence potential problems with stability of a labeled (i.e. expensive) sample and its retrieval from the mixture are neatly circumvented.
While previous 1H R1ρ sequences for labeled samples are limited when measuring slower exchange rates, due to large heteronuclear J‐couplings in combination with low SL RF field strengths, another novelty and advantage of our method is that these couplings are absent in unlabeled samples, thus allowing us to use lower SL strengths and therefore measure slower exchange time scales (Figure 4). See Supporting Information section 2.6 for comparison of R 1ρ data obtained from a labeled and unlabeled RNA construct. In addition, 1Hs bound to 12C have reduced R 2 values,5e increasing the sensitivity to smaller R EX contributions. To demonstrate this feasibility, we obtained on and off‐resonance RD curves (Figure 4 b and c) for another RNA construct called “GUC” (Figure 4 a). RD data was fitted by solving the Bloch‐McConnell equations for two‐state chemical exchange11 for G6H8. Using very low SL strengths (25 Hz) we characterized an exchange process with a k EX of 263±30 Hz, a population of 0.40±0.03 % for the excited state and a chemical shift change ΔωH of −0.19±0.01 ppm, not detectable by current CEST methods. For completeness, SI section S3 shows the combined SELOPE approach with a CEST element (pulse sequence and experimental details) applied to the GUC sample. Additional RD curves, experimental details and instructions to acquire off‐resonance data can be found in Supporting Information section 2.4 and 2.5.
Figure 4.
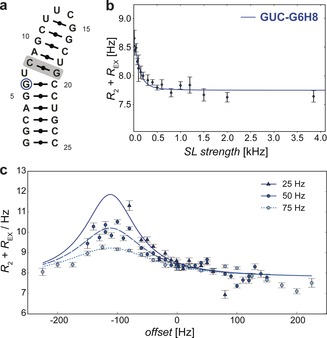
(a) Secondary structure of GUC construct (differing base pair compared to GUG (Figure 3 a) is highlighted in grey) and (b) on‐resonance 1H R 1ρ RD data for G6H8 (indicated in (a)). (c) Off‐resonance 1H R 1ρ RD curves obtained at 25 (dark blue), 50 (blue) and 75 Hz (light blue). Lines correspond to fits obtained by solving the Bloch‐McConnell equations for a two‐state chemical exchange.11
As with all 1H R 1ρ pulse sequences, there is a potential for artifacts arising from interfering mechanisms during 1H SL: Hartmann–Hahn transfers, cross‐relaxation, heating or off‐resonance effects. These have either been discussed earlier (for fast exchange regime)5e or are addressed in the Supporting Information section 2.7.
In this work we presented SELOPE, a new NMR approach for unlabeled RNAs, enabling us to obtain structural information, that is, chemical shifts, from a set of well‐resolved 1D and 2D proton spectra. The method can be combined with different pulse sequence elements to measure dynamics such as RD and CEST. We have shown that combined with a SL, it can be used to obtain 1H R 1ρ RD data throughout a whole RNA′s nucleobases (H8, H6 & H5) and sugar moieties (H1′). Provided that potential artifacts are identified or excluded, it permits off‐resonance measurements to extract chemical shifts and population of excited states. The SELOPE approach was designed for standard (<40 nt) RNA constructs but is also readily applicable to DNA samples (Supporting Information section S4). The method is suitable for unlabeled samples and hence a cost‐effective way to gain an overview of biomolecular systems and their response to physiological changes or drug screening. In addition the new experiment complements R 1ρ measurements on heteronuclei due to the characteristic of the 1H to extend accessible timescales towards both faster and slower exchange processes, thereby closing the gap in time scales typically arising between CEST and R 1ρ methods for RNAs.12 The recently proposed 15N E‐CPMG experiment13 closes this gap in isotopically labeled proteins and enables to characterize exchange processes between 500 and 40 000 Hz. Unfortunately, 15N CPMG experiments are only applicable for labeled nucleic acids and deliver very few, Watson–Crick base paired probes. The herein presented SELOPE method goes even further and extends the accessible time scale on both ends, from 100 to 50 000 Hz, using one single experiment without the necessity of any type of isotopic labeling. We expect the presented approach to be widely useful to obtain comprehensive, financially inexpensive, and stand‐alone or complementary information for the study of structure and dynamics in RNAs.
Conflict of interest
The authors declare no conflict of interest.
Supporting information
As a service to our authors and readers, this journal provides supporting information supplied by the authors. Such materials are peer reviewed and may be re‐organized for online delivery, but are not copy‐edited or typeset. Technical support issues arising from supporting information (other than missing files) should be addressed to the authors.
Supplementary
Acknowledgements
We thank Luca Retattino, Lorenzo Baronti and Maja Marušič for sample preparation, and Lorenzo Baronti, Maja Marušič and Patrik Lundström (Linköping University) for interesting discussions. We acknowledge the Karolinska Institute and the Dept. of Medical Biochemistry and Biophysics for the support of the purchase of a 600 MHz spectrometer. We are grateful for financial contribution from Vetenskapsrådet (#2014‐4303), Stiftelsen för strategisk Forskning (ICA14‐0023) and The Ragnar Söderberg Stiftelse (M91‐14), E.S was supported by The Tryggers Foundation (CTS14‐383).
J. Schlagnitweit, E. Steiner, H. Karlsson, K. Petzold, Chem. Eur. J. 2018, 24, 6067.
References
- 1.
- 1a. Duchardt-Ferner E., Gottstein-Schmidtke S. R., Weigand J. E., Ohlenschläger O., Wurm J.-P., Hammann C., Suess B., Wöhnert J., Angew. Chem. Int. Ed. 2016, 55, 1527; [DOI] [PubMed] [Google Scholar]; Angew. Chem. 2016, 128, 1551; [Google Scholar]
- 1b. Dethoff E. A., Chugh J., Mustoe A. M., Al-Hashimi H. M., Nature 2012, 482, 322; [DOI] [PMC free article] [PubMed] [Google Scholar]
- 1c. Helmling C., Wacker A., Wolfinger M. T., Hofacker I. L., Hengesbach M., Fürtig B., Schwalbe H., J. Am. Chem. Soc. 2017, 139, 2647; [DOI] [PubMed] [Google Scholar]
- 1d. Zhao B., Guffy S. L., Williams B., Zhang Q., Nat. Chem. Biol. 2017, 486, 85. [DOI] [PMC free article] [PubMed] [Google Scholar]
- 2.
- 2a. Rupaimoole R., Slack F. J., Nat. Rev. Drug Discovery 2017, 16, 203; [DOI] [PubMed] [Google Scholar]
- 2b. Matsui M., Corey D. R., Nat. Rev. Drug Discovery 2017, 16, 167. [DOI] [PMC free article] [PubMed] [Google Scholar]
- 3.
- 3a. Rinnenthal J., Buck J., Ferner J., Wacker A., Fürtig B., Schwalbe H., Acc. Chem. Res. 2011, 44, 1292; [DOI] [PubMed] [Google Scholar]
- 3b. Bothe J. R., Nikolova E. N., Eichhorn C. D., Chugh J., Hansen A. L., Al-Hashimi H. M., Nat. Methods 2011, 8, 919; [DOI] [PMC free article] [PubMed] [Google Scholar]
- 3c. Dethoff E. A., Petzold K., Chugh J., Casiano-Negroni A., Nature 2012, 491, 724. [DOI] [PMC free article] [PubMed] [Google Scholar]
- 4.
- 4a. Cromsigt J. A., Hilbers C. W., Wijmenga S. S., J. Biomol. NMR 2001, 21, 11; [DOI] [PubMed] [Google Scholar]
- 4b. Frank A. T., Horowitz S., Andricioaei I., Al-Hashimi H. M., J. Phys. Chem. B 2013, 117, 2045; [DOI] [PMC free article] [PubMed] [Google Scholar]
- 4c. Sripakdeevong P., Cevec M., Chang A. T., Erat M. C., Ziegeler M., Zhao Q., Fox G. E., Gao X., Kennedy S. D., Kierzek R., Nikonowicz E. P., Schwalbe H., Sigel R. K. O., Turner D. H., Das R., Nat. Methods 2014, 11, 413; [DOI] [PMC free article] [PubMed] [Google Scholar]
- 4d. Aeschbacher T., Schmidt E., Blatter M., Nucleic Acids Res. 2013, 41, e172. [DOI] [PMC free article] [PubMed] [Google Scholar]
- 5.
- 5a. Ishima R., Wingfield P. T., Stahl S. J., Kaufman J. D., Torchia D. A., J. Am. Chem. Soc. 1998, 120, 10534; [Google Scholar]
- 5b. Lundström P., Akke M., J. Biomol. NMR 2005, 32, 163; [DOI] [PubMed] [Google Scholar]
- 5c. Weininger U., Blissing A. T., Hennig J., Ahlner A., J. Biomol. NMR 2013, 57, 47; [DOI] [PubMed] [Google Scholar]
- 5d. Smith C. A., Ban D., Pratihar S., Giller K., Schwiegk C., de Groot B. L., Becker S., Griesinger C., Lee D., Angew. Chem. Int. Ed. 2015, 54, 207; [DOI] [PubMed] [Google Scholar]; Angew. Chem. 2015, 127, 209; [Google Scholar]
- 5e. Steiner E., Schlagnitweit J., Lundström P., Petzold K., Angew. Chem. Int. Ed. 2016, 55, 15869; [DOI] [PubMed] [Google Scholar]; Angew. Chem. 2016, 128, 16101; [Google Scholar]
- 5f. Lundström P., Hansen D. F., Vallurupalli P., Kay L. E., J. Am. Chem. Soc. 2009, 131, 1915; [DOI] [PubMed] [Google Scholar]
- 5g. Juen M. A., Wunderlich C. H., Nußbaumer F., Tollinger M., Kontaxis G., Konrat R., Hansen D. F., Kreutz C., Angew. Chem. Int. Ed. 2016, 55, 12008; [DOI] [PMC free article] [PubMed] [Google Scholar]; Angew. Chem. 2016, 128, 12187. [Google Scholar]
- 6.
- 6a. Bouvignies G., Kay L. E., J. Phys. Chem. B 2012, 116, 14311; [DOI] [PubMed] [Google Scholar]
- 6b. Yuwen T., Sekhar A., Kay L. E., Angew. Chem. Int. Ed. 2017, 56, 6122; [DOI] [PubMed] [Google Scholar]; Angew. Chem. 2017, 129, 6218. [Google Scholar]
- 7.
- 7a. Fürtig B., Buck J., Manoharan V., Bermel W., Jäschke A., Wenter P., Pitsch S., Schwalbe H., Biopolymers 2007, 86, 360; [DOI] [PubMed] [Google Scholar]
- 7b. Lee M.-K., Gal M., Frydman L., Varani G., Proc. Natl. Acad. Sci. USA 2010, 107, 9192. [DOI] [PMC free article] [PubMed] [Google Scholar]
- 8. Bermel W., Bertini I., Felli I., Piccioli M., Pierattelli R., Prog. Nucl. Magn. Reson. Spectrosc. 2006, 48, 25. [Google Scholar]
- 9. Desvaux H., Birlirakis N., Wary C., Berthault P., Mol. Phys. 1995, 86, 1059. [Google Scholar]
- 10.
- 10a. Moschen T., Grutsch S., Juen M. A., Wunderlich C. H., Kreutz C., Tollinger M., J. Med. Chem. 2016, 59, 10788; [DOI] [PMC free article] [PubMed] [Google Scholar]
- 10b. Trigo-Mouriño P., Griesinger C., Lee D., J. Biomol. NMR 2017, 69, 229. [DOI] [PubMed] [Google Scholar]
- 11. Palmer A. G., Massi F., Chem. Rev. 2006, 106, 1700. [DOI] [PubMed] [Google Scholar]
- 12. Xue Y., Kellogg D., Kimsey I. J., Sathyamoorthy B., Stein Z. W., McBrairty M., Al-Hashimi H. M., Methods Enzymol. 2015, 558, 39. [DOI] [PMC free article] [PubMed] [Google Scholar]
- 13. Reddy J. G., Pratihar S., Ban D., Frischkorn S., Becker S., Griesinger C., Lee D., J. Biomol. NMR 2018, 70, 1. [DOI] [PubMed] [Google Scholar]
Associated Data
This section collects any data citations, data availability statements, or supplementary materials included in this article.
Supplementary Materials
As a service to our authors and readers, this journal provides supporting information supplied by the authors. Such materials are peer reviewed and may be re‐organized for online delivery, but are not copy‐edited or typeset. Technical support issues arising from supporting information (other than missing files) should be addressed to the authors.
Supplementary