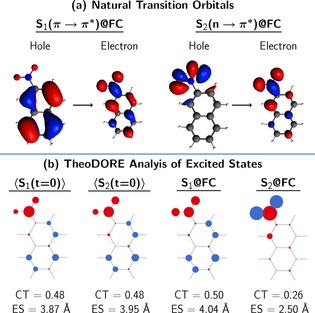
Figure 3.

a) Natural transition orbitals describing the S1 and S2 states at the FC geometry. b) Atomic electron/hole difference populations (red/blue circles), charge transfer numbers (CT), and exciton sizes (ES) of the states initially populated in the simulation (⟨S1,2(t=0)⟩) and the S1 and S2 states at the FC geometry (S1,2@FC). In the excited states, electron density is transferred from the blue circles (holes) to the red circles (electrons).
