Some NLM-NCBI services and products are experiencing heavy traffic, which may affect performance and availability. We apologize for the inconvenience and appreciate your patience. For assistance, please contact our Help Desk at info@ncbi.nlm.nih.gov.

Environmental Health Perspectives logoLink to Environmental Health Perspectives
. 2017 Nov 1;125(11):119001. doi: 10.1289/EHP2784

Erratum: “Urinary Concentrations of Organophosphate Flame Retardant Metabolites and Pregnancy Outcomes among Women Undergoing in Vitro Fertilization”

Courtney C Carignan , Lidia Mínguez-Alarcón, Craig M Butt, Paige L Williams, John D Meeker, Heather M Stapleton, Thomas L Toth, Jennifer B Ford, Russ Hauser; for the EARTH Study Team
PMCID: PMC5947943  PMID: 29095689

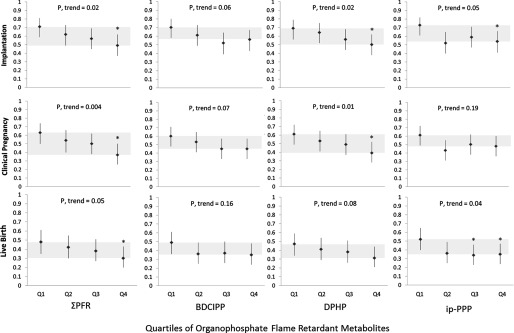
Carignan et al. have noted an error in Figure 2 of their paper, “Urinary Concentrations of Organophosphate Flame Retardant Metabolites and Pregnancy Outcomes among Women Undergoing in Vitro Fertilization.” The correct figure is included in this erratum and was part of the original submission, peer review, and accepted article. The error occurred when the authors responded to a proof request for a formatting edit, and a mistake was made in recreating the bottom row of the figure. The authors regret the error.

Figure 2.

First set of four plots showing changes in the mean proportion of cycles resulting in implantation (y-axis) across gamma PFR, BDCIPP, DPHP, and ip-PPP in Q1, Q2, Q3, and Q4 (x-axis; respective p trend values are 0.02, 0.06, 0.02, and 0.05). Second set of four plots showing changes in mean proportion of cycles resulting in clinical pregnancy (y-axis) across the above-mentioned organophosphate flame retardant metabolite concentrations in the four quartiles (x-axis; respective p trend values are 0.004, 0.07, 0.01, and 0.19). Third set of four plots showing changes in mean proportion of cycles resulting in live birth (y-axis) across the above-mentioned organophosphate flame retardant metabolite concentrations in the four quartiles (x-axis; respective p trend values are 0.05, 0.16, 0.08, and 0.04).

Adjusted mean [95% confidence interval (CI)] proportion of cycles resulting in implantation, live birth, and clinical pregnancy by quartile of urinary organophosphate flame retardant (PFR) metabolite concentrations among 211 women undergoing 297 in vitro fertilization (IVF) cycles. Gray shading indicates change in means from the first and fourth quartile. Adjusted models control for maternal age (continuous), body mass index (BMI) (continuous), race/ethnicity (black/Asian/other, white/Caucasian), year of IVF treatment cycle (continuous), and primary Society for Assisted Reproductive Technology (SART) infertility diagnosis at study entry (female, male, unknown), with continuous variables at their mean level and categorical variables weighted by their frequency in the study population. *Significantly different from the lowest quartile (Q1) at the α = 0.05 level.

Environ Health Perspect 125(8), https://doi.org/10.1289/EHP1021


Articles from Environmental Health Perspectives are provided here courtesy of National Institute of Environmental Health Sciences

RESOURCES