Abstract
The majority of current models used for modeling the pulmonary drug absorption, transport, and retention are 0D compartmental models where the airways are generally split into the airways and alveolar sections. Such block models deliver low fidelity solutions and the spatial lung drug concentrations cannot be obtained. Other approaches utilize high fidelity CFD models with limited capabilities due to their exorbitant computational cost. Recently, we presented a novel, fast-running and robust Quasi-3D (Q3D) model for modeling the pulmonary airflow. This Q3D method preserved the 3D lung geometry, delivered extremely accurate solutions and was 25,000 times faster in comparison to the CFD methods. In this paper, we present a Q3D-compartment multiscale combination to model the pulmonary drug absorption, transport, and retention. The initial deposition is obtained from CFD simulations. The lung absorption compartment model of Yu and Rosania is adapted to this multiscale format. The lung is modeled in the Q3D format till 8th airway generation. The remainder of the lung along with the systemic circulation and elimination processes were modeled using compartments. The Q3D model is further adapted, by allowing for various heterogeneous annular lung layers. This allows us to model the drug transport across the layers and along the lung. Using this multiscale model, the spatio-temporal drug concentrations in the different lung layers and the temporal concentration in the plasma are obtained. The concentration profile in the plasma was found to be better aligned with the experimental findings in comparison with compartmental model for the standard test cases. Thus, this multiscale model can be used to optimize the target-specific drug delivery, increase the localized bio-availability, thereby facilitating applications from the bench to bedside for various patient/lung-disease variations.
Keywords: Q3D, Quasi 3D, multiscale, lung absorption, Yu and Rosania model
1. Introduction
Pulmonary drug delivery using Orally Inhaled Drug Products (OIDPs) is increasingly used for both treatment of lung diseases and in delivering drugs to the systemic circulation [10,11,28]. In order to reach the desired effectiveness and safety of OIDPs, appropriate disposition on targeted regions is essential. However, the bioavailability of the OIDPs is determined by numerous complex factors, such as physical characteristics of particles, spray characteristics, inhaler type/design, anatomical parameters of airways, inhalation profiles, and respiratory conditions of subjects [1,21]. Recently, several computational studies were undertaken to analyze and optimize the deposition physics of OIDPs [16,17].
However, the issues like the spatio-temporal pulmonary drug presence, short/long term pulmonary retention, and bio-availability in the lower lung, all that are more important in the design of drugs for treating diseases like asthma, COPD and lung cancer, are yet to be efficiently addressed by current models. The main reason for this research impediment is the ubiquitous use of the 0D compartmental models for the pulmonary drug absorption, transport, and retention [4,38]. The lung airways are treated as 0D compartments and most of the times a collection of airways are combined into one block for simulation purposes (like central airways, peripheral airways) [38]. The other approximations of this 0D approach include (i) constant diameters and lengths in a particular airway section, (ii) a 1:2 branching in accordance with the Weibel model [34], (iii) no effect of the anatomical geometry, i.e., the three-dimensional (3D) geometrical structure and (iv) uniform division of the flow rate when the parent airway branches into two daughter airways. This also means that the extension to non-standard lung geometries (for instance the diseased lungs) is not trivial. Nevertheless, this approach has been widely used as the driver for particle transport simulations for various deposition and absorption lung models [34,35,36,38].
Researchers have also used 3D Computational Fluid Dynamics (CFD) models to obtain the deposition on the lungs [16,17]. This approach involves obtaining the STL surface mesh from computed tomography (CT) scans or other images, creating volumetric meshes inside the lung domain and then solving the conservation equations in each computational cell. Sufficiently high number of cells (i.e., degrees of freedom: DOF) are required in order to accurately depict the lung geometry and to minimize the spatial discretization error. Similarly, a small enough time step is required in order to minimize the temporal discretization error. The above constraints necessitate the lung mesh to have more than a million DOF and for the time step to be small enough to cause the computational time to be on the order of days (even with parallel computing) for simulating a few breathing cycles. The pulmonary and the systemic drug absorption, transport, and retention processes haves O(days) timescales and hence CFD will be very inefficient to be used for such purposes.
A third approach, namely the Q3D approach was presented by Kannan et al [18] for modeling the airflow in human lungs. The Quasi-3D (or Q3D) approach is a robust, fast running and easily adaptable formulation, wherein a high fidelity surface CFD type mesh is contracted to a structure of connected wires, with well-defined radii. The surface mesh for the human lung airway was obtained from the Zygote Body web application (www.zygote.com). This mesh corresponds to the 50% percentile male adult human. This geometry represents the lung surface very well and is able to capture several features like (i) A strong ring structure present in the trachea, (ii) Noticeable ring structure in the first bifurcation region, (iii) Non-symmetrical bifurcations, (iv) One-to-many splits in the airways, (v) non-circular cross-sections in trachea and other airways and (vi) Out of plane rotations for the bifurcations.
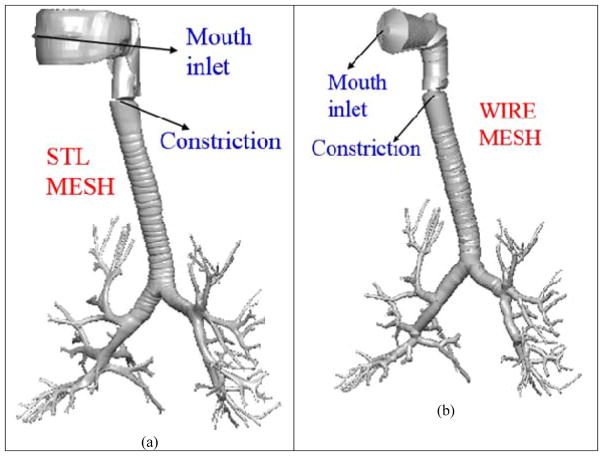
The nasal region was truncated. This surface mesh has around six to eight airway generations. The surface mesh and the wire mesh are shown in Figure 1. It can be seen in the figure that the lung geometry details are still preserved. The wire mesh has around 1000 cells (i.e. Degrees of Freedom or DOF). The mouth region is not a high fidelity representation of the original surface mesh since that region is sufficiently complicated and hence cannot be accurately represented by a cylindrical geometry. A traditional CFD mesh built using the surface mesh would result in approximately 2–5M cells [17, 29, 20]; solving the transport equations on such a mesh would require several parallel machines and would result in several days of simulation time. NOTE: The above 2–5 M cells are needed to maintain a y+ (i.e. the non-dimensional distance to the wall) of around 1. If the meshes use an OmniTree based structure, this number can be restricted to around 2M cells. On the other hand, if the meshes are tetrahedral meshes, the number count can exceed 5M. The cell size, normal to the airway walls is around 0.25 mm. The adaptive OmniTree format ensures that the overall size does not increase exponentially, due to this small grid size.
Figure 1.
Lung airway model. Case (a) High fidelity lung airway surface mesh obtained from the zygote body list; it is used to extract the center line and radius of the lung airways. Case (b) Q3D wire mesh for the same region constructed on the extracted information from the lung airways. It is clear that the generated wire mesh is a good approximation to the high fidelity CFD mesh in most of the lung airways.
The Quasi-3D wire mesh can produce a result which is qualitatively acceptable within a few minutes of (forward run) simulation time (since they are around 10000 times faster than CFD methods [18])
The conservation equations are then solved in each of these wires. The resulting simulations are extremely fast (compared to using CFD simulations) due to the Quasi-3D nature of the wire mesh, with the Q3D approach being 3000–25000 times faster than the CFD simulations. The Q3D simulations also converge more easily, since there are no badly skewed cells or highly stretched cells (unless of course, the CFD mesh uses a polyhedral mesh), thereby requiring fewer steady/unsteady sweeps during a steady/transient simulation. Details on the Q3D creation, its accuracy, its speed, solution accuracy (including in the context of the flow in the human lung), problem setup and robustness can be obtained from Kannan et al [18]. Similarly, the details on the flow solver, the assembly of the matrices, the spatial and temporal schemes and the modeling of the turbulent stresses can be obtained from Kannan et al [14,15,16]. The authors would like to admit that complicated secondary flows [3], the local vorticity creation at the ridges and other detailed features cannot be captured by the Q3D model. However, it can accurately predict the local fluid pressures and provide accurate transport effects. Hence, it can be applied in areas wherein the effect of the secondary flows are not important (like spirometry and the drug transport in the surface lining liquid, as in this paper)
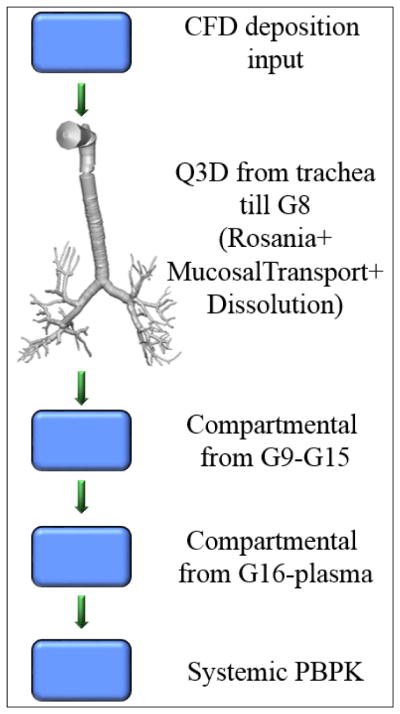
In this paper, we have developed and implemented a Q3D-compartment multiscale combination to model the pulmonary drug absorption, transport, and the retention. We have adapted the lung absorption model of Yu et al [38] for the absorption kinetics. A schematic of this multiscale computational domain is shown in Figure 2. The spatially resolved section ends at around G8. The remainder of the airways (i.e., latter airways), the alveoli and the systemic organs are modeled using compartments. We also implemented annular lung layers and the solved the conservation equations on them. This allowed us to spatially model the transport of the drug into the lung (i.e., across the layers) by adapting the model of Yu et al [38]. A mucosal clearance model was implemented, based on the model of Hoffmann and Asgharian [13] and a CAT model was used for the absorption from the GUT section [24]. The CFD and drug-particle transport models of Kannan et al [17] and Tian et al [29] were used for the deposition process. In other words, these high fidelity CFD and particle transport modules provide the initial conditions for the multiscale Q3D-compartment pulmonary drug absorption, transport, and the retention processes.
Figure 2.
Multiscale Q3D-compartment computational domain.
NOTE 1: We would like to repeatedly stress that the depositions have been (validated and) obtained using a high fidelity CFD and particle transport formulation [17,29]. All the primary send secondary flow features were well resolved to get the spatially accurate (and validated) depositions. The deposited drug (in the surface lining liquid) form the initial conditions for the species transport equations in O(micron) thickness lung layers. In other words, the Q3D is used only in the O(micron) thickness region at the edge of the airway walls (not in the lumen region). In addition, the conservation equations (discussed later), are for the species conservation in the lung layers. We will not solve any air flow conservations equations using the Q3D method in this paper.
NOTE 2: The objective of this paper is to demonstrate the use of the Q3D-compartment combination to model the pulmonary drug absorption, transport, and the retention. Hence, the actual physiological models (for instance, the absorption model of Yu et al [38], the CAT model for the absorption from the GUT [24], the models of Rodgers et al [26,27] to obtain the partition coefficients in the different organs) will not be discussed.
NOTE 3: This is the first paper, wherein a real life problem, is attempted using the Q3D approach.
This paper is organized as follows. In the next section, we give a detailed introduction to this multiscale Q3D-compartment setup. Setting the initial condition using the CFD results is presented in Section 3. The inter layer boundary conditions are described in detail in section 4. The multiscale Q3D-compartment simulations are presented and compared with the compartmental results and the experimental data in section 5. Finally, conclusions from this study are summarized in Section 6.
2. The multiscale Q3D-compartment model setup
The original Q3D model
In many biomedical and engineering problems, the physical process occurs in networks of pipes, cables, wires, or other one-dimensional (1D) structures. The best examples are the human vascular system, lymphatic network, neurons with a network of dendrites and axons, microfluidic channels in biochips and of course the case of air flow transport in the lung. Full-fledged 3D computational simulations of such large tubing structures is possible for some cases, like for instance the CFD particle transport/deposition in the lung airways (wherein the total physical time is in the order of seconds). However, 3D computational simulations that require physical timescale greater than several hours are not feasible and typically not needed.
A 1D modeling of tubing network distributed in a 3D space is the best approach for such problem. Kannan et al [18] have developed a wire model to solve such problems. The major advantage of this approach is the ease of model setup, high computational speed, simple visualization of results, and easy link to compact models such as spring/mass/damper devices, valves, pumps, controllers, and also to compartmental models. The previous section discusses the accuracy and the speed-up factor for a sample simulation performed using the Q3D and CFD simulations. More details, including the wire-generation process and the accuracy/speedup comparisons for a host of simulation test cases, can be obtained from Kannan et al [18].
The annular Q3D model
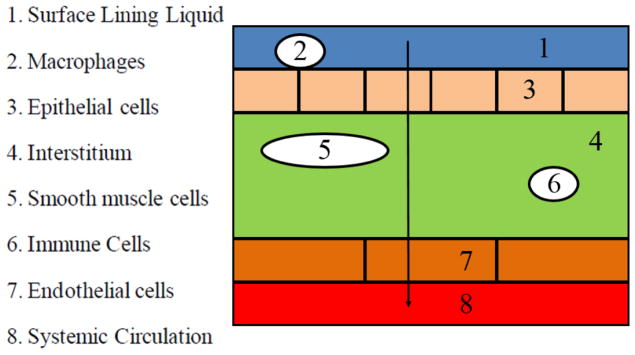
The schematic of the Yu model for the drug into the lung (i.e., across the layers) is shown in Figure 3.
Figure 3.
Diagram representing the general route of drug transport across the lung layers, to the blood. Model adapted from Yu et al [38].
The structure of the Yu model is shown in Figure 3 where the lung tissue (either the airway region (AW) or the respiratory region (AL)) is represented by multiple compartments and each compartment represents a cell type delimited by a phospholipid bilayer. The Yu model considers the detailed tissue structure such as the surface lining liquid, the epithelium, the interstitium, the smooth muscle cells, the immune cells, the endothelium, and the plasma. Across the histological architecture of lung tissue, the Yu model divides the lung tissue into eight compartments. These need to be incorporated in the Q3D component of the multiscale approach.
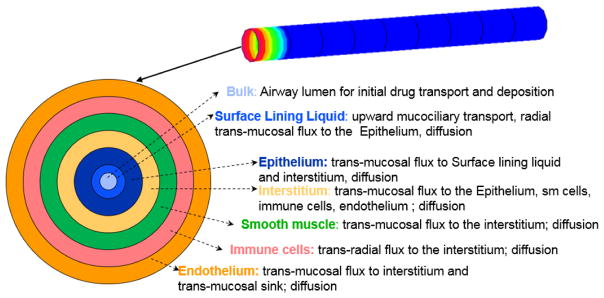
In this paper, the Q3D model was further improved, by incorporating the layered (or annular) sections. In this approach, the conservation equations are solved in the various annular layers. The first layer lies on the wire walls, the second layer lies between the first and third layers and so on. The layers have different thicknesses (based on the physics, and is obtained from Rosania et al [38]). Figure 4 provides the pictorial representation of this layers approach, in the context of the Yu model. NOTE: There are no macrophages in the airway section, hence they are omitted in this pictorial representation. Thus, this layered Q3D model can be easily used to model the transport across the lung walls.
Figure 4.
Pictorial representation of the different annular layers in the Q3D model, in the context of the model of Yu et al [38]. Layer thicknesses are not to scale.
The compartmental model
The Q3D model was created from the Zygote5 STL surface mesh. This has around 6–8 airway generations. This STL surface mesh was obtained from CT scans. These CT scans cannot obtain the airway geometry details beyond a particular extent, hence the curtailing of the airway geometry to around 8 generations. The rest of the airways (till airway 15) and the alveoli (till generation 24) have to be handled using the compartmental models. As shown in Figure 2, we have two lumped compartments: the latter airway compartment (from G9-G15) and the alveoli compartment (from G16-G24). The dissolution and the absorption are modeled using the Yu model in these lumped compartments. A mucosal clearance model is also implemented. Due to the mucociliary clearance, part of the undissolved and dissolved drug in the airways is moving towards to the mouth and finally swallowed into the gastrointestinal tract. This drug transport is modeled as a continuous drug flux into the CAT model, i.e., the rate of cleared drugs in the first generation in the human lung is the drug input rate into the stomach compartment in the CAT model. In this multiscale model, the input from the lumped airway section forms the inlet boundary condition for the Q3D outlets.
The generic PBPK model
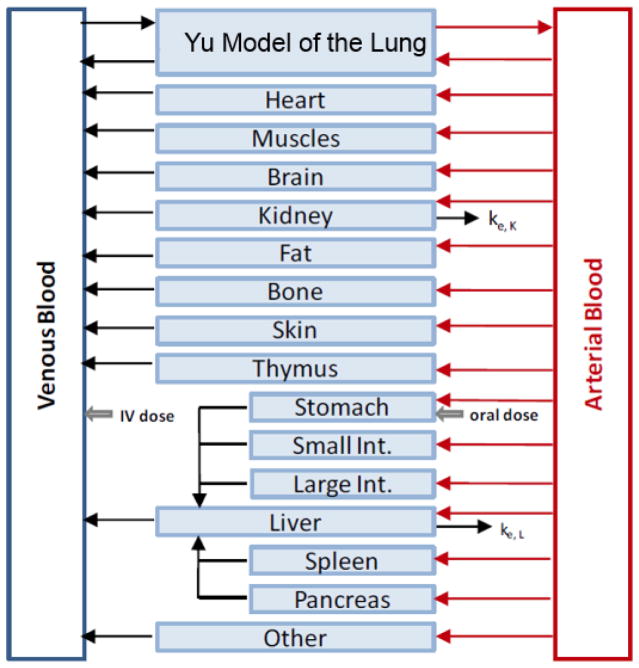
PBPK modeling is an important modeling method to simulate absorption, distribution, metabolism and excretion (ADME) of drugs in humans and other animal species. It is widely used in pharmaceutical research and drug development particularly because it allows for inter-species transpositions and/or extrapolation from one mode of administration to another (e.g., inhalation to oral). The generic PBPK model consists a group of ordinary differential equations (i.e., in the compartment form) for drug concentration in various tissues. The PBPK model in this platform includes fat, brain, bone, heart, muscle, skin, thymus, stomach, small intestine, large intestine, pancreas, spleen, liver, kidney, lung (airway and alveoli zones), arterial blood, venous blood, and “other”, as shown in Figure 5. The lungs are divided into the airway region and the alveoli region. More details can be obtained from Cabal et al [4].
Figure 5.
The generic whole body PBPK model.
3. Initial Conditions for the multiscale framework using CFD models
The initial conditions (IC) for the multiscale model is the drug deposition in the lung walls. In the past, Kannan et al [17] and Tian et al [29] have performed and validated the Budesonide deposition on the lung walls, in the context of an oral Budesonide drug delivery using a Novelizer Dry Powder Inhaler (DPI) device.
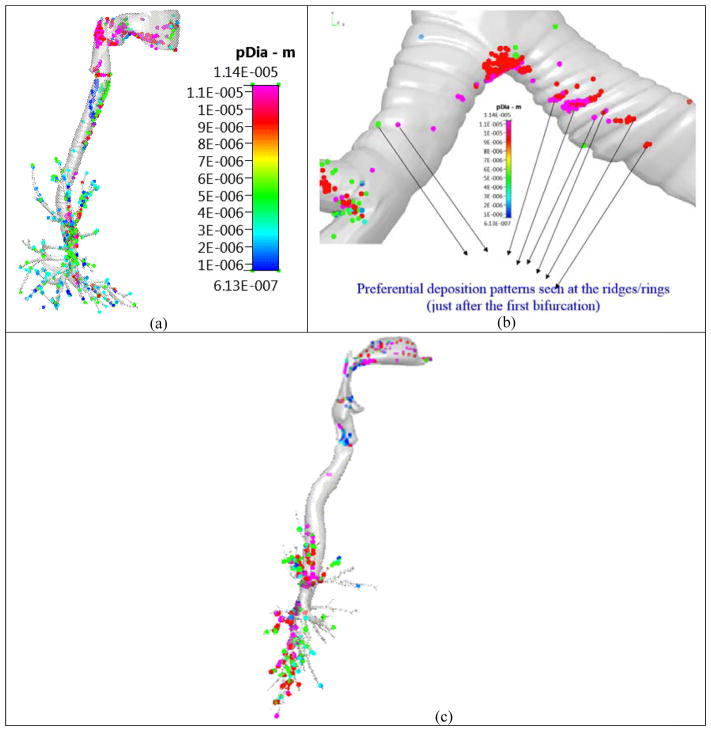
In the past, researchers have used the Typical Path Lung (TPL) model [33] (and its variants [7]) to obtain the deposition in the various lung regions. Thus, they have used this to compare their CFD results, and in a loose sense, evaluate their model. The TPL (and its variants) is a 0D compartmental model and has the following assumptions: (i) constant diameters and lengths in a particular airway section, (ii) a 1:2 branching in accordance with the TPL model, (iii) no effect of the anatomical geometry, i.e. the three-dimensional geometrical structure and (iv) uniform division of the flow rate when the parent airway branches into two daughter airways, (v) constant flow rates during inhalation and exhalation,(vi) particle velocities are the same as flow velocities, (vii) the deposition of the particles is computed from a single inhalation and exhalation cycle, i.e., the effect of subsequent breathing cycles on the deposition is neglected. Hence such models are used only for very small particles (like dust particles) and in normal breathing conditions (i.e., at smaller flow rates). Hence, even models like the TPL model cannot be used to evaluate CFD geometrical models, in the context of drug delivery. Figure 6 shows the enhanced deposition due to the tracheal rings and in the first bifurcation region. Such phenomena cannot be captured by the TPL model.
Figure 6.
Particle deposition pattern on the Zygote5 lung model. Figure reproduced from Kannan et al [17]. Case (a) Enhanced deposition in the tracheal walls; Case (b) Enhanced deposition at the ridges/rings just after the first deposition and Case (c) Negligible deposition in the trachea in a ring-less airway model.
NOTE 1: The outlet flow boundary conditions, the time duration, the inlet BC for the particles, the local vorticity creation, the deposition comparisons between the Zygote5 and ring-less lung models and other particle transport details can be obtained from Kannan et al [17].
NOTE 2: The effects of the local vorticity created by the cartilaginous rings, the geometry, and the turbulence intensity on the deposition are discussed in detail in Kannan et al [17]. A The CFD model thus gets an accurate spatial deposition pattern (compared against experiments and other simulations in [17]). However, these happen in the first O(3.0) seconds, i.e. during the forced oral inhalation. Hence, we will consider these depositions as the initial conditions for the dissolution and transport of the drug into the plasma region (i.e. across the lung walls), using the Q3D method (i.e. the secondary multiscale simulation). In this secondary multiscale simulation, the effect of the air flow, the breathing conditions, the turbulence in the air, the local vorticity creation, the airflow bifurcation at the carina are minimal, since the drug is already settled in the surface lining liquid.
NOTE 3: The current approach and the preceding works of Kannan et al [17, 16], are focused on oral delivery of the drug. Hence, issues like the particle trapping in the nostril hair, are never discussed. The nasal region is also truncated in the CFD and Q3D models. The spatial deposition pattern for the Q3D domain was obtained from Kannan et al [17]. The deposition in the latter airways and the alveoli were obtained from Tian et al [29]. It must be noted that Tian et al [29] used a SIP (Stochastic Individual Pathway) model, to obtain these secondary depositions. In order to implement the SIP model approach, they considered multiple factors, including the division of the geometry into multiple lobes, interpolation of velocity and particle profiles between sections, use of transient or steady state simulations, use of monodisperse or polydisperse aerosols, and selection of outlet boundary conditions. Simulations in the SIP geometries implemented steady state conditions with velocity profiles interpolated at mean flow conditions. Particles were initialized at the outlets using the polydisperse size distributions using either a blunt or parabolic spatial profile, respectively. Details on the differences arising from these different factors can be obtained from [29] and the preceding works of Tian et al, which focused on the development of the SIP model. Some of these factors like the ventilation in different lobes [37] and effect of the outlet BCs [1,5] have been studied by other researchers.
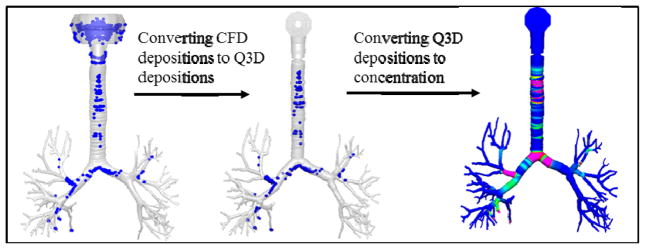
Figure 7 provides a pictorial representation for setting the IC in the Q3D model. For the sake of easy and intuitive explanation, a mono-disperse drug particle size of around 11.4 μm diameter was used in this figure (though the actual simulations used the poly-disperse drug). The first step is to obtain the depositions on the Q3D model using the CFD approach. As expected, the depositions are predominant on the bifurcations, since the particle size is very large. The second step is to map these particles and their locations onto the Q3D mesh. The third step is to convert the deposited drug masses into undissolved drug concentrations, so as to provide an ideal starting point for the Yu model. As expected, the concentrations are higher in the bifurcation regions. The drug masses in the remainder of the lung (i.e., latter airways and the alveoli) are also set, based on the CFD results. Hence, we have effectively used accurate CFD results as ICs for our multiscale model.
Figure 7.
A pictorial representation, for setting the initial conditions in the Q3D model.
NOTE: The deposition in the Oral, Pharyngeal and Laryngeal (OPL) section is modelled using the compartmental model, since (i) that geometry cannot be well represented by the Q3D model, (ii) there is no absorption physics in that region: the drug deposited in the OPL section is immediately (when compared to the timescales of the lung absorption) sent to the GUT section.
4. Inter layer boundary conditions for the annular Q3D model
Only neutral and ionized drug in the aqueous phase is allowed to transport across radial layers. The neutral drug transport is passive and driven by the activity difference in two neighboring compartments and follows Fick’s first law. The ionized drug transport is driven by the electrochemical potential difference and described by the Nernst-Plank equation. There is no need to list all the transport flux across any barriers because there are several compartments in the Yu and Rosania model. To demonstrate the key idea of modeling transport flux and of being linked to other modules in the computational platform, we describe the transport flux in the following way.
In the first example, consider the drug flux across the endothelial apical barrier (between the endothelial compartment and the plasma compartment or the barrier between compartments 7 and 8 in Figure 3. This is to demonstrate the key idea of modeling the transport flux and drug absorption into the blood. The neutral drug transport is passive and driven by the difference of neutral drug activity in the aqueous phase in two neighboring compartments and follows Fick’s first law:
| (1) |
Here JAW-n,7-8 is the transport flux on a unit surface area of the neutral drug across the barrier between compartment 7 and 8 in the airway zone; it has a unit of drug mass over time over an area such as μg/min/cm2. an,AW7/8 is the neutral drug activity in the aqueous phase in compartment 7 or 8 in the airway region. PAW-eff,n is the drug permeability of the barrier. The total mass flux rate across the barrier JAAW-n,7-8 (with a unit of drug mass over time such as μg/min) is obtained by multiplying the total surface area for drug transport.
| (2) |
AAW7-8 is the area of the barrier.
The ionized drug transport is driven by the electrochemical potential difference and described by the Nernst-Plank equation. Hence the net flux on a unit surface area of ionized form drug is described by the following equation.
| (3) |
Here JAW-d,7-8 is the transport flux of the ionized drug across the barrier between compartment 7 and 8 in the airway zone; it has a unit of drug mass over time over an area such as μg/min/cm2. ad,AW7/8 is the ionized drug activity in the aqueous phase in compartment 7 or 8.
| (4) |
where, z is the electronic charge of the ionized drug molecule, E is the membrane potential, F is the Faraday constant, R is the universal gas constant, and T is the absolute temperature.
The total mass flux rate of the ionized form drug across the barrier JAAW-d,7-8 (with a unit of drug mass over time such as μg/min) is obtained by multiplying the total area for drug transport.
| (5) |
The overall net flux on a unit surface area JAW,7-8 is the sum of the neutral drug flux and the ionized drug flux. The area in each computational cell is the side sectional area and is given by 2πrL.
NOTE: All of the above equations can be obtained from the works of Yu and Rosania. However, these have now been extended to every computational Q3D cell. In the original model of Yu and Rosania, the area encompassed the surface area of the entire airway region. The different layer thicknesses are listed in Table 1.
Table 1.
Airway thickness in the human lung
| Layer | Thickness (μm) |
|---|---|
| Surface lining liquid | 15 |
| Macrophage | NA |
| Epithelium | 50 |
| Interstitium | 3.5 |
| Immune cells | 1 |
| Smooth cells | 48 |
| Endothelium | 0.4 |
The radius and the mass fractions (at the entry location) of the polydisperse particles are provided in Table 2. This was obtained from Tian et al [29] and later used in Kannan et al [17].
Table 2.
Discretized polydisperse mass distribution used in this study.
| Diameter (μm) | Mass fraction |
|---|---|
| 0.613 | 0.03604 |
| 1.08 | 0.09805 |
| 1.91 | 0.1601 |
| 3.08 | 0.1066 |
| 5.35 | 0.07499 |
| 9.15 | 0.02758 |
| 11.4 | 0.5071 |
5. Results
PBPK simulations for the OIDP Budesonide
The compartmental and the multiscale simulation outputs are compared with the published experimental data using 1000 μg of Budesonide delivered from the DPI (continuing with the example used in the previous sections). Figure 8 shows the undissolved surface lining liquid concentration in the Q3D section of the lung at t=0, i.e., the IC for the simulation. Unlike the mono-dispersed case, the concentration peaks are not limited to the bifurcation regions. The concentrations in all the other layers are zero.
Figure 8.
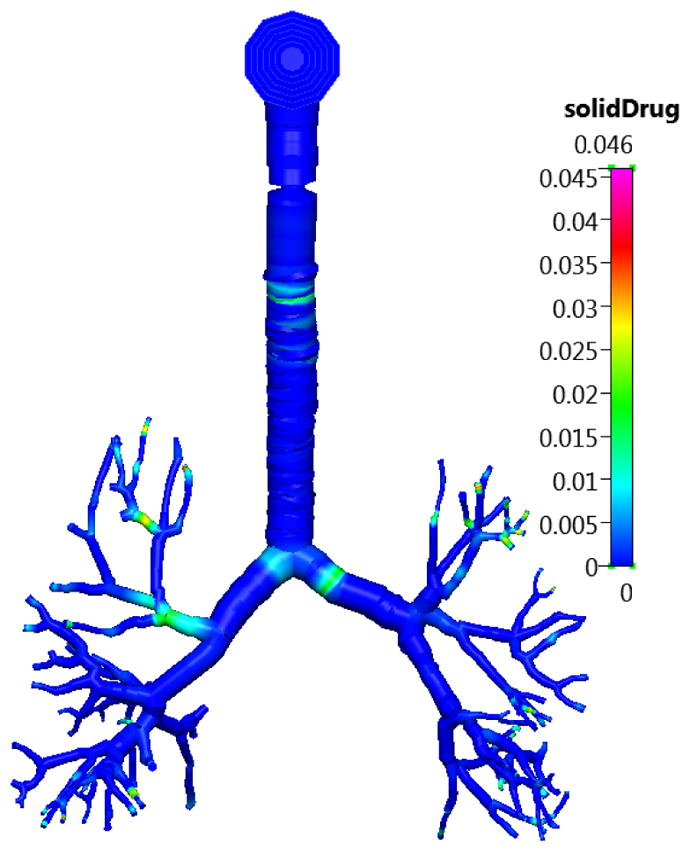
The concentration of the undissolved Budesonide drug in the surface lining liquid section of the lung in the Q3D model at t=0. Inhalation mass=1000 μg. Concentration in units of kg/m3.
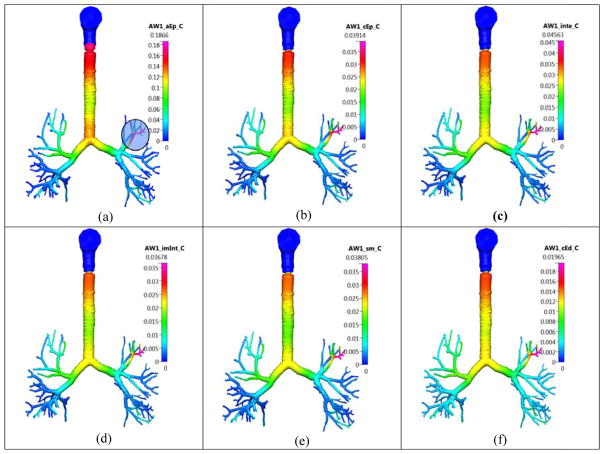
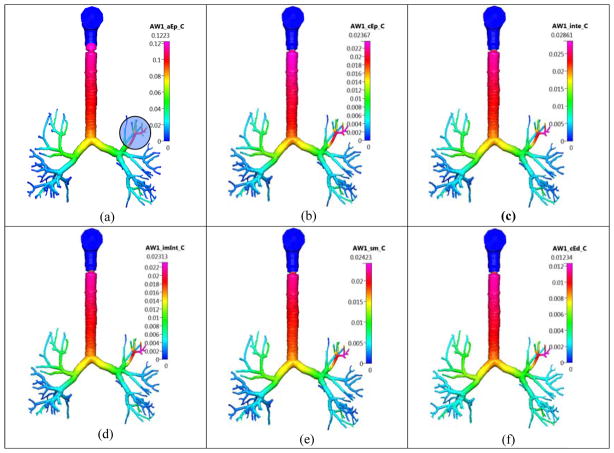
Figure 9 shows the concentrations in the different layers, at t=120 min. There is a noticeable peak in the concentration in one of the small airways on the top-left, due to the original deposition (shown in a shaded circle in the same figure). The values at the top of the trachea are higher, since the cilia motion pushes the dissolved and the undissolved drug, continuously toward the gut. Hence, the value at the top of the trachea is higher.
Figure 9.
The airway (AW) concentration of the dissolved Budesonide drug in the different lung layers in the Q3D model at t=120 min. Inhalation mass=1000 μg. Concentration in units of kg/m3. Case (a) surface lining liquid; Case (b) epithelium; Case (c) interstitium; Case (d) immune cells (imInt); Case (e) smooth muscle cells (sm); Case (f) cytoplasmic side of endothelium cells (cEd).
Figure 10 shows the concentrations in the different layers, at t=250 min. All the values are smaller than their 120 minute counterparts. In addition, the concentration in the trachea is more regular, with an increasing pattern seen toward the top. This means that the initial transients have reduced and the mucosal clearance is now continually pushing the drug to the top.
Figure 10.
The concentration of the dissolved Budesonide drug in the different lung layers in the Q3D model at t=250 min. Inhalation mass=1000 μg. Concentration in units of Kg/m3. Case (a) surface lining liquid; Case (b) epithelium; Case (c) interstitium; Case (d) immune cells (imInt); Case (e) smooth muscle cells (sm); Case (f) cytoplasmic side of endothelium cells (cEd).
Figure 11 shows the drug concentration in the vein using the compartmental approach, the multiscale approach and from various experiments. The main observations are as follows:
Figure 11.
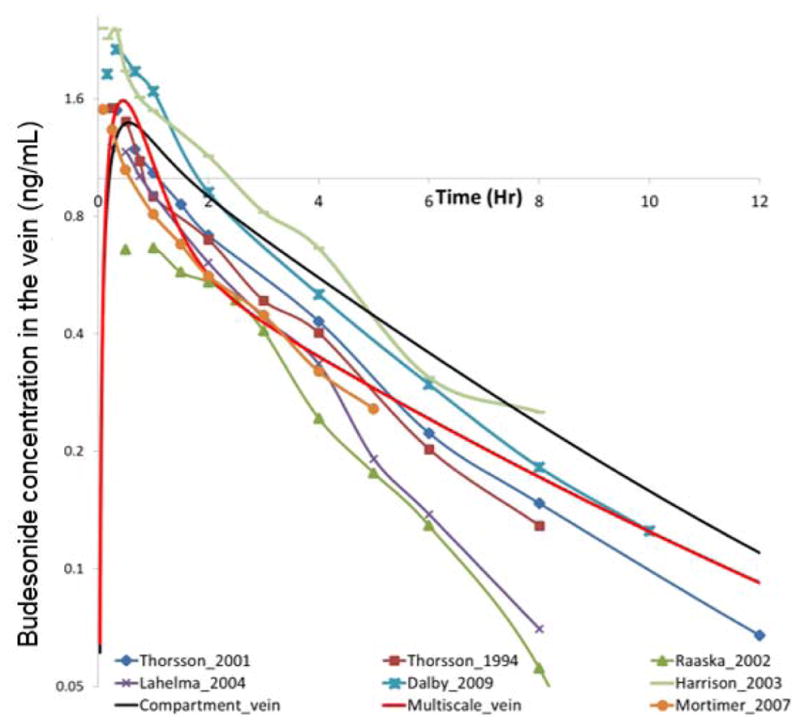
Concentration of the Budesonide drug in the vein. Legend details: (i) Thorsson_2001: [30]; (ii) Thorsson_1994: [31]; (iii) Raaska_2002: [25]; (iv) Lahelma_2004: [22]; (v): Dalby_2009: [8]; (vi) Harrison_2003: [12]; (vii) Mortimer_2007: [23].
The compartment model over-predicts almost all of the experimental readings. In contrast, the multiscale framework is in the midst of the experimental readings.
The compartmental model displays one constant slope, during the descent from the peak value. In contrast, the multiscale model displays two slopes: an initial rapid descent and then a slow descent. Many of the experimental readings (for instance, the readings of Mortimer et al [23], Thorsson et al [30], Thorsson et al [31], Dalby et al [8] and Harrison et al [12]) are in agreement with this multi-slope pattern.
The authors feel that this is to some extent due the compartmental model using just one particle size (referred to as the “Mean Mass Aerodynamic Diameter” or “MMAD” in the literature) to mimic the effects of the entire spectrum of particles. This changes the overall deposition pattern. The initial increase is due to the rapid transport of the drug deposited in the NOPL(Nasal Oral Pharyngeal Laryngeal) section to the GUT and then to the blood. In reality, the larger particles are inevitably stuck in the NOPL or in the first few generations of the airways. In other words, they hardly reach the alveoli. The transfer to the blood from the alveoli is faster than the transfer from the airways (but still slower than the direct transfer from the GUT to the blood). This is because the alveoli wall layer thicknesses are considerably smaller than the airway wall layer thicknesses. In the compartment model, the mean mass aerodynamic diameter particles are much smaller than the larger sized particles. They are able to reach the alveoli, and then to the blood. Hence the decay, after the peak is arrested.
Table 3 shows the Area Under the Curve (AUC) for the concentration in the vein using the current simulations and from the available data. The main observations are as follows:
Table 3.
Area under the curve (in μg-hr/mL) for the Budesonide drug in the vain.
| AUC | Compartment | Multiscale | Literature |
|---|---|---|---|
| 0–5 hrs | 4.118E-03 | 3.192E-03 | 2.918e-3 (Mortimer, 2007) |
| 0–8 hrs | 5.097E-03 | 3.864E-03 | 6.43e-3 (Harrison, 2003) 3.266e-3 (Lahelma, 2004) 3.888e-3(Thorsson, 1994) |
| 0–10 hrs | 5.480E-03 | 4.157E-03 | 6.055e-3 (Dalby, 2009) 2.504e-3 (Raaska, 2002) |
| 0–24 hrs | 6.360E-03 | 4.920E-03 | 4.95E-03 (Thorsson, 2001) |
The multiscale AUC is closer to the experimental result in the 0–5 hour range, compared to the compartmental AUC.
The multiscale AUC is much closer to two of the three experimental results in the 0–8 hour range, compared to the compartmental AUC.
There is a vast variation in the 0–10 hour AUC in the experimental readings. Hence, they cannot be considered for analysis.
The multiscale AUC is much closer to the experimental result in the 0–24 hour range, compared to the compartmental AUC.
Hence, based on the above pictorial and quantitative comparisons, the multiscale solution is of higher fidelity than the compartmental solution. The multiscale model captures the depositions in a spatially accurate fashion, models the dissolution for the different particle sizes (thereby converting from the solid to the dissolved drug at a physiologically correct rate), and connects the concentration in the different layers using physiologically consistent conservation equations. All of these attributes result in the multiscale model delivering higher fidelity results than the compartmental model.
NOTE: For the sake of illustrating the numerical accuracy, we have presented the residuals, for the principal variables, at two selected time stages. Figure 12 shows the different residuals as a function of iterations at two different time stages. These plots are to emphasize that the unsteady residuals are quickly reduced to machine-zero in a couple of iterations in each timestep. The Q3D system has no stretched cells, no skewed cells, fewer number of cells (compared to the 3D system) and has an intrinsic transport to the systemic circulation (which is subsequently cleared by the kidneys and the liver). Hence, the convergence is rapid. This is in accord with the observations, presented by Kannan et al [18]. It must also be noted that the different species modules are called one after the other (in each iteration) and are updated in a Gauss-Seidel like fashion. Hence, the residuals, do not start to zero, for any of the variables, at time=0. The convergence could in theory be made even faster, had the final [A][x]=[b] matrices encompassed all the species modules (but this requires a significant amount of book-keeping).
Figure 12.
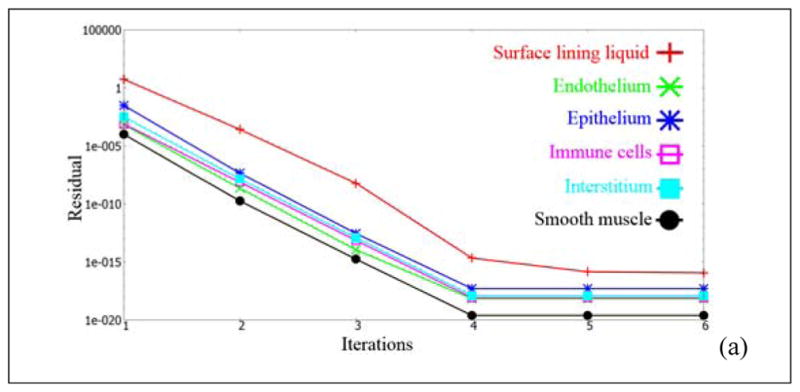
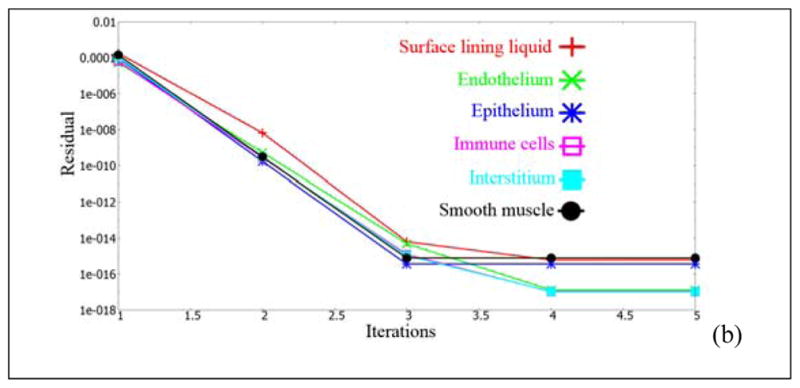
Unsteady residuals, as a function of the iteration count at two different time stages. Case (a): at t=0 hours; Case (b): at t=5 hours.
PBPK simulations for the OIDP Fluticasone Propionate
In this test case, the PK simulations for the Fluticasone Propionate (FP) drug are compared. Unlike the Budesonide, FP has a very low systemic bio-availability [9,39]: mainly due to its low solubility (1/100th the solubility of Budesonide [40]). Hence, noticeably different physics is expected (w.r.t. the Budesonide simulations and experiments).
FP and Budesonide have similar densities, with the density of Budesonide being around 1270 kg/m3 and the density of FP being 1320 kg/m3 [41,42]. Hence the spatial distributions in the lung for these two drugs are expected to be similar (if they emanated under similar conditions). The ratio of the Stokes number for the two drugs should be the ratio of the densities, assuming similar particle sizes. This comes to around 1.039. The deposition is generally considered to be a strong function of the Stokes number [19]. Experiments, however, suggest that 72–78% of the drug is deposited in the oropharynx region [9]. Hence, we scaled the deposition in the OPL region from 67% (from CFD budesonide results) to 75%. The deposition in the other regions was appropriately scaled down.
NOTE: Just to reiterate, there was only one single CFD/particle transport simulation conducted (for Budesonide particles). The FP’s initial distribution was scaled, based on experimental data.
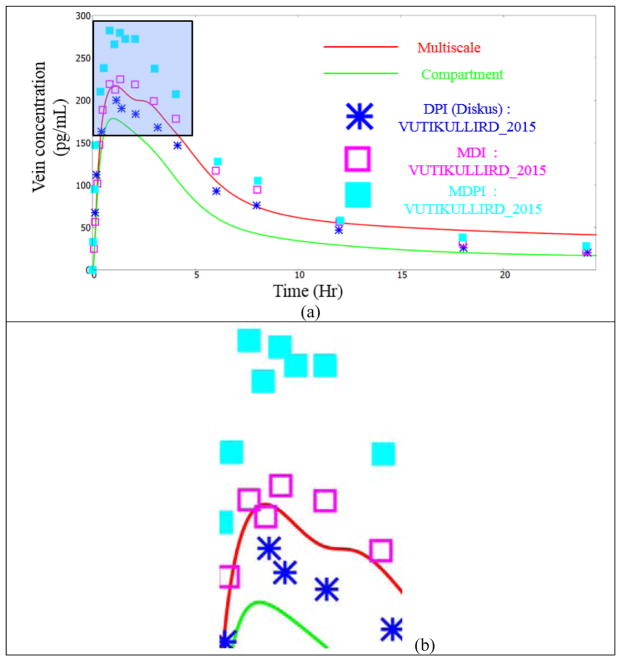
Figure 13a shows the drug concentration in the vein using the compartmental approach, the multiscale approach and from various experiments. The main observations are as follows:
Figure 13.
Concentration of the FP drug in the vein. Experimental data points from Vutikullird et al [32].
The concentration in the vein is much lower than the Budesonide simulations (and experiments). This is due to the low solubility of the FP drug.
The initial rise is the same in both the models since it is dictated by the CAT model. The drug transport to the GUT is very fast, while the dissolution on the lung surface lining liquid is slow and the transport across the lung walls is also slow. Hence the initial rise is mainly due to the deposition in the OPL region
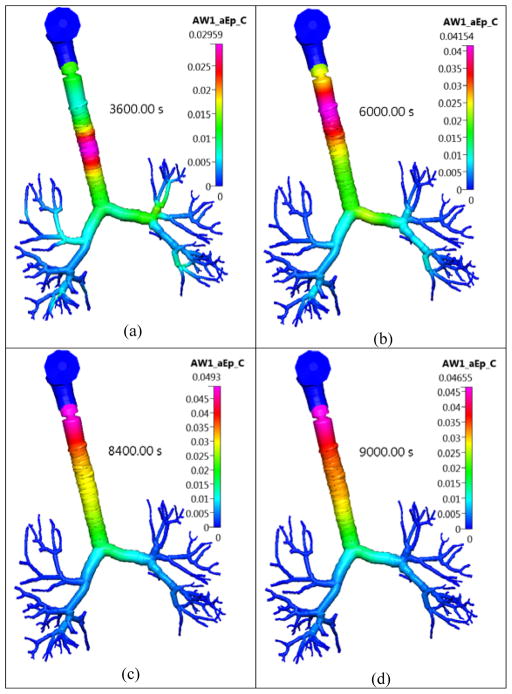
We see a relatively non-diminishing concentration profile, during the 1–2.5 hr timeframe in some experiments, as shown in Figure 13b. This is reasonably predicted by the multiscale model. This phenomenon can be explained by visualizing the dissolved drug concentration in the lung surface lining liquid during this timeframe, as shown in Figure 14. It can be seen that a concentrated blob of the dissolved drug in the surface lining liquid, entering the GUT (from the trachea) during that time. Hence the drop in the concentration is arrested by this blob. These local features are not captured by the compartmental model.
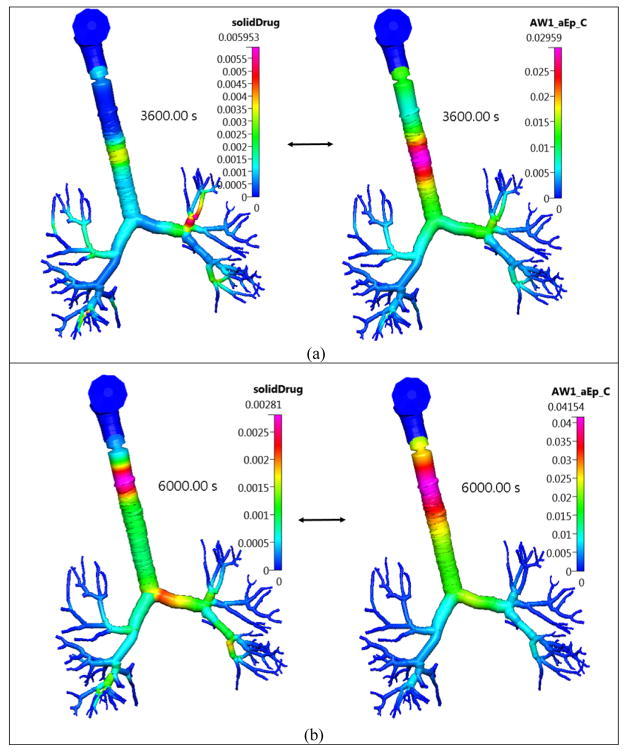
The effect of the low solubility is evident from Figure 15, wherein the solid drug concentration in the lung surface lining liquid is shown. Unlike Budesonide, there is a considerable amount of solid drug present even at this time stage and the blob is locally created due to the slowly dissolving solid drug.
Figure 14.
The concentration of the dissolved FP drug in the lung surface lining liquid layer in the Q3D model at different timestages. Inhalation mass=1000 μg. Concentration in units of kg/m3. Case (a) at 3600s; Case (b) at 6000s; Case (c) at 8400 s and Case (d) at 9000s.
Figure 15.
The concentration of the solid and dissolved FP drug in the lung surface lining liquid layer in the Q3D model at different timestages. Inhalation mass=1000 μg. Concentration in units of kg/m3. Case (a) at 3600s; Case (b) at 6000s;
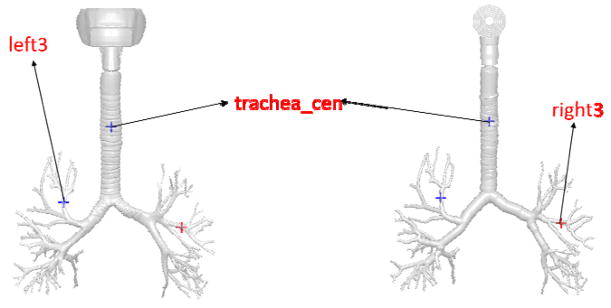
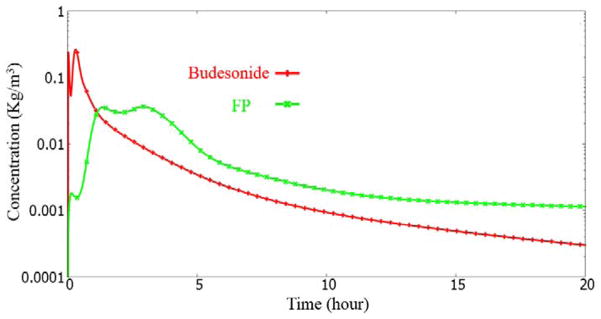
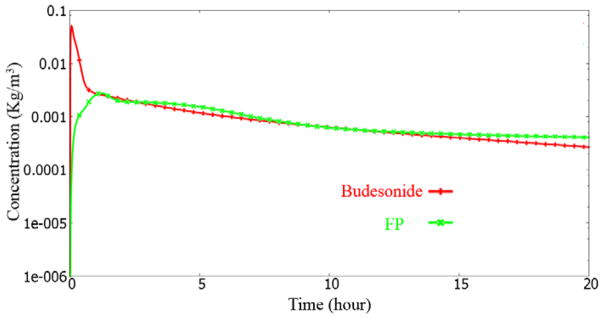
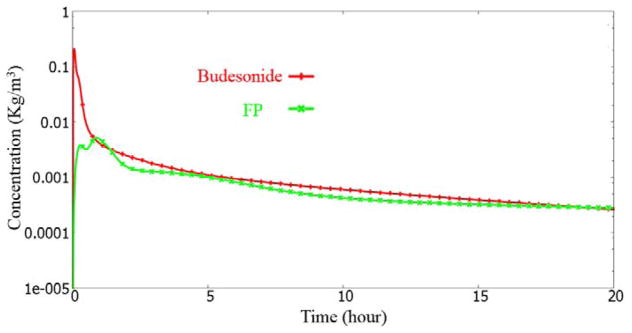
We will now compare the surface lining liquid dissolved drug concentration time histories at selected monitor points. Figure 16 shows the location of the three monitor points. Figure 17, Figure 18, Figure 19 shows the surface lining liquid dissolved drug concentration time histories for Budesonide and the FP drug. The main observations are as follows:
Figure 16.
Location of the three monitor points in the CFD mesh and the Q3D mesh.
Figure 17.
Surface lining liquid dissolved drug concentration history at the “trachea_cen” monitor point.
Figure 18.
Surface lining liquid dissolved drug concentration history at the “right3” monitor point.
Figure 19.
Surface lining liquid dissolved drug concentration history at the “left3” monitor point.
The initial rise for the FP case is noticeably smaller than the Budesonide case. This is due to the poor solubility of the FP drug.
In the “trachea_center” monitor point case, we see a drop and rise phenomenon (at 1–2 hour time). This is consistent with the discussion earlier. The dip and rise is almost non-existent in the Budesonide case, due to its rapid solubility. The initial dip is due to the transport of the drug upstream by the mucosal clearance. The subsequent rise is from the drug entering the trachea from down the lung.
The dip and rise is also seen to a mild degree for the left3 and right3 monitor points, for the FP drug simulation. Unlike the trachea_center monitor point case, the left3 and the right3 locations do not have sufficient mass deposited downstream to it. Hence, the mass entering is also lower. Thus the dip and rise is very mild.
Hence, based on the above pictorial and quantitative comparisons, the multiscale solution is better than the compartmental solution even in this extreme case (i.e., the FP drug case, wherein the solubility is very low).
6. Conclusions
In this research study, the authors have developed and implemented a Q3D-compartment multiscale combination to model the pulmonary drug absorption, transport, and retention. An annular Q3D model was developed to mimic the different lung layers. The lung absorption compartment model of Yu was adapted to this multiscale format. The lung is modeled in the Q3D format till airway #8. The remainder of the lung and the systemic circulation and elimination is modeled using compartments.
Relevant physics including the mucosal clearance model [13], the CAT model for the absorption from the GUT section [24], the CFD and drug-particle transport models of Kannan et al [17] and Tian et al [29] and were used for the deposition process, the models of Rodgers et al [26,27] to obtain the partition coefficients in the different organs) and a whole body PBPK model was implemented to solve the local and global absorption, transport, and retention processes.
Two extreme OIDPs were used to showcase the strength of this Q3D-compartment multiscale combination: (i) the relatively fast dissolving Budesonide drug and the (ii) poorly soluble (and poorly bio-available) FP drug. In both the cases, the individual comparisons, including the shape, slope and the area under the curve for the vein concentration were carried out between the compartmental and the multiscale model. The multiscale model was noticeably closer to the experimental readings. In addition, some of the sudden changes in the concentration curve (for instance the flattening during a time interval) could be explained by the multiscale model. Thus, this multiscale model can not only accurately predict the overall readings, but can also account for the local physics.
Future research will involve using this approach to (i) obtain the PK response for asthmatic subjects (both mild and severe asthmatics) and (ii) obtain the PK response, in the context of combination drug delivery (i.e., a combination of drugs provided, either concurrently or in intervals).
Acknowledgments
The authors gratefully acknowledge the funding support from FDA (Grant 1U01FD005214-03) toward this research; in addition to the feedback and guidance of FDA-CDER team.
The authors gratefully acknowledge the funding support from the NIH (Grant 1R43GM108380-01) toward this research.
Footnotes
7. AUTHOR DISCLOSURE
Views expressed here do not necessarily reflect the official policies of the Health and Human Services (HHS); nor does any mention of trade names, commercial practices or organizations imply endorsement by the United States Government.
8. CONFLICT OF INTEREST
CFDRC is interested in developing respiratory products based on this research.
9. DATA ACCESSIBILITY
The parameters, used for the Budesonide and the FP drug cases will be provided.
References
- 1.Alzahrany M, Banerjee A, Salzman G. The role of coupled resistance–compliance in upper tracheobronchial airways under high-frequency oscillatory ventilation. Medical Engineering & Physics. 2014;36(12):1593–1604. doi: 10.1016/j.medengphy.2014.08.012. [DOI] [PubMed] [Google Scholar]
- 2.Brand P, Friemel I, Meyer T, Schulz H, Heyder J, Häubetainger KP. Total deposition of therapeutic particles during spontaneous and controlled inhalations. Journal of Pharmaceutical Sciences. 2000;89:724–731. doi: 10.1002/(SICI)1520-6017(200006)89:6<724::AID-JPS3>3.0.CO;2-B. [DOI] [PubMed] [Google Scholar]
- 3.Briley W, McDonald H. Three-dimensional viscous flows with large secondary velocity. Journal of fluid mechanics. 1984;144:47–77. [Google Scholar]
- 4.Cabal A, Jajamovich G, Mehta K, Guo P, Przekwas AJ. In-Silico Lung Modeling Platform for Inhaled Drug Delivery. Drug Delivery to the Lungs Conference (DDL); 7th Dec – 9th Dec 2016; Edinburgh. [Google Scholar]
- 5.Choi J, Xia G, Tawhai MH, Hoffman EA, Lin CL. Numerical study of high-frequency oscillatory air flow and convective mixing in a CT-based human airway model. doi: 10.1007/s10439-010-0110-7. [DOI] [PMC free article] [PubMed] [Google Scholar]
- 6.Ann Biomed Eng. 2010 Dec;38(12):3550–71. doi: 10.1007/s10439-010-0110-7. Epub 2010 Jul 8. [DOI] [PMC free article] [PubMed] [Google Scholar]
- 7.Cuddihy RG, Fisher GL, Phalen RF. Deposition, Retention and Dosimetry of inhaled radioactive substances. National Council on Radiation Protection and Measurements. 1997;2081:4–3095. [Google Scholar]
- 8.Dalby C, Polanowski T, Larsson T, Borgström L, Edsbäcker A, Harrison TW. The bioavailability and airway clearance of the steroid component of budesonide/formoterol and salmeterol/fluticasone after inhaled administration in patients with COPD and healthy subjects: a randomized controlled trial. Respiratory Research. 2009;10:104. doi: 10.1186/1465-9921-10-104. [DOI] [PMC free article] [PubMed] [Google Scholar]
- 9.Derendorf H, Nave R, Drollmann A, Cerasoli F, Wurst W. Relevance of pharmacokinetics and pharmacodynamics of inhaled corticosteroids to asthma. European Respiratory Journal. 2006;28:1042–1050. doi: 10.1183/09031936.00074905. [DOI] [PubMed] [Google Scholar]
- 10.Edwards DA, Hanes J, Caponetti G, Hrkach J, Ben-Jebria A, Eskew ML, et al. Large Porous Particles for Pulmonary Drug Delivery. Science. 1997;276:1868–1872. doi: 10.1126/science.276.5320.1868. [DOI] [PubMed] [Google Scholar]
- 11.Groneberg D, Witt C, Wagner U, Chung K, Fischer A. Fundamentals of pulmonary drug delivery. Respiratory medicine. 2003;97:382–7. doi: 10.1053/rmed.2002.1457. [DOI] [PubMed] [Google Scholar]
- 12.Harrison TW, Tattersfield AE. Plasma concentrations of fluticasone propionate and budesonide following inhalation from dry powder inhalers by healthy and asthmatic subjects. Thorax. 2003 Mar;58(3):258–60. doi: 10.1136/thorax.58.3.258. [DOI] [PMC free article] [PubMed] [Google Scholar]
- 13.Hoffman W, Asgharian B. The Effect of Lung Structure on Mucociliary Clearance and Particle Retention in Human and Rat Lungs. Toxicological Science. 2003;73:448–456. doi: 10.1093/toxsci/kfg075. [DOI] [PubMed] [Google Scholar]
- 14.Kannan R, Harrand V, Lee M, Przekwas AJ. Highly scalable computational algorithms on emerging parallel machine multicore architectures: development and implementation in CFD context. International Journal for Numerical Methods in Fluids. doi: 10.1002/fld.3827. [DOI] [Google Scholar]
- 15.Kannan R, Harrand V, Tan XG, Yang HQ, Przekwas AJ. Highly scalable computational algorithms on emerging parallel machine multicore architectures II: Development and implementation in the CSD and FSI contexts. Journal of Parallel and Distributed Computing. 2014 Sep;74(9):2808–2817. [Google Scholar]
- 16.Ravishekar Kannan, Guo P, Przekwas AJ. Particle transport in the human respiratory tract: formulation of a nodal inverse distance weighted Euler-Lagrangian transport and implementation of the Wind-Kessel algorithm for an oral delivery. International Journal for Numerical Methods in Biomedical Engineering, International Journal for Numerical Methods in Biomedical Engineering. doi: 10.1002/cnm.2746. [DOI] [PubMed] [Google Scholar]
- 17.Ravishekar Kannan, Przekwas AJ, Singh N, Delvadia R, Tian G, Walenga R. Pharmaceutical aerosols deposition patterns from a Dry Powder Inhaler: Euler Lagrangian prediction and validation. Medical Engineering and Physics. doi: 10.1016/j.medengphy.2016.11.007. DOI: http://dx.doi.org/10.1016/j.medengphy.2016.11.007. [DOI] [PubMed]
- 18.Ravishekar Kannan, Chen ZJ, Singh N, Przekwas AJ, Delvadia R, Tian G, Walenga R. A quasi-3D wire approach to model pulmonary airflow in human airways. International Journal for Numerical Methods in Biomedical Engineering. doi: 10.1002/cnm.2838. [DOI] [PubMed] [Google Scholar]
- 19.Kleinstreuer C, Zhang Z. Airflow and Particle Transport in the Human Respiratory System. Annual Review of Fluid Mechanics. 2010;42:301–334. [Google Scholar]
- 20.Kolanjiyil AV, Kleinstreuer C. Nanoparticle mass transfer from lung airways to systemic regions--Part I: Whole-lung aerosol dynamics. J Biomech Eng. 2013 Dec;135(12):121003. doi: 10.1115/1.4025332. [DOI] [PubMed] [Google Scholar]
- 21.Labiris NR, Dolovich MB. Pulmonary drug delivery. Part I: Physiological factors affecting therapeutic effectiveness of aerosolized medications. British Journal of Clinical Pharmacology. 2003;56:588–599. doi: 10.1046/j.1365-2125.2003.01892.x. [DOI] [PMC free article] [PubMed] [Google Scholar]
- 22.Lähelmä S, Kirjavainen M, Kela M, Herttuainen J, Vahteristo M, Silvasti M, Ranki-Pesonen M. Equivalent lung deposition of budesonide in vivo: a comparison of dry powder inhalers using a pharmacokinetic method. Br J Clin Pharmacol. 2005 Feb;59(2):167–73. doi: 10.1111/j.1365-2125.2004.02238.x. [DOI] [PMC free article] [PubMed] [Google Scholar]
- 23.Mortimer KJ, Tattersfield AE, Tang Y, Wu K, Lewis S, Hochhaus G, Harrison TW. Plasma concentrations of fluticasone propionate and budesonide following inhalation: effect of induced bronchoconstriction. Br J Clin Pharmacol. 2007 Oct;64(4):439–444. doi: 10.1111/j.1365-2125.2007.02856.x. [DOI] [PMC free article] [PubMed] [Google Scholar]
- 24.Paixão P, Gouveia LF, Morais JAG. Prediction of the human oral bioavailability by using in vitro and in silico drug related parameters in a physiologically based absorption model. International Journal of Pharmaceutics. 2012;429:84–08. doi: 10.1016/j.ijpharm.2012.03.019. [DOI] [PubMed] [Google Scholar]
- 25.Raaska K, Niemi M, Neuvonen M, Neuvonen PJ, Kivistö KT. Plasma concentrations of inhaled budesonide and its effects on plasma cortisol are increased by the cytochrome P4503A4 inhibitor itraconazole. Clin Pharmacol Ther. 2002 Oct;72(4):362–9. doi: 10.1067/mcp.2002.127397. [DOI] [PubMed] [Google Scholar]
- 26.Rodgers T, Rowland M. Physiologically based pharmacokinetic modelling 2: predicting the tissue distribution of acids, very weak bases, neutrals and zwitterions. J Pharm Sci. 2006;95:1238–57. doi: 10.1002/jps.20502. [DOI] [PubMed] [Google Scholar]
- 27.Rodgers T, Leahy D, Rowland M. Physiologically based pharmacokinetic modeling 1: predicting the tissue distribution of moderate-to-strong bases. J Pharm Sci. 2005;94:1259–76. doi: 10.1002/jps.20322. [DOI] [PubMed] [Google Scholar]
- 28.Sung JC, Pulliam B, Edwards D. Nanoparticles for drug delivery to the lungs. Trends in biotechnology. 2007;25:563–70. doi: 10.1016/j.tibtech.2007.09.005. [DOI] [PubMed] [Google Scholar]
- 29.Tian G, Hindle M, Lee S, Longest P. Validating CFD Predictions of Pharmaceutical Aerosol Deposition with In Vivo Data. Pharm Res. 2015;32:3170–3187. doi: 10.1007/s11095-015-1695-1. [DOI] [PMC free article] [PubMed] [Google Scholar]
- 30.Thorsson L, Edsbäcker S, Kallen A, Lofdahl CG. Pharmacokinetics and systemic activity of fluticasone via Diskus and pMDI, and of budesonide via Turbuhaler. Br J Clin Pharmacol. 2001;52:529–538. doi: 10.1046/j.0306-5251.2001.01493.x. [DOI] [PMC free article] [PubMed] [Google Scholar]
- 31.Thorsson L, Edsbäcker S, Conradson TB. Lung deposition of budesonide from turbohaler is twice that from a pressurized metered-dose inhaler. Eur Respri J. 1994;7:1839–1844. doi: 10.1183/09031936.94.07101839. [DOI] [PubMed] [Google Scholar]
- 32.Vutikullird AB, Gillespie M, Song S, Steinfeld J. Pharmacokinetics Safety and Tolerability of a New Fluticasone Propionate Multidose Dry Powder Inhaler Compared With Fluticasone Propionate Diskus(®) in Healthy Adults. J Aerosol Med Pulm Drug Deliv. 2016 Apr;29(2):207–14. doi: 10.1089/jamp.2015.1226. Epub 2015 Dec 1. [DOI] [PubMed] [Google Scholar]
- 33.Yeh HC, Schum GM. Models of Human Lung Airways and Their Application to Inhaled Particle Deposition. Bulletin of Mathematical Biology. 1980;42:461–480. doi: 10.1007/BF02460796. [DOI] [PubMed] [Google Scholar]
- 34.Weibel E. Design of Airways and Blood Vessels Considered as Branching Trees. The Lung: Scientific Foundations. 1991;1:711–720. [Google Scholar]
- 35.Annals of the ICRP. Vol. 24. Pergamon; 1994. ICRP publication 66, Human Respiratory tract model for radiological protection. [PubMed] [Google Scholar]
- 36.NCRP Report, Deposition, Retention and Dosimetry of inhaled radioactive substances. Vol. 2081. National Council on Radiation Protection and Measurements; 791 0 Woodmont Avenue I Bethesda, MD: 1997. pp. 4–3095. [Google Scholar]
- 37.Yin Y, Choi J, Hoffman EA, Tawhai MH, Lin C-L. Simulation of pulmonary air flow with a subject-specific boundary condition. J Biomech. 2010;43:2159–63. doi: 10.1016/j.jbiomech.2010.03.048. [DOI] [PMC free article] [PubMed] [Google Scholar]
- 38.Yu J, Rosania GR. Cell-based multiscale computational modeling of small molecule absorption and retention in the lungs. Pharm Res. 2010 Mar;27(3):457–467. doi: 10.1007/s11095-009-0034-9. [DOI] [PMC free article] [PubMed] [Google Scholar]
- 39. [last accessed on April 20, 2017]; https://www.gsksource.com/pharma/content/dam/GlaxoSmithKline/US/en/Prescribing_Information/Flovent_Diskus/pdf/FLOVENT-DISKUS-PI-PIL-IFU-COMBINED.PDF.
- 40. [last accessed on April 20, 2017]; https://www.drugbank.ca/drugs/DB00588.
- 41. [last accessed on April 20, 2017]; http://www.chemsrc.com/en/cas/51333-22-3_754095.html.
- 42. [last accessed on April 20, 2017]; http://www.chemicalbook.com/ProductMSDSDetailCB1252206_EN.htm.


