Abstract
Purpose
We seek to investigate an optimization‐based one‐step method for image reconstruction that explicitly compensates for nonlinear spectral response (i.e., the beam‐hardening effect) in dual‐energy CT, to investigate the feasibility of the one‐step method for enabling two dual‐energy partial‐angular‐scan configurations, referred to as the short‐ and half‐scan configurations, on standard CT scanners without involving additional hardware, and to investigate the potential of the short‐ and half‐scan configurations in reducing imaging dose and scan time in a single‐kVp‐switch full‐scan configuration in which two full rotations are made for collection of dual‐energy data.
Methods
We use the one‐step method to reconstruct images directly from dual‐energy data through solving a nonconvex optimization program that specifies the images to be reconstructed in dual‐energy CT. Dual‐energy full‐scan data are generated from numerical phantoms and collected from physical phantoms with the standard single‐kVp‐switch full‐scan configuration, whereas dual‐energy short‐ and half‐scan data are extracted from the corresponding full‐scan data. Besides visual inspection and profile‐plot comparison, the reconstructed images are analyzed also in quantitative studies based upon tasks of linear‐attenuation‐coefficient and material‐concentration estimation and of material differentiation.
Results
Following the performance of a computer‐simulation study to verify that the one‐step method can reconstruct numerically accurately basis and monochromatic images of numerical phantoms, we reconstruct basis and monochromatic images by using the one‐step method from real data of physical phantoms collected with the full‐, short‐, and half‐scan configurations. Subjective inspection based upon visualization and profile‐plot comparison reveals that monochromatic images, which are used often in practical applications, reconstructed from the full‐, short‐, and half‐scan data are largely visually comparable except for some differences in texture details. Moreover, quantitative studies based upon tasks of linear‐attenuation‐coefficient and material‐concentration estimation and of material differentiation indicate that the short‐ and half‐scan configurations yield results in close agreement with the ground‐truth information and that of the full‐scan configuration.
Conclusions
The one‐step method considered can compensate effectively for the nonlinear spectral response in full‐ and partial‐angular‐scan dual‐energy CT. It can be exploited for enabling partial‐angular‐scan configurations on standard CT scanner without involving additional hardware. Visual inspection and quantitative studies reveal that, with the one‐step method, partial‐angular‐scan configurations considered can perform at a level comparable to that of the full‐scan configuration, thus suggesting the potential of the two partial‐angular‐scan configurations in reducing imaging dose and scan time in the standard single‐kVp‐switch full‐scan CT in which two full rotations are performed. The work also yields insights into the investigation and design of other nonstandard scan configurations of potential practical significance in dual‐energy CT.
Keywords: algorithm enabling, dual‐energy CT, reconstruction methods
1. Introduction
There is renewed interest in research on dual‐energy CT because it is believed to possess a potentially high degree of utility for various clinical applications.1, 2, 3, 4 In CT imaging the X‐ray source spectrum and detector response are generally polychromatic, and in dual‐energy CT this information can be exploited for beam‐hardening correction and/or for accurate material estimation and differentiation. In the work, for convenience, the product of the incident X‐ray source spectrum and detector response is referred to simply as the X‐ray spectral response. The explicit consideration of an X‐ray spectral response in dual‐energy CT engenders a nonlinear data model for which image‐reconstruction methods differing than those for a linear data model in conventional CT are needed.
Methods for addressing the nonlinear spectral response (i.e., the beam‐hardening effect) in dual‐energy CT can be divided roughly into two classes. In the first class, there are two types of methods: type‐1 methods first correct for the effect of the nonlinear spectral response in the data and then reconstruct image from the corrected data,5, 6, 7, 8, 9 whereas type‐2 methods first perform image reconstruction directly from the data and then compensate for the effect of the nonlinear spectral response in the reconstructed image.10, 11, 12 Therefore, the first class of methods includes two major steps in the order of either correction and reconstruction or reconstruction and correction. In general, the methods in the first class perform the reconstruction step based upon a linear data model. In the second class, methods, which are referred to as one‐step methods, are designed for image reconstruction through directly solving the nonlinear data model in dual‐energy CT.13, 14, 15, 16, 17, 18, 19, 20, 21
In this work, we investigate a one‐step method22 for image reconstruction and for enabling partial‐angular‐scan configurations in dual‐energy CT. In the one‐step method considered, the problem of image reconstruction is formulated as a nonconvex optimization program, and an algorithm, modified from the adaptive steepest‐descend (ASD) and projection‐onto‐the‐convex‐set (POCS) algorithm, is used for image reconstruction through numerically solving the nonconvex optimization program. An emphasis of the work is to investigate the feasibility of the one‐step method for enabling dual‐energy partial‐angular‐scan configurations on standard CT scanners without involving additional hardware. We focus on studying, in addition to a standard, dual‐energy full‐scan configuration, two specific dual‐energy partial‐angular‐scan configurations enabled, referred to simply as the short‐scan and half‐scan configurations, by using computer‐simulated data of numerical phantoms and real data of physical phantoms. Besides visual inspection of reconstructed images, quantitative studies are carried out on the full‐scan and partial‐angular‐scan configurations considered in tasks of linear‐attenuation‐coefficient and material‐concentration estimation and of material differentiation.
We describe in Section 2 the one‐step method, which consists of the optimization program and algorithm for image reconstruction from dual‐energy data, and summarize in Section 3 the study design and materials used in the work. Results from dual‐energy data of numerical and physical phantoms acquired with the scan configurations considered are presented in Sections 4 and 5, respectively. Discussions are given in Section 6, followed by conclusions in Section 7.
2. Materials and methods
2.A. Formulation of the reconstruction problem
In the section, we first describe the data model in dual‐energy imaging with which the reconstruction problem is formulated as a nonconvex (NC) optimization program. Because there is no mathematically exact solver currently for achieving the globally optimal solution of the NC optimization program, we use a heuristic algorithm22 for reconstructing basis and monochromatic images from dual‐energy data collected with full‐, short‐, and half‐scan configurations through numerically solving the program.
2.A.1. Basis and monochromatic images
We consider discrete image arrays in the work and denote a discrete image in a vector form of size I, where I is the total number of voxels of the image array, and entry i in an image vector is the image value within voxel i, where i ∈ {0,1,…,I−1}. Also, we refer to the product of the incident X‐ray beam spectrum and the detector energy response as the X‐ray spectrum, and express it as a vector of size M in which each entry denotes the spectrum value with energy bin m, where m ∈ {1,2,…,M}. In dual‐energy CT imaging, one seeks to determine the X‐ray linear‐attenuation coefficient distribution, which is a two‐variable function of X‐ray energy and spatial coordinates. Again, for a given energy m, we express the linear‐attenuation coefficient distribution as vector of size I in which each entry indicates the value of the linear‐attenuation coefficient at voxel i for energy m. In an attempt to avoid solving directly for a two‐variable function,5, 9 we re‐express as
| (1) |
where
| (2) |
vectors and denote basis images of size I, and the decomposition coefficients, and the decomposition error. When different sets of decomposition coefficients are considered, one obtains different decompositions of the linear attenuation coefficients, thus different basis images and decomposition errors. We refer to as the monochromatic image at energy m. In this work, we use the water and bone mass‐attenuation coefficients, which are available from the NIST database,23 as the decomposition coefficients, and thus refer to the decomposition in Eq. (2) as a material‐based decomposition. Not considering the decomposition error from insufficient bases, the determination of is simplified to determining basis images and , which are independent of energy m. Once the basis images are determined, one can use Eq. (2) to obtain the monochromatic image at energy m, which is used then as an approximation of the linear‐attenuation coefficients of interest.
2.A.2. Data model for dual‐energy imaging
In dual‐energy CT imaging, measurement is made with spectrum s, for each ray connecting a detector bin and the X‐ray source at a given source position. We denote the total number of rays measured as , which is the product of the number of rays measured at a source position and the number of source positions for a given X‐ray spectrum s. Considering a two‐basis decomposition model in Eq. (2), one can readily express the data model for a ray measurement with spectrum s as
| (3) |
where is a ray index for either low (s=1) or high (s=2) kVp scan, denotes the model data for the jth ray in scan s, the ray‐dependent, normalized X‐ray spectrum, satisfying , at energy m for the jth ray in scan s, and the intersection length of the jth ray in scan s with the ith voxel. Clearly, the data model is a nonlinear function of basis images and .
The data model in Eq. (3) can be re‐written as
| (4) |
where
| (5) |
| (6) |
is an energy‐independent term, taken as the spectrum‐weighted average of over energy m, remains energy dependent,9, 24 and k=1 and 2 indexes the basis material. Note that is a linear function of basis images and , while contributes to the nonlinearity of the data model.
For spectrum s, we form data vector of size , with elements , where . Similarly, we can form additional data vectors and , for s=1 and 2, in the same fashion as , with elements and given in Eqs. (5) and (6), respectively. Also, let denote the discrete X‐ray transform matrix of dimension with as its element for spectrum s, and a diagonal matrix of size with as its diagonal element. Subsequently, the data model in Eq. (4) for an individual ray can be grouped into a matrix form for all of the rays from the low (s=1) and high (s=2) kVp scans as
| (7) |
where
| (8) |
2.A.3. Nonconvex (NC) optimization program
For discussion convenience, aggregated vectors and are formed, where symbol ⊤ indicates a transpose operation. Letting vectors and of sizes and denote data actually measured with spectra s=1 and 2, we form a measured data vector, , in an aggregate form. Using the aggregated data vectors, we then formulate the basis images as a solution to the constrained optimization program designed as
| (9) |
where denotes the image total‐variation (TV), the ‐norm‐data‐fidelity function is given by
| (10) |
and ϵ>0 is the data constraint parameter that specifies the degree of data inconsistency. In addition, a non‐negativity constraint is imposed on the monochromatic image at energy m. It can be observed that the optimization program in Eq. (9) is nonconvex, because is a nonconvex function of and thus the data fidelity constraint forms a nonconvex set. The nonconvexity stems from the nonlinear term , as in its absence the data model becomes linear and so the data fidelity constraint convex.
2.B. Reconstruction algorithm
In an attempt to solve the optimization program in Eq. (9), we first use the steepest descend (SD) procedure to reduce the convex term of the basis‐image TV. On the other hand, there is no mathematically exact solver for achieving the global minimum of the NC‐data divergence . Instead, we consider a procedure for lowering the NC‐data divergence.22 It can be observed that, if can be estimated, the data divergence becomes convex and can thus be lowered by use of a procedure based upon the projection‐onto‐convex‐sets (POCS). This observation motivates the design of a procedure based upon the POCS updates for possibly lowering the nonconvex data divergence as22
| (11) |
| (12) |
where for spectrum s, the summation over m is from 1 to M, and is the jth row of matrix .
Unlike the conventional POCS procedure, the update in Eq. (11) attempts to address the nonconvexity of the data divergence by including the estimated NC term , and is thus referred to as the NC‐POCS procedure. Subsequently, an algorithm can be devised by combining SD and NC‐POCS procedures that adaptively lower image TV and data divergence, and it is referred to as the ASD‐NC‐POCS algorithm. In the work, algorithm parameter are identical to that in the conventional ASD‐POCS algorithm.25 Using the reconstructed basis image in Eq. (2), we can readily obtain monochromatic image at iteration n.
While it cannot be shown mathematically whether the ASD‐NC‐POCS algorithm can globally optimally solve the NC program in Eq. (9), necessary conditions for local optimality can be designed based upon two metrics, defined below as
| (13) |
which can be used for defining two mathematical necessary conditions for the convergence of the ASD‐NC‐POCS algorithm as
| (14) |
as iteration number n→∞. The first condition is based on the data fidelity constraint, making sure that the convergent solution is feasible, whereas the second is for the local optimality of the objective function. In practical reconstructions, where it is limited to computer precision, practical necessary conditions, guided by the mathematical conditions, are designed to check the convergence for the ASD‐NC‐POCS algorithm. Such conditions are to be discussed separately in the simulation and real‐data studies below, and are referred to in short as practical convergence conditions, although it is important to note that they are just numerical necessary conditions.
3. Study design and materials
3.A. Scanning configurations
Throughout the work, we refer to a scan configuration in which each of the two sets of dual‐energy data are collected over 2π as a full‐scan configuration for dual‐energy CT. In addition, we refer to a scan configuration as a partial‐angular‐scan configuration in which each of the two dual‐energy datasets is acquired for an object only over an angular range considerably less than 2π. Because the reduced angular range is less than 2π, a partial‐angular‐scan configuration can be exploited for possibly reducing imaging time and dose of a full‐scan configuration. Most importantly, a partial‐angular‐scan configuration can readily be realized on standard CT scanners without additional hardware simply by use of the standard single‐kVp‐switch technique.
We use three parameters, , , and , to specify a partial‐angular‐scan configuration, where and denote the starting and ending angles of the X‐ray tube, and the angle at which the X‐ray tube switches its kVp, thus collecting two sets of dual‐energy data over angular ranges and . In a full‐scan configuration, , whereas in a partial‐angular‐scan configuration, and . In this work, two partial‐angular‐scan configurations are investigated for dual‐energy CT of potential practical significance. The first scan configuration of interest is referred to as the short‐scan configuration, as shown in Fig. 1 (left), in which the tube rotates a short‐scan range in one kVp, before switching to another kVp setting to rotate for another short‐scan range. Thus, two sets of dual‐energy data are acquired with , , and , where is the fan angle of the CT scanner. The second scan configuration is referred to as the half‐scan configuration, as show in Fig. 1 (middle), in which , , and . The X‐ray tube is switched from one kVp to another kVp at , and the angular range of each kVp scan covers one half of a full‐rotation scan.
Figure 1.

Short‐scan (left) and half‐scan (middle) configurations, where denotes the fan angle of CT scanner. Dual‐energy datasets are collected over the angular ranges with high (thick) and low (thin) kVp X‐rays. The dashed circle indicates the FOV of the scanner, in which the imaged object (shaded elliptical region) is enclosed. Right: normalized high (thick) and low (thin) kVp spectra used in the studies. [Color figure can be viewed at wileyonlinelibrary.com]
3.B. Data acquisition
In the work, a clinical CT scanner was used in the circular/axial mode to acquire dual‐energy data with 80 and 135 kVp. The scanner has a detector array of 896 bins of size 1 mm, thus forming a FOV of 500 mm in diameter and fan angle of . Two physical phantoms are considered, as the standard GAMMEX DE‐472 dual‐energy CT phantom with calcium and iodine inserts,26 referred to as the DE‐472 phantom, and a head phantom with low contrast disks, referred to as the head phantom. The 80 and 135 kVp spectra, which are normalized products of the estimated incident X‐ray spectra and the energy response D(E)=E of energy‐integrating detectors, are shown in Fig. 1 (right). Note that both spectra are ray‐dependent, due to the presence of a bow‐tie filter in the CT scanner.
For each phantom, full‐scan data were first collected by use of the full‐scan configuration with each of 80 and 135 kVp spectra. Twenty repeated full scans were performed with high mA settings, 450 and 250 mA for 80 and 135 kVp respectively, and the averaged data were collected for yielding datasets with a low‐level of noise. Such averaged high‐dose full‐scan data can thus serve as benchmark references for visualization comparison and quantitative evaluation of reconstruction for the short‐ and half‐scan configurations considered.
We subsequently obtained the dual‐energy data for the short‐ and half‐scan configurations by extraction of the relevant portions from the averaged full‐scan datasets. Specifically, for the short‐scan configuration (, , ), 0‐to‐‐rotation data from the 80‐kVp scan and 230‐to‐‐rotation data from the 135‐kVp scan were extracted and joined together. Similarly, for the half‐scan configuration (, , ) 0‐to‐‐rotation data from 80 kVp and ‐to‐‐rotation data from 135 kVp were joined together to form the half‐scan data.
3.C. Ground‐truth and reference images
The ground‐truth image is available in a simulation study. As shown below, the ground‐truth images are used to calculate the image RMSE for checking convergence of the ASD‐NC‐POCS algorithm and, more importantly, for measuring the reconstruction accuracy in the simulation study.
In a real‐data study, there is no ground‐truth images available. Instead, we reconstruct reference images from full‐scan data for guiding and benchmarking the reconstructions of the one‐step method. Methods exist for image reconstruction from dual‐energy full‐scan data. When dual‐energy data for a ray are measured for both low and high kVp spectra, one of such methods first compensates for the nonlinear spectral response by decomposition of measured data into X‐ray transforms of individual basis images and then reconstructs basis images from the X‐ray transforms estimated.5, 6, 7, 8, 9 This method is adopted widely in dual‐energy CT imaging for medical and other applications.
In the work, we apply the data‐domain decomposition method9 in combination with the FBP algorithm with a hanning window to the dual‐energy full‐scan data to yield basis and monochromatic images. These images are referred to as reference images, which are used as guidance and benchmark for the study on the reconstructions obtained with the one‐step method from the full‐, short‐, and half‐scan data. Because the reference images are reconstructed from real data, they may understandably contain some artifacts due to data noise, imperfect spectra used, and other physical factors. The reference image is reconstructed on an I=512×512 array of square pixels of size 0.683 mm. Throughout the work, we perform the image reconstruction from full‐, short‐, and half‐scan data by using the array and pixel sizes identical to those in the reference image reconstruction. Also, the spectra in Fig. 1 (right) are used for all of the reconstructions performed in the work. As the ray overlapping condition needs to be satisfied for carrying out the data‐domain decomposition, the reference images are available only for full‐scan data, but not for the short‐ or half‐scan data.
4. Simulation study
4.A. Simulation‐study design
We first carry out simulation studies to verify the convergence of the ASD‐NC‐POCS algorithm and to benchmark the reconstruction accuracy in the best case scenario, in which data are consistent with the nonlinear data model in Eq. (3). In the simulation study, data were generated from ground‐truth‐basis images of water and bone using Eq. (3) with low and high kVp spectra shown in Fig. 1 (right), for the full‐, short‐, and half‐scan configurations. For computation efficiency, yet without loss of generality, the image array consists of I=128×128 2.732‐mm‐square pixels, the detector has 448 bins of size 1 mm with a fan angle of , and the full‐, short‐, and half‐scan datasets are collected at 300, 191, and 150 views, respectively, distributed evenly over 2π, , and π. The same pixel size, spectra, and identical matrices used for data generation were used in the reconstruction as well. Because consistent data were used in the simulation study, ε should be set to zero. Therefore, data fidelity term , instead of , is used to define the convergence condition in the simulation study. Furthermore, taking into account the practical considerations such as limited computer precision, was selected, and for the simulation study we design the practical convergence conditions as
| (15) |
In addition, we also computed the image RMSE between the reconstructed‐basis and ground‐truth‐basis images, defined as
| (16) |
and used it to monitor the distance between the reconstructed‐basis and ground‐truth‐basis images.
4.B. Simulation‐study results
We first investigate the convergence of the ASD‐NC‐POCS algorithm by plotting in Fig. 2 convergence metrics and as functions of iteration number n. It can be observed that the practical convergence conditions in Eq. (15) are met at iteration n∼1000. In addition, we also show in Fig. 2 global‐image RMSE , which reaches when the practical convergence conditions are satisfied, indicating that the converged basis images are numerically close to their ground‐truth‐basis images. Observations about the ASD‐NC‐POCS convergence similar to those in Fig. 2 can also be made for simulation studies from short‐ and half‐scan data, which are not shown for avoiding redundant figures. We further show in Fig. 3 that the convergent basis images from full‐, short‐, and half‐scan data are all visually identical to the ground‐truth images. With the basis images accurately reconstructed, accurate monochromatic images can readily be obtained by use of Eq. (2), which are not shown. These results provides a numerical verification of the convergence of the ASD‐NC‐PCOS algorithm and its reconstruction accuracy of basis and monochromatic images from simulated consistent data.
Figure 2.

Convergence metrics (a) and (b) , along with image RMSE (c) , as functions of iteration number n, calculated from the basis images reconstructed from full‐scan data in the simulation study. [Color figure can be viewed at wileyonlinelibrary.com]
Figure 3.
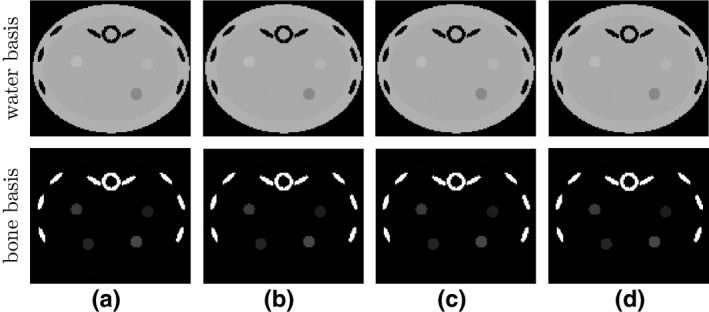
(a) Ground‐truth and reconstructed water‐basis (row 1) and bone‐basis (row 2) images from (b) full‐, (c) short‐, and (d) half‐scan data, with display windows of [0, 1.5].
5. Real‐data study
Following the simulation study, we apply the one‐step method to reconstructing basis and monochromatic images from real dual‐energy data of physical phantoms for the full‐, short‐, and half‐scan configurations, and compare the reconstructions with the corresponding reference images.
5.A. Real‐data‐study design
For both phantoms, the full‐scan data were collected at 1200 views uniformly distributed over 2π. Thus matrices and are identical and of dimensions and I=512×512. The short‐scan data contain 764 views from each of the low and high kVp dataset, distributed over two adjacent arcs spanning the short‐scan range. As a result, matrices and are different, but still of the same dimensions with and I=512×512. The half‐scan data contain 600 views from each of the low and high kVp dataset, distributed over half a rotation. The two different system matrices are of dimensions and I=512×512. We selected parameter ε for yielding monochromatic images visually comparable to the reference one while not blurring the air bubbles in the phantoms. As a result, we have selected ε= 24.9, 19.86, and 16.62 for the full‐, short‐, and half‐scan DE‐472 phantom data, respectively, and ε= 13.43, 8.65, and 9.07 for the full‐, short‐, and half‐scan head phantom data, respectively.
While the simulation studies employ a tight convergence criteria for verification of the ASD‐NC‐POCS algorithm's convergence, we loosen the criteria slightly for the real‐data studies to obtain practical convergence conditions as
| (17) |
Based upon the simulation study, we run about 1000 iterations and observe that the practical convergence conditions are satisfied in all cases, as the results below show. Furthermore, the study results as well as previous studies22 reveal that the above practical convergence conditions yield reconstructions visually and quantitatively resembling those obtained with tighter convergence conditions.
5.B. Reconstruction of DE‐472 phantom
A reconstruction from full‐scan data is used to first demonstrate that the practical convergence conditions in Eq. (17) can be met by the ASD‐NC‐POCS algorithm. Without loss of generality, the reconstruction is carried out with ε=24.90 for full‐scan data, and we display in Fig. 4 convergence metrics and as functions of iteration number n, which show that the practical convergence conditions are satisfied by the ASD‐NC‐POCS algorithm.
Figure 4.
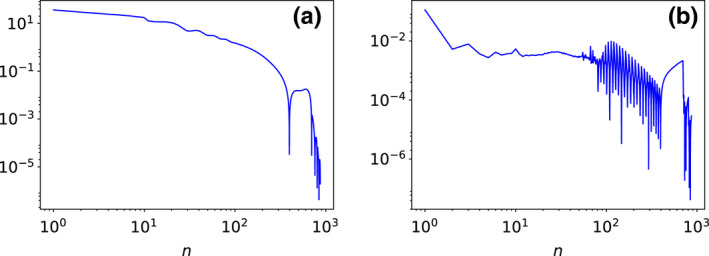
Convergence metrics (a) and (b) as functions of iteration number n, calculated from basis images reconstructed from the full‐scan data of the DE‐472 phantom. [Color figure can be viewed at wileyonlinelibrary.com]
We then show in Fig. 5 images of the DE‐472 phantom reconstructed from full‐, short‐, and half‐scan data, including water‐basis and bone‐basis images and monochromatic images at 50 and 120 keV obtained by a linear combination of the basis image reconstructed using Eq. (2) and then a linear transformation to HU values, along with the corresponding reference images in column (a). Separation of water and bone bases can be observed in the reference‐basis images. The uniform solid‐water background appears visible in the water‐basis image, while almost all contrast inserts are bright in the bone‐basis image. Similar separation of water and bone bases can also be observed from all three pairs of basis images reconstructed. While the water‐basis image from the short‐scan data seems to have lower contrast for the two inserts in the lower right corner, as compared to the other water‐basis images, its 50‐keV and 120‐keV monochromatic images show little contrast loss of the inserts. The contrast level in the basis images can be affected by numerous factors including data inconsistencies, reconstruction design, and parameter ε. In this case, parameter ε has been selected by matching monochromatic images reconstructed, instead of water‐basis images, with the reference monochromatic images in terms of subjective visualization. In addition, we apply a non‐negativity constraint in the optimization program in Eq. (9) to the monochromatic image, instead of the basis image, considering the fact that the former is used often in practical applications.
Figure 5.
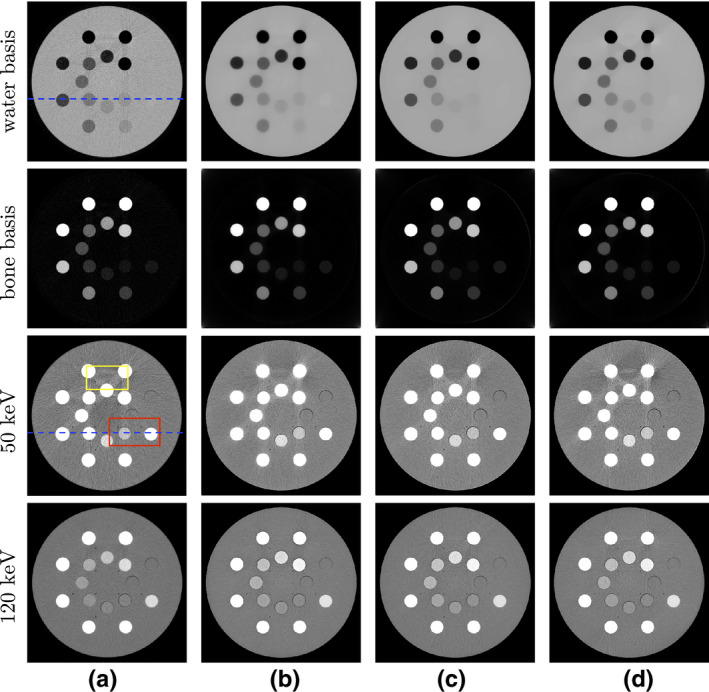
(a) Reference images and images reconstructed from (b) full‐, (c) short‐, and (d) half‐scan data of the DE‐472 phantom. From top to bottom: (row 1) water‐basis and (row 2) bone‐basis images, with display windows [0, 1.5], and monochromatic images at (row 3) 50‐keV and (row 4) 120‐keV, with display window [−200, 200] HU. Two ROIs enclosed by boxes in the reference 50‐keV monochromatic image (column (a), row 3) are selected for zoomed‐in view in Fig. 6, while the dashed lines in the water‐basis image (column (a), row 1) and in the reference 50‐keV monochromatic image (column (a), row 3) indicate where the profiles are plotted. [Color figure can be viewed at wileyonlinelibrary.com]
For the reference monochromatic images, the 50‐keV monochromatic image shows elevated contrast, compared to the 120‐keV monochromatic image, as expected. With a display window of [−200, 200] HU, slight banding artifacts at the top connecting two calcium inserts with the highest concentrations can be observed in the 50‐keV reference image. Such artifacts could be due to the decomposition error, inaccurate spectra used, nonlinear partial volume effect, and/or data noise. The artifacts seem reduced in the 120‐keV reference image. The monochromatic images reconstructed from full‐, short‐, and half‐scan data possess overall resemblance to their corresponding reference images, except for some texture differences. It should be noted that the contrast levels of the two inserts in the lower right corner in both monochromatic images from the short‐scan data appear visually similar to those in the corresponding reference images and in image of other scan configurations.
For revealing reconstruction details, we show in Fig. 6 the zoomed‐in views of the monochromatic images within two ROIs enclosed by the boxes in Fig. 5. The top ROI includes a region containing two calcium inserts with the highest concentrations and an iodine insert with the second highest concentration, while the bottom ROI is selected to include the calcium and iodine inserts with the lowest concentration levels and two air bubbles in the phantom. At 50 keV, the banding artifacts are discernible in the top ROIs across all four columns. Some vertical streaks, leaking from the inserts above, can also be observed in the bottom ROIs as well. At 120 keV, the artifacts are reduced, and the air bubbles in the bottom ROI appear sharp in the images reconstructed from full‐, short‐, and half‐scan data. Overall, these observations suggest that the monochromatic images reconstructed are visually comparable to their corresponding reference images, except for some differences in texture details.
Figure 6.
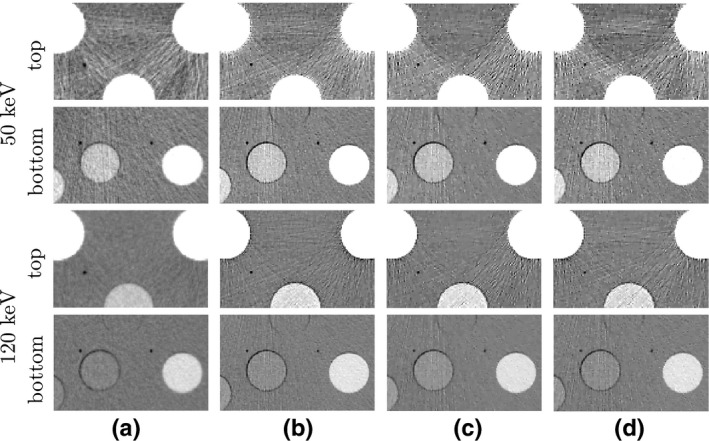
Zoomed‐in view of the monochromatic images within the two ROIs enclosed by the top and bottom boxes in the reference 50‐keV monochromatic image (column (a), row 3) of Fig. 5. The arrangement from left to right is identical to that in Fig. 5. Rows 1 & 2 and rows 3 & 4 show the 50‐keV and 120‐keV ROI images, respectively, within the top and bottom ROIs labeled with “top” (rows 1 & 3) and “bottom” (rows 2 & 4). Again, the display window is [−200, 200] HU.
In addition to the visual inspection above, we also compare the reconstructions in terms of their profile plots. We show in Figs. 7 and 8 profile plots of basis and monochromatic images, respectively, across the dashed lines indicated in water‐basis image and 50‐keV monochromatic image in Fig. 5, for different scan configurations, along with the corresponding reference images. The profile plots of basis images in Fig. 7 show slightly higher noise in both reference basis images, whereas the profile plots of monochromatic images in Fig. 8 show overall quantitative agreement among monochromatic images obtained from full‐, short‐, and half‐scan data.
Figure 7.
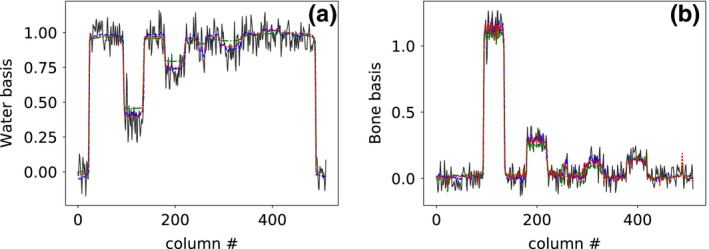
Profile plots of (a) water‐basis and (b) bone‐basis images across the dashed line indicated in water‐basis image (column (a), row 1) of Fig. 5 for reference basis image (solid) and basis images reconstructed from full‐ (dashed), short‐ (dashed‐dotted), and half‐scan (dotted) data, respectively. [Color figure can be viewed at wileyonlinelibrary.com]
Figure 8.
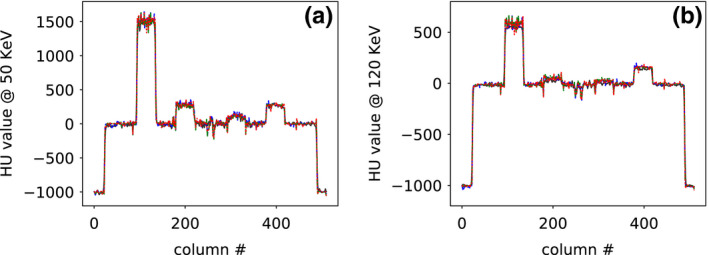
Profile plots of (a) 50‐keV and (b) 120‐keV monochromatic images across the dashed line indicated in 50‐keV monochromatic image (column (a), row 3) of Fig. 5 for reference monochromatic image (solid) and monochromatic images reconstructed from full‐ (dashed), short‐ (dashed‐dotted), and half‐scan (dotted) data, respectively. [Color figure can be viewed at wileyonlinelibrary.com]
5.C. Reconstruction of head phantom
Convergence plots similar to those for the reconstructions of DE‐472 phantom, as illustrated in Fig. 4, were obtained for the reconstructions of head phantom and are thus not shown here. In Figs. 9 and 10, we show reconstructed images from the head phantom and zoomed‐in views of the monochromatic images within the two ROIs enclosed by the top and bottom boxes depicted in the 50‐keV reference monochromatic image of Fig. 9. For the reference images shown in column (a) in Fig. 9, soft‐tissue and bone materials are separated into water‐ and bone‐basis images, respectively, and no conspicuous artifacts are visible. The 50‐keV monochromatic image shows disks of discernible contrast, and also displays some streaks inside the upper region enclosed by bones, which can be observed in the zoomed‐in views in row 1 of Fig. 10 for the 50‐keV monochromatic images within the top ROI. Such streaks may be caused by the residual beam hardening effect and/or the nonlinear partial volume effect. The 120‐keV monochromatic image and its corresponding zoomed‐in view of the top ROI show no such artifacts.
Figure 9.
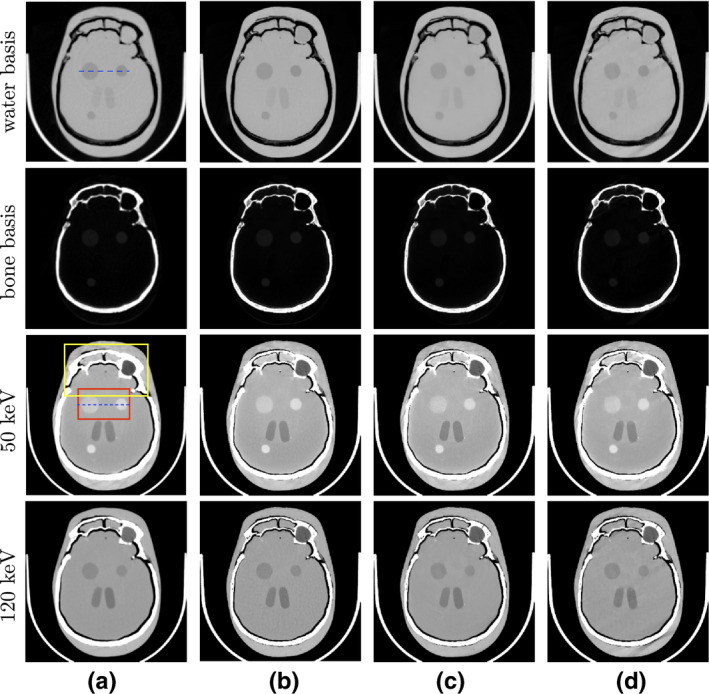
(a) Reference images and images reconstructed from (b) full‐, (c) short‐, and (d) half‐scan data of the head phantom. From top to bottom: (row 1) water‐basis and (row 2) bone‐basis images, with display windows [0, 1.5], and monochromatic images at (row 3) 50‐keV and (row 4) 120‐keV, with display window [−200, 200] HU. Two ROIs enclosed by boxes in the reference 50‐keV monochromatic image (column (a), row 3) are selected for zoomed‐in view in Fig. 10, while the dashed lines in the water‐basis image (column (a), row 1) and in the reference 50‐keV monochromatic image (column (a), row 3) indicate where the profiles are plotted. [Color figure can be viewed at wileyonlinelibrary.com]
Figure 10.
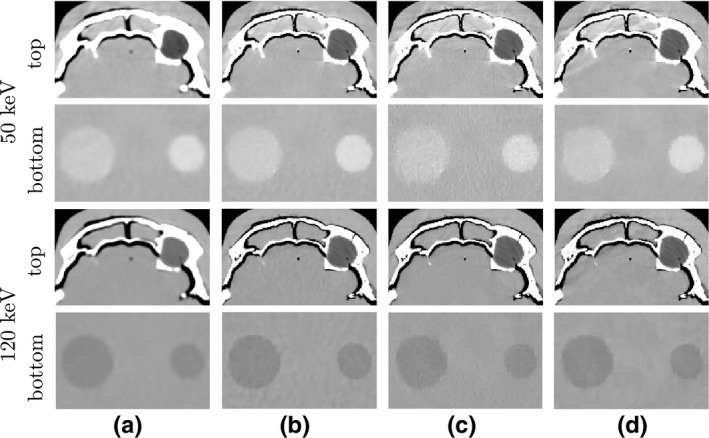
Zoomed‐in view of the monochromatic images within the two ROIs enclosed by the top and bottom boxes in the reference 50‐keV monochromatic image (column (a), row 3) of Fig. 9. The arrangement from left to right is identical to that in Fig. 9. Rows 1 & 2 and rows 3 & 4 show the 50‐keV and 120‐keV ROI images, respectively, within the top and bottom ROIs labeled with “top” (rows 1 & 3) and “bottom” (rows 2 & 4). Again, the display window is [−200, 200] HU.
The reconstructions from the full‐ and short‐scan data in columns (b) and (c) are visually comparable to their respective reference images, while the images from half‐scan data display some streaks of a certain direction, which are absent in the reference or full‐/short‐scan images. These streaks, typically around the bony regions, are associated with the sampling condition of the half‐scan configuration, and its directionality coincidences with the starting angle in the half‐scan configuration. Except for the streaks, the reconstructions, including the disks embedded in the soft‐tissue regions of the head phantom, from the half‐scan data appear to be visibly similar to the reference images and to the reconstructions from full‐ and short‐scan data, as the zoomed‐in views of the ROI images in Fig. 10 show.
We show in Figs. 11 and 12 profile plots of basis and monochromatic images across two of the contrast disks in the 50‐ and 120‐keV monochromatic images of the head phantom reconstructed from full‐, short‐, and half‐scan data. Similar to the results for the DE‐472 phantom, the profile plots indicate an overall quantitative agreement among the reconstructions, except for some difference in texture details, suggesting that the contrast level is retained for the short‐ and half‐scan configurations.
Figure 11.
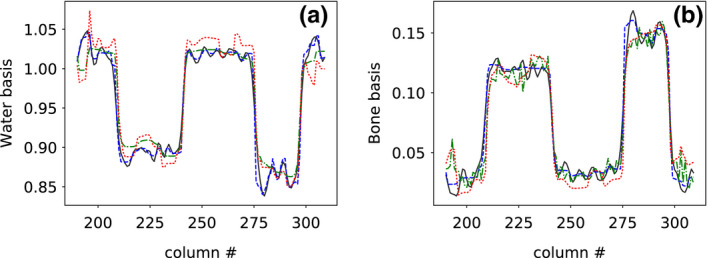
Profile plots of (a) water‐basis and (b) bone‐basis images across the dashed line indicated in water‐basis image (column (a), row 1) of Fig. 9 for reference basis image (solid) and basis images reconstructed from full‐ (dashed), short‐ (dashed‐dotted), and half‐scan (dotted) data, respectively. [Color figure can be viewed at wileyonlinelibrary.com]
Figure 12.
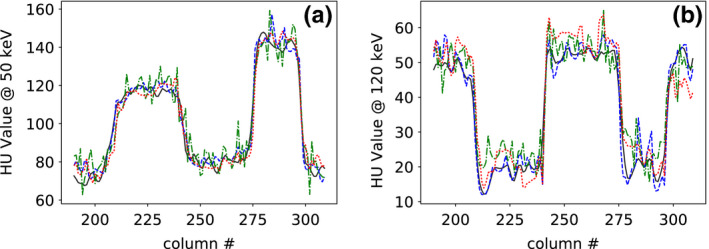
Profile plots of (a) 50‐keV and (b) 120‐keV monochromatic images across the dashed line indicated in 50‐keV monochromatic image (column (a), row 3) of Fig. 9 for reference monochromatic image (solid) and monochromatic images reconstructed from full‐ (dashed), short‐ (dashed‐dotted), and half‐scan (dotted) data, respectively. [Color figure can be viewed at wileyonlinelibrary.com]
5.D. Quantitative Study
In addition to visual inspection of the reconstructed images and profile plots, we carry out quantitative studies for tasks of potential interest in dual‐energy applications. The quantitative studies are performed for the DE‐472 phantom only, as ground‐truth information about the inserts and the background materials is available. First, from the reconstructed basis images, monochromatic images at different energy levels were formed using Eq. (2) and the linear‐attenuation coefficients for each insert at different energy levels were estimated and then compared with their ground‐truth values. Subsequently, the concentrations of the inserts were also estimated, assuming a linear relationship with the HU value pair at two different energy levels. Finally, a material‐differentiation task between calcium and iodine was carried out using the monochromatic images at 80 and 140 keV.
5.D.1. Estimation of linear‐attenuation coefficients
Using the reconstructed basis images, we form monochromatic images at multiple energy levels by using Eq. (2), and compare the linear‐attenuation coefficients within the calcium and iodine inserts in the DE‐472 phantom with the ground‐truth information provided by the phantom manufacturer and obtained by use of the XCOM program from NIST.27 Note that, in order to compare the linear‐attenuation coefficients in physical units (), the monochromatic images were obtained by a linear combination of the basis images using Eq. (2) only, without the HU‐conversion step. The values of the linear‐attenuation coefficient obtained from the monochromatic images for the full‐, short‐, and half‐scan configurations, formed at energy levels of 40, 60, 80, 100, 120, 140, and 160 keV, are shown, along with those obtained from the corresponding reference images, in Fig. 13 for the four inserts that are iodine and calcium with the highest and lowest concentrations. For comparison, the ground‐truth values from NIST data27 for the iodine and calcium inserts are plotted as solid curves. It can be observed that the estimated linear‐attenuation coefficients are in close agreement with their respective ground‐truth values.
Figure 13.
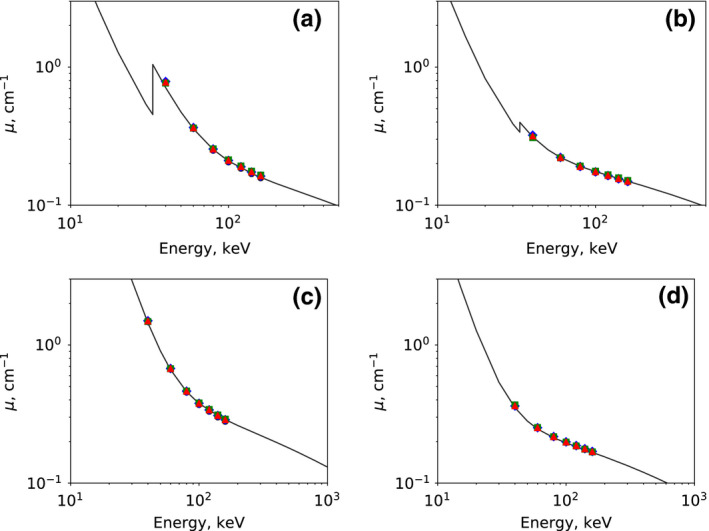
Linear‐attenuation coefficients as functions of energy plotted in a log‐log scale, for (a) the 20‐mg/ml and (b) the 2‐mg/ml iodine inserts and for (c) the 600‐mg/ml and (d) the 50‐mg/ml calcium inserts. The solid curves represent ground‐truth values calculated from NIST data,27 along with linear‐attenuation coefficient calculated from monochromatic images at 40, 60, 80, 100, 120, 140, and 160 keV reconstructed from full‐ ( ), short‐ (
 ), and half‐scan (
 ) data, as well as from the reference images (
 ). The vertical bars through the symbols indicate the standard deviations estimated within the ROI of each insert. [Color figure can be viewed at wileyonlinelibrary.com]
5.D.2. Estimation of material concentration
We have also carried out a study on the concentration estimation of the iodine and calcium inserts in the DE‐472 phantom from monochromatic images reconstructed from full‐, short‐, and half‐scan data. In Tables 1 and 2, we summarize the estimated concentrations and their associated standard deviations for each of the iodine and calcium inserts obtained from full‐, short‐, and half‐scan data, along with the corresponding ground‐truth values. The result is also displayed in Fig. 14, along with that obtained from the corresponding reference images, in which the vertical bars through each symbol for an estimated value denotes the corresponding standard deviation. It can be observed that data points line up well along the ‐degree line. The results in Tables 1 and 2 and in Fig. 14 indicate that accurate estimation of the iodine and calcium concentration can be obtained from the full‐ and partial‐angular‐scan data in dual‐energy CT by use of the one‐step method.
Table 1.
Iodine concentration ± its standard deviation estimated (mg/ml)
| Truth | 20 | 15 | 10 | 7.5 | 5 | 2.5 | 2 |
|---|---|---|---|---|---|---|---|
| Full | 20.23 ± 0.74 | 15.20 ± 0.90 | 10.04 ± 0.56 | 7.46 ± 0.64 | 4.89 ± 0.45 | 2.64 ± 0.44 | 2.08 ± 0.39 |
| Short | 19.39 ± 0.56 | 14.43 ± 0.94 | 9.35 ± 0.43 | 6.90 ± 0.62 | 4.37 ± 0.46 | 2.16 ± 0.33 | 1.54 ± 0.30 |
| Half | 19.92 ± 0.67 | 14.99 ± 0.987 | 9.89 ± 0.52 | 7.46 ± 0.61 | 4.80 ± 0.47 | 2.58 ± 0.36 | 1.93 ± 0.37 |
Table 2.
Calcium concentration ± its standard deviation estimated (mg/ml)
| Truth | 600 | 500 | 400 | 300 | 200 | 100 | 50 |
|---|---|---|---|---|---|---|---|
| Full | 611.04 ± 21.8 | 505.53 ± 15.38 | 400.16 ± 12.07 | 300.83 ± 12.39 | 202.64 ± 8.39 | 103.85 ± 6.27 | 54.16 ± 3.44 |
| Short | 605.21 ± 23.11 | 501.04 ± 13.57 | 397.39 ± 9.12 | 297.80 ± 15.06 | 199.08 ± 7.78 | 100.54 ± 7.17 | 56.13 ± 2.74 |
| Half | 610.38 ± 24.28 | 505.28 ± 15.23 | 401.18 ± 11.67 | 301.53 ± 13.92 | 202.45 ± 7.81 | 102.43 ± 8.22 | 54.52 ± 4.11 |
Figure 14.
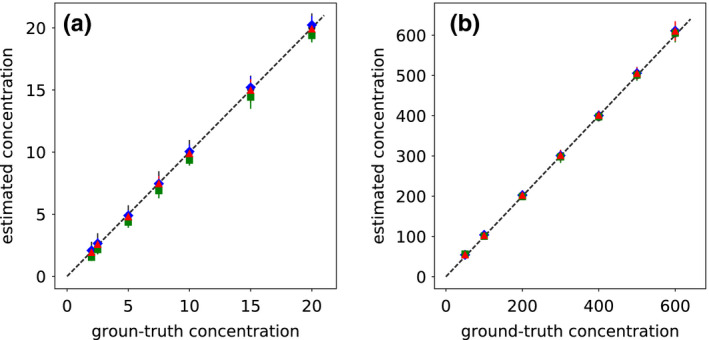
(a) Iodine and (b) calcium concentrations (in units of mg/ml) estimated from images reconstructed from full‐ ( ), short‐ (
 ), and half‐scan (
 ) data, as well as from the reference images (
 ), plotted against their ground‐truth concentrations. The vertical bars through the symbols indicate the standard deviations estimated within the ROI of each insert, and the dashed lines indicate lines. [Color figure can be viewed at wileyonlinelibrary.com]
5.D.3. Material differentiation
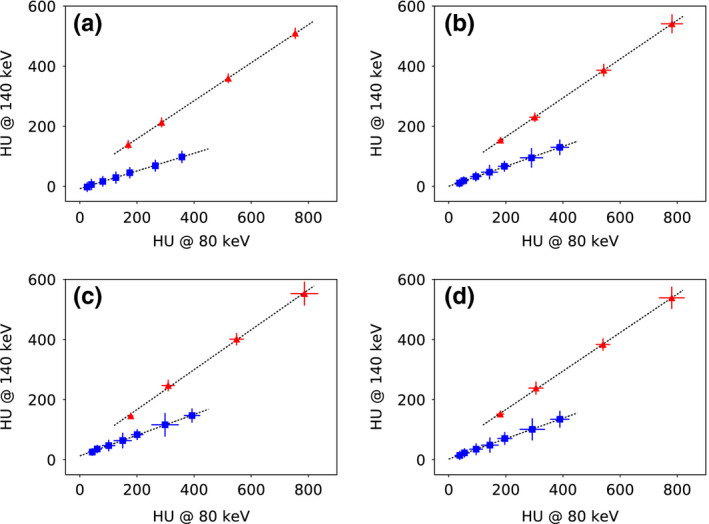
We further compare reconstructions in a material‐differentiation task of calcium and iodine. A potential problem in separating calcium from iodine using the standard thresholding‐based method is that there is an overlap of HU values between calcium and iodine in a single‐energy image.28 As shown in Fig. 5, some of the calcium inserts in the 120‐keV monochromatic image of the DE‐472 phantom are of a gray level comparable to that of some of the iodine inserts. Conversely, calcium and iodine can be better differentiated by their distinct spectral response, i.e., their mass‐attenuation coefficient as a function of energy. We compose monochromatic images at two different energy levels from the basis images reconstructed and use the HU value pair from the two monochromatic images at low and high energies to differentiate iodine from calcium. For each insert in the DE‐472 phantom, the mean pixel values within the insert are calculated based on 80‐ and 140‐keV monochromatic images, respectively. A scatter plot of the HU value pairs for each calcium and iodine inserts can thus be obtained, as displayed in Fig. 15, and each data point on the scatter plot indicates one calcium or iodine insert of its unique concentration level, along with the respective standard deviation estimated depicted by the vertical and horizontal bars through the symbols. It can be observed that data points from iodine and calcium inserts are aligned along two well separated straight lines, indicating a good performance of reconstructions in the material‐differentiation task of calcium and iodine for all scan configurations considered. For each scatter plot, linear regressions were performed for both iodine and calcium data, and there is about a 20‐degrees separation between the two fitted lines across all four scatter plots.
Figure 15.
Scatter plots of HU‐value pairs of each calcium ( ) and iodine (
 ) inserts in the DE‐472 phantom calculated by using the 80‐keV and 140‐keV monochromatic (a) reference images and reconstructions from (b) full‐, (c) short‐, and (d) half‐scan data. The vertical and horizontal bars through the symbols indicate the standard deviations estimated within the ROIs of each insert in the 80‐keV and 140‐keV monochromatic images, respectively. Data points of iodine and calcium inserts are distributed on two well‐separated straight dotted lines for all scan configurations. [Color figure can be viewed at wileyonlinelibrary.com]
5.E. Reconstructions at intermediate iterations
It is of practical interest to inspect images reconstructed at intermediate iterations, especially relative to the convergent reconstruction for gaining insights into the design of practically useful reconstruction procedures with only a few iterations required by typical practical applications. We have examined reconstructions at intermediate iterations and observed that reconstructions at early iterations can resemble visually the convergent reconstruction. More importantly, we have performed quantitative analyses on intermediate reconstructions. Without loss of generality, we show below quantitative assessment of intermediate reconstructions for the full‐scan data only, as similar results and observations can be obtained for the short‐ and half‐scan data.
5.E.1. Estimation of linear‐attenuation coefficients
We have performed a study on the estimation of linear‐attenuation coefficients by simply replacing the convergent monochromatic images in Section 5.D.1 with those formed from basis images reconstructed at intermediate iterations and then estimated linear‐attenuation coefficients at intermediate iterations. Without loss of generality, we display in Fig. 16 results from the iodine insert of 20 mg/ml and the calcium insert of 600‐mg/ml obtained from the full‐scan data at iterations n=30 and 300 (row 1 & 2). It can be observed that, in terms of the estimated accuracy of linear‐attenuation coefficients, results from iteration n=300 resemble those from its convergent reconstruction. Further, for each insert, the relative errors compared to the ground‐truth values were calculated and then averaged over the 7 energy levels. In row 3 of Fig. 16, we show the averaged relative error as a function of iteration number for the two aforementioned iodine and calcium inserts. It can be seen that results at iteration n=300 are indeed stably approaching the convergent results. Results and observations similar to those discussed above have also been obtained for other inserts and configurations studied.
Figure 16.
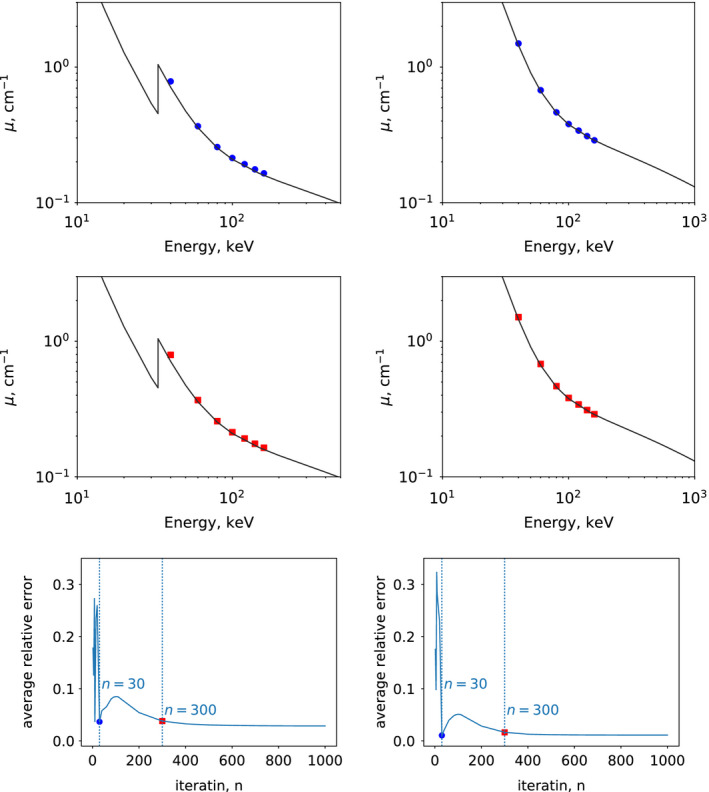
Linear‐attenuation coefficients as functions of energy plotted in a log‐log scale, for the 20‐mg/ml iodine insert (column 1) and for the 600‐mg/ml calcium insert (column 2). The solid curves represent ground‐truth values calculated from NIST data,27 along with linear‐attenuation coefficient calculated from monochromatic images at 40, 60, 80, 100, 120, 140, and 160 keV reconstructed from full‐scan data at iterations n=30 ( , row 1) and 300 (
 , row 2). Row 3: relative errors averaged over 7 energy levels for the corresponding iodine and calcium inserts, as functions of iteration number n, along with dotted vertical lines indicating the results of iterations n=30 and 300. [Color figure can be viewed at wileyonlinelibrary.com]
5.E.2. Estimation of material concentration
Again, we have repeated the concentration‐estimation study described in Section 5.D.2 by replacing the convergent monochromatic images with those formed from basis images reconstructed at intermediate iterations and then estimated the concentrations of the iodine and calcium inserts of the DE‐472 phantom at intermediate iterations. Without loss of generality, we show in Fig. 17 the results from the full‐scan data at iterations n=30 and 300 (rows 1 & 2). It can be observed that, at iteration n=300, the estimations seem closely align along the line. Furthermore, we calculated the relative errors of each insert and averaged them over the seven iodine or calcium inserts. The resulting average relative errors of concentration estimation for iodine or calcium are plotted in row 3 of Fig. 17 as a function of the iteration number n. It can be observed again that results at iteration n=300 appear to approach stably the convergent results. Results and observations similar to those discussed above have also been obtained for other inserts and configurations studied.
Figure 17.
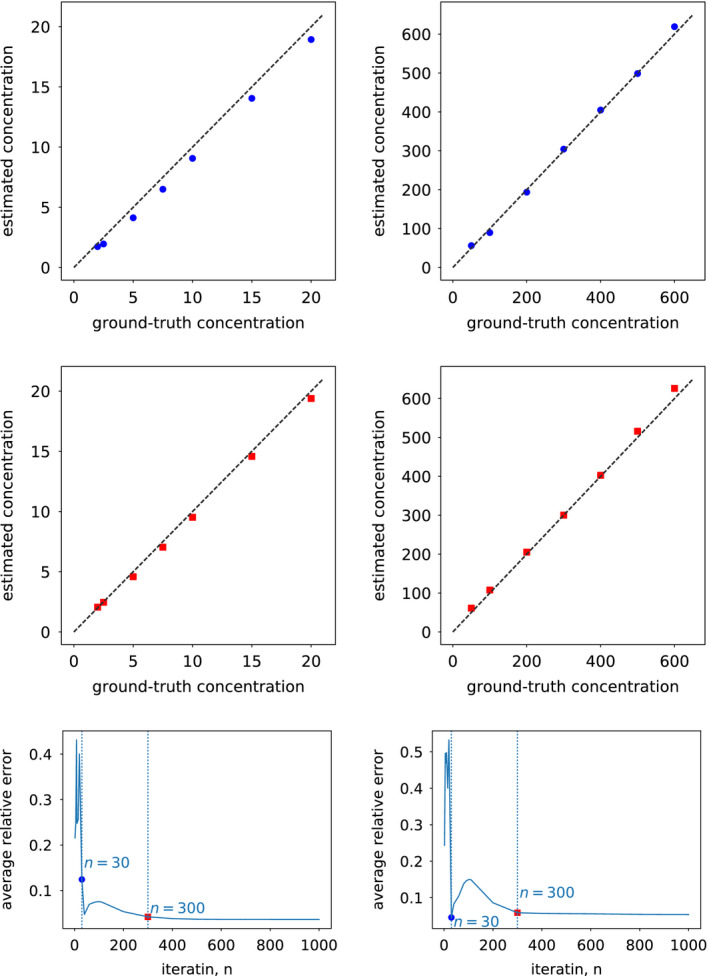
Iodine (column 1) and calcium (column 2) concentrations (in units of mg/ml) estimated from images reconstructed from full‐scan data at iterations n=30 ( , row 1) and 300 (
 , row 2), plotted against their ground‐truth values, in which the dashed lines indicate lines. Row 3: relative errors averaged over all iodine and calcium inserts, as functions of iteration number n, along with dotted vertical lines indicating the results of iterations n=30 and 300. [Color figure can be viewed at wileyonlinelibrary.com]
5.E.3. Material differentiation
For intermediate reconstructions of the DE‐472 phantom from full‐scan data, we also calculated the scatter plot, fitted two lines through the data points similar to those in Fig. 15 for calcium and iodine, and then computed angle θ between the two lines. Angle θ is used as a quantitative metric for characterization of the material‐differentiation power of the reconstruction. In row 1 of Fig. 18, we show the scatter plots calculated from reconstructions at iterations n=30 and 300, along with the two fitted lines for calcium and iodine data points. It can be observed that, in terms of material differentiation, the scatter plots at iterations n=30 and n=300 appear to be highly akin to that of the convergent reconstruction. In row 2 of Fig. 18, we plot θ as a function of iteration number n, along with coefficients of determination, , of the two linear regressions for indicating the degree of fitting goodness. For this particular example, as highlighted in row 2 of Fig. 18, angle θ for the reconstruction around iteration n=30 is comparable to that of the convergent reconstruction, and it then reaches that of the convergent reconstruction for reconstructions with iterations beyond 300. Coefficients of determination approach 1.0, indicating a near perfect fit of line regressions to the data, after iteration n=300. Although there is a peak of separation angle around iteration n=15, 's are actually low, indicating that the data points in the corresponding plots are not aligned well along straight lines. Results and observations similar to those discussed above have also been obtained for other configurations studied.
Figure 18.
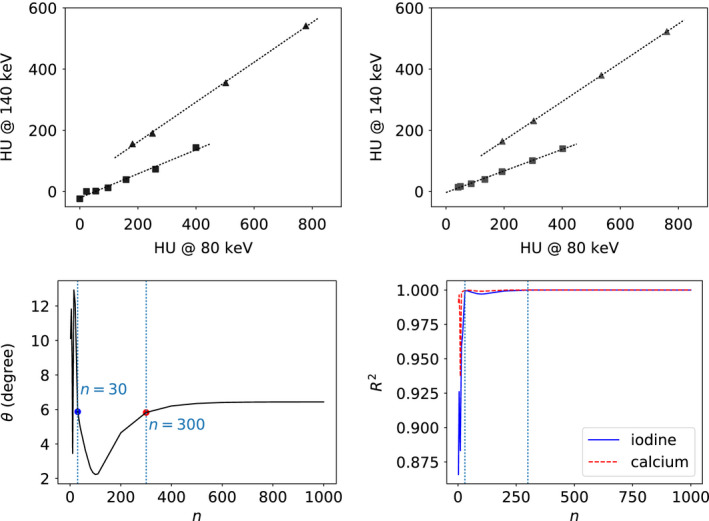
Row 1: Scatter plots of HU‐value pairs of each calcium ( ) and iodine (
 ) inserts in the DE‐472 phantom calculated by using the 80‐keV and 140‐keV monochromatic reconstructions from full‐scan data at iterations n=30 (column 1) and 300 (column 2). Row 2: Metric θ (column 1) and coefficients of determination (column 2) for iodine (solid) and calcium (dashed), as functions of iteration number n, along with dotted vertical lines indicating the results of iterations n=30 and 300. [Color figure can be viewed at wileyonlinelibrary.com]
6. Discussion
In the work, we have investigated an optimization‐based one‐step method for image reconstruction through solving the nonlinear data model in dual‐energy CT, with an emphasis on the study of the method's potential for enabling partial‐angular‐scan configurations that can readily be realized by use of the standard single‐kVp‐switch technique available on standard CT without involving additional hardware. The studies have been carried out by use of computer‐simulation data of numerical phantoms and real data of physical phantoms.
Like any algorithm, the performance of the optimization‐based one‐step method depends upon a number of parameters and metrics used. For example, its performance is likely to be impacted by the anatomic complexity of the imaged subject, data noise and artifacts, and reconstruction parameters. The metrics considered in the work are visualization, profile plots, estimation accuracy of linear‐attenuation coefficient and material concentration, and material‐differentiation power. For demonstration purpose, parameters in the real‐data study such as voxel size and data/image dimensions were selected as those in typical clinical applications, whereas constraint parameter ε in the real‐data study was selected through visual comparison of reconstructions with the corresponding reference images. We note that while the results suggest that the subjective visual selection of parameter ε serves adequately the purpose of this initial study, specific application tasks are the guide for designing a scheme for determining parameter ε suitable for the application.
In the real‐data study in which the ground‐truth images are absent, we have used the images, as reference images, reconstructed by use of a well‐established two‐step method applied widely in dual‐energy applications.29, 30 Clearly, the reference images can be dependent upon data conditions, object‐anatomy complexity, and reconstruction methods, and may even contain some visible artifacts. As mentioned, they are not used as the ground‐truth images of the real‐data results. They are used instead only for providing a level of guidance and benchmark of images reconstructed by use of the one‐step method for the scan configurations considered.
We have focused largely on showing the convergent reconstructions for avoiding the need to treat the iteration number as a parameter, but we have also inspected reconstructions and quantitative results as functions of iterations, and observed that reconstructions at earlier iterations can visually and quantitatively resemble the convergent reconstructions. While the intermediate iteration results may yield insights into speeding up the reconstruction, further investigation on the practical use in clinical dual‐energy CT applications are warranted under additional, application specific constraints.
Quantitative real‐data studies based upon tasks of linear‐attenuation‐coefficient and material‐concentration estimation and of material differentiation show that the two partial‐angular‐scan configurations can yield results comparable to those of the reference images, revealing that the two partial‐angular‐scan configurations with angular ranges substantially smaller than that of the standard single‐kVp‐switch full‐scan configuration in which two full rotations are made can effectively reduce the imaging dose and scanning time of the latter. While two partial‐angular‐scan configurations are demonstrated in the work, additional scan configurations for dual‐energy CT imaging can readily be enabled by use of the one‐step method, including helical source trajectory and/or off‐set detector configurations. Furthermore, the one‐step method can be extended to CT‐scanning configurations involving multiple (>2) spectra.22
We point out that, while the work provides, with simulated and real data, an initial demonstration of the feasibility of single‐kVp‐switch partial‐angular‐scan configurations enabled by use of the one‐step method for dual‐energy CT imaging, it remains to be established fully the practical utility of partial‐angular‐scan configurations, such as the two partial‐angular‐scan configurations enabled in this work, in realistic clinical applications with clinical‐task‐specific‐utility metrics. In the two partial‐angular‐scan configurations considered, the low‐ and high‐kVp scans are not performed simultaneously, and it is thus an interesting topic of future research to investigate how the subject motion may impact their performance.
7. Conclusion
For the full‐ and two partial‐angular‐scan configurations considered, the study results using computer‐simulation data validate that the one‐step method can numerically accurately recover the phantom images from data collected with the scan configurations considered, whereas the study results using real data reveal that the reference monochromatic images and the monochromatic images obtained with the one‐step method for full‐ and partial‐angular‐scan configurations largely resemble each other in terms of visualization and profile plots. Additionally, we have performed quantitative studies in dual‐energy imaging tasks for estimations of linear‐attenuation coefficient and material concentration and for material differentiation. The studies show that the estimation results obtained with the one‐step method for the full‐ and partial‐angular‐scan configurations are closely consistent with their respective ground‐truth information, along with a material‐differentiation power comparable to that of the reference images, suggesting the potential utility of the two partial‐angular‐scan configurations enabled in the estimation and material‐differentiation tasks considered. The design of the one‐step method lends itself a great degree of flexibility for accommodating different scan configurations, and the work may thus yield insights into the investigation and design of other nonstandard scan configurations of potential practical significance for dual‐energy CT.
Acknowledgments
This work was supported in part by NIH R01 Grants Nos. CA182264 and EB018102. The contents of this article are solely the responsibility of the authors and do not necessarily represent the official NIH views. The authors thank Mr. Sean Rose for insightful discussion.
References
- 1. Primak AN, Fletcher JG, Vrtiska TJ, Dzyubak OP, Lieske JC, Jackson ME, Williams JC, Jr , McCollough, CH. Noninvasive differentiation of uric acid versus nonuric acid kidney stones using dual‐energy CT. Acad Radiol. 2007;14:1441–1447. [DOI] [PMC free article] [PubMed] [Google Scholar]
- 2. Thieme SF, Becker CR, Hacker M, Nikolaou K, Reiser MF, Johnson TRC. Dual energy CT for the assessment of lung perfusioncorrelation to scintigraphy. Eur J Radiol. 2008;68:69–374. [DOI] [PubMed] [Google Scholar]
- 3. Graser A, Johnson TRC, Chandarana H, Macari M. Dual energy CT: preliminary observations and potential clinical applications in the abdomen. Eur Radiol. 2009;19:13. [DOI] [PubMed] [Google Scholar]
- 4. McCollough CH, Leng S, Yu L, Fletcher JG. Dual‐ and multi‐energy CT: principles, technical approaches, and clinical applications. Radiology. 2015;276:637–653. [DOI] [PMC free article] [PubMed] [Google Scholar]
- 5. Alvarez RE, Macovski A. Energy‐selective reconstructions in X‐ray computerised tomography. Phys Med Biol. 1976;21:733. [DOI] [PubMed] [Google Scholar]
- 6. Lehmann LA, Alvarez RE, Macovski A, Brody WR, Pelc NJ, Riederer SJ, Hall AL. Generalized image combinations in dual kvp digital radiography. Med Phys. 1981;8:659–667. [DOI] [PubMed] [Google Scholar]
- 7. Kalender WA, Perman WH, Vetter JR, Klotz E. Evaluation of a prototype dual‐energy computed tomographic apparatus. I. Phantom studies. Med Phys. 1986;13:334–339. [DOI] [PubMed] [Google Scholar]
- 8. Roessl E, Proksa R. K‐edge imaging in X‐ray computed tomography using multi‐bin photon counting detectors. Phys Med Biol. 2007;52:4679. [DOI] [PubMed] [Google Scholar]
- 9. Zou Y, Silver MD. Analysis of fast kV‐switching in dual energy CT using a prereconstruction decomposition technique. Proc SPIE Medical Imaging: Physics of Medical Imaging. Vol. 6913. 2008;691313–691313–12. [Google Scholar]
- 10. Brooks RA. A quantitative theory of the Hounsfield unit and its application to dual energy scanning. J Comput Assist Tomogr. 1977;1:487–493. [DOI] [PubMed] [Google Scholar]
- 11. Maass C, Baer, M , Kachelriess M. Image‐based dual energy CT using optimized pre correction functions: A practical new approach of material decomposition in image domain. Med Phys. 2009;36:3818–3829. [DOI] [PubMed] [Google Scholar]
- 12. Kuchenbecker S, Faby, S , Sawall S, Lell M, Kachelriess M. Dual energy CT: How well can pseudo‐monochromatic imaging reduce metal artifacts?. Med Phys. 2015;42:1023–1036. [DOI] [PubMed] [Google Scholar]
- 13. Elbakri I, Fessler J. Statistical image reconstruction for polyenergetic X‐ray computed tomography. IEEE Trans Med Imaging. 2002;21:89–99. [DOI] [PubMed] [Google Scholar]
- 14. Chung J, Nagy J, Sechopoulos I. Numerical algorithms for polyenergetic digital breast tomosynthesis reconstruction. SIAM J Imaging Sci. 2010;3:133–152. [Google Scholar]
- 15. Cai, C , Rodet T, Legoupil S, Mohammad‐Djafari A. A full‐spectral Bayesian recon struction approach based on the material decomposition model applied in dual‐energy computed tomography. Med Phys. 2013;40:111916. [DOI] [PubMed] [Google Scholar]
- 16. Long Y, Fessler J. Multi‐material decomposition using statistical image reconstruction for spectral CT. IEEE Trans Med Imaging. 2014;33:1614–1626. [DOI] [PMC free article] [PubMed] [Google Scholar]
- 17. Zhang R, Thibault J‐B, Bouman C, Sauer K, Hsieh J. Model‐based iterative reconstruction for dual‐energy X‐ray CT using a joint quadratic likelihood model. IEEE Trans Med Imaging. 2014;33:117–134. [DOI] [PubMed] [Google Scholar]
- 18. Nakada K, Taguchi K, Fung GSK, Amaya K. Joint estimation of tissue types and linear attenuation coefficients for photon counting CT. Med Phys. 2015;42:5329–5341. [DOI] [PubMed] [Google Scholar]
- 19. Zhao Y, Zhao X, Zhang P. An extended algebraic reconstruction technique (E‐ART) for dual spectral CT. IEEE Trans Med Imaging. 2015;34:761–768. [DOI] [PubMed] [Google Scholar]
- 20. Chen Y, O’Sullivan JA, Politte DG, Evans JD, Han, D , Whiting BR, Williamson JF. Line integral alternating minimization algorithm for dual‐energy x‐ray ct image reconstruction. IEEE Trans Med Imaging. 2016;35:685–698. [DOI] [PMC free article] [PubMed] [Google Scholar]
- 21. Barber RF, Sidky EY, Schmidt TG, Pan, X. An algorithm for constrained one‐step inversion of spectral CT data. Phys Med Biol. 2016;61:3784. [DOI] [PMC free article] [PubMed] [Google Scholar]
- 22. Chen B, Zhang Z, Sidky EY, Xia, D , Pan, X. Image reconstruction and scan configurations enabled by optimization‐based algorithms in multispectral CT. Phys Med Biol. 2017;62:8763. [DOI] [PMC free article] [PubMed] [Google Scholar]
- 23. Hubbell J, Seltzer S. Tables of X‐ray mass attenuation coefficients and mass energy absorption coefficients (version 1.4). 2004.
- 24. Pan X, Chen B, Zhang Z, Pearson E, Sidky E, Han, X. Optimization‐based reconstruction exploiting spectral information in CT. The Third International Conference on Image Formation in X‐Ray Computed Tomography. 2014;228–232. [Google Scholar]
- 25. Sidky EY, Pan, X. Image reconstruction in circular cone‐beam computed tomography by constrained, total‐variation minimization. Phys Med Biol. 2008; 53 4777. [DOI] [PMC free article] [PubMed] [Google Scholar]
- 26. JRTAssociates . Dual energy CT phantom ‐ JRT Associates. 2015.
- 27. Berger M, Hubbell J, Seltzer S, Chang J, Coursey J, Sukumar R, Zucker D, Olsen K. XCOM: Photon cross section database (version 1.5). 2010.
- 28. Johnson T, Fink C, Schnberg SO, Reiser MF. Dual Energy CT in Clinical Practice. Berlin: Springer‐Verlag; 2011. [Google Scholar]
- 29. Eilbert RF, Krug KD. Aspects of image recognition in Vivid Technologies’ dual‐energy x‐ray system for explosives detection. (International Society for Optics and Photonics) 1993;127–144.
- 30. Ying Z, Naidu R, Crawford CR. Dual energy computed tomography for explosive detection. J X‐ray Sci Technol. 2006;14:235–256. [Google Scholar]


