Significance
The present work considers the effect of NK cell treatment in a combination therapy with oncolytic virus (OV) and bortezomib. It demonstrates by cross-disciplinary analysis of a complex biological process that the standard strategies, wherein “more is better,” do not necessarily apply when multiple drugs of different classes and interactions are being used in the combination. While many combination clinical trials are being conducted with little forethought as to the interactions that may be expected between diverse agents, this work provides a basis for the generation of mathematical models and simulations that address the complexity of the interactions among the diverse agents and could play an important role in the future development of clinical trials.
Keywords: oncolytic virus, NK cells, bortezomib, partial differential equations models, tumor microenvironment
Abstract
In the present work, we investigated the role of natural killer (NK) cells in combination therapy with oncolytic virus (OV) and bortezomib, a proteasome inhibitor. NK cells display rapid and potent immunity to metastatic and hematological cancers, and they overcome immunosuppressive effects of tumor microenvironment. We developed a mathematical model to address the question of how the density of NK cells affects the growth of the tumor. We found that the antitumor efficacy increases when the endogenous NKs are depleted and also when exogenous NK cells are injected into the tumor. These predictions were validated by our in vivo and in vitro experiments.
Oncolytic viruses (OVs) such as herpes simplex virus 1 (oHSV) are genetically modified to target and kill cancer cells while not harming healthy normal cells and are currently being studied under multiple clinical trials for safety and efficacy (1). The Food and Drug Administration (FDA) approval of T-Vec, an oHSV for advanced melanoma patients, points to this therapy’s potential for the treatment of advanced cancers (2, 3). A better understanding of the mutual interaction between OVs and the immune system in combination with approved chemotherapy agents may support improvement in the designs of therapeutic strategies to eradicate cancer cells.
Aggressive tumor growth necessitates increased synthesis and degradation/recycling of many proteins (4). Two major cellular mechanisms of protein degradation are the autophagy–lysosome system (autophagy) and the ubiquitin–proteasome system. The latter involves initial ubiquitination and proteasome-mediated degradation of targeted proteins, making proteasome inhibitors effective antitumor drugs (2).
Bortezomib is a peptide-based proteasome inhibitor and an FDA-approved drug for multiple myeloma and mantle cell lymphoma. Yoo et al. (3) have demonstrated that bortezomib-induced unfolded protein response in many tumor cell lines (glioma, ovarian, and head and neck) up-regulated the expression of heat shock protein 90 (HSP90), which then enhanced viral replication through the promotion of nuclear localization of the viral polymerase in vitro. This led to synergistic tumor cell killing in vitro, and a combination treatment of mice with oHSV and bortezomib showed improved antitumor efficacy in vivo (3). The follow-up study (5) illustrated that treatment of cancer cells with bortezomib followed by oHSV infection led to an RIPK1-dependent necroptotic cell death and JNK-dependent reactive oxygen species production. This combination therapy also increased the surface expression levels of natural killer (NK) cell-activating markers and enhanced proinflammatory cytokine secretion. These findings demonstrated that the synergistic interaction between oHSV and bortezomib, a clinically relevant proteasome inhibitor, augments the cancer cell killing and promotes overall therapeutic efficacy. Therefore, there is a solid ground for combining these agents in a clinical trial.
In this work, we considered the role of NK cells on infected and uninfected tumor cell clearance after treatment with bortezomib and OVs and its impact on therapeutic efficacy. We can experimentally manipulate the number of NK cells by either depleting the endogenous NK cells or by injecting exogenous NK cells into the tumor. Since NK cells kill cancer cells, increasing the number of NK cells will result in increased killing of cancer cells. However, the killing of virus-infected tumor cells will decrease the number of virus particles, and, thereby, the antitumor effect of the OV will also be reduced. We are thus led to the following question: What should be the optimal number of NK cells in anticancer treatment with OV–bortezomib therapy? We addressed this question with a mathematical model and validated our conclusions with experimental results in vitro and in vivo. The model is represented by a system of partial differential equations (PDEs), and the conclusions are stated in terms of the ratio of the density of NK cells (N) to the density of cancer cells (G). The model predicts that the antitumor treatment is more effective if N/G is either small or large and is less effective for intermediate values of N/G. These conclusions are validated experimentally in terms of the number of cancer cells that were in the tumor and also in terms of survival time of mice bearing intracranial patient-derived primary glioblastoma multiforme (GBM).
Mathematical Model and Experimental Results
State Variable Definitions.
We introduced the following variables:
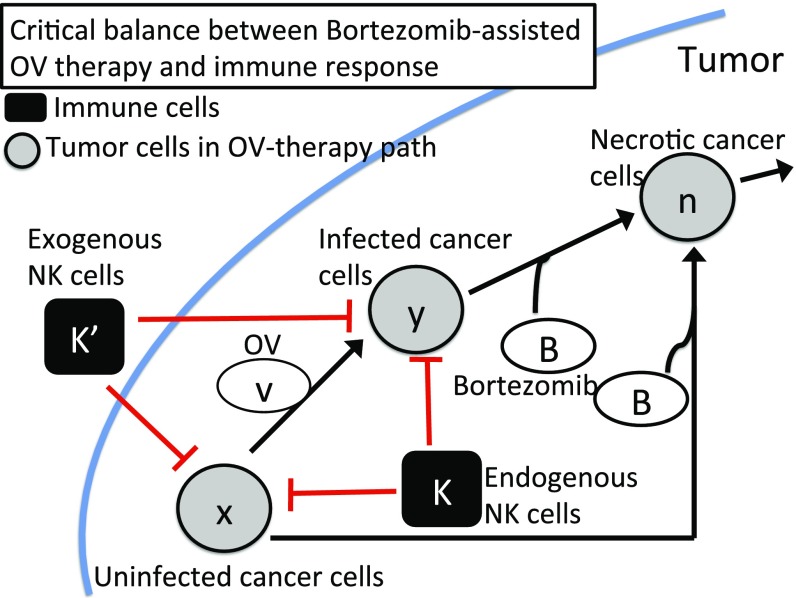
Interactions between these variables are shown in Fig. 1.
Fig. 1.
A regulatory network involving OV therapy (gray circles) and immune response (black squares) in bortezomib-assisted OV therapy. Arrows indicate induction and activation. Hammerheads indicate inhibition.
Cancer Cell Density ().
To describe the time evolution of densities of different types of cancer cells (uninfected, infected, and dead cells), we took into account the proliferation of cancer cells and the virus infection of cancer cells, followed by a clearance process, and the passive movement due to the velocity field u resulting from the tumor growth. The equations for and were modified from the model by Friedman et al. (6):
| [1] |
| [2] |
| [3] |
where is the diffusion coefficient, is the proliferation rate of uninfected tumor cells with carrying capacity , is the infection rate, is the infected cell lysis rate, is the removal rate of dead cells, is the bortezomib-induced apoptosis of tumor cells, is the bortezomib-induced necroptotic cell death rate of infected cells, and are the killing rates of uninfected and infected cells by endogenous NK cells, respectively, and and are the killing rates of uninfected and infected cells by exogenous NK cells, respectively.
Endogenous NK Cells ().
The combination of OV and bortezomib induces necrotic cancer cells () to recruit NK cells (5). This recruitment is facilitated by cytokines IFN- and TNF- from necrotic cells. For simplicity, we assumed that the recruitment rate was proportional to where is a constant. Hence,
| [4] |
Exo NK Cells ().
NK cells were injected into the tumor as adjuvant therapy (Materials and Methods). The injections began at day and continued for days, at rate . We model the dynamics of by the equation
| [5] |
where if , and otherwise.
Density of Free Virus Particles ().
The virus is replication-competent, and we denote by the number of viral particles released when an OV infected cell dies by lysis. In addition, the bortezomib improves viral replication by a factor proportional to (5). Hence, the equation for is the following:
| [6] |
where is the removal rate of viruses.
Bortezomib ().
Bortezomib is continuously supplied to the tumor via intraperitoneal injection and diffusion through the tissue. We took into account the consumption from the internalization of bortezomib in both uninfected and infected tumor cells and natural decay at rate . Hence,
| [7] |
where is the effective rate of bortezomib that is supplied to the tumor.
Velocity (u).
We assumed that the total density of all of the cells is constant at each spatial point,
| [8] |
and that the boundary of the tumor moves with the velocity of u of the cells. We also assumed that all of the cells have the same diffusion coefficient. By adding Eqs. 1–5, we get an equation for u:
| [9] |
This determines u in the radially symmetric case, where ( is the unit radial vector), and the tumor boundary is given by . For simplicity, all of the subsequent simulations were performed for the radially symmetric case.
Applications to Cancer Cell Killing
Increased NK Cell-Mediated Antitumor Efficacy in Response to Increased NK Cell Injection.
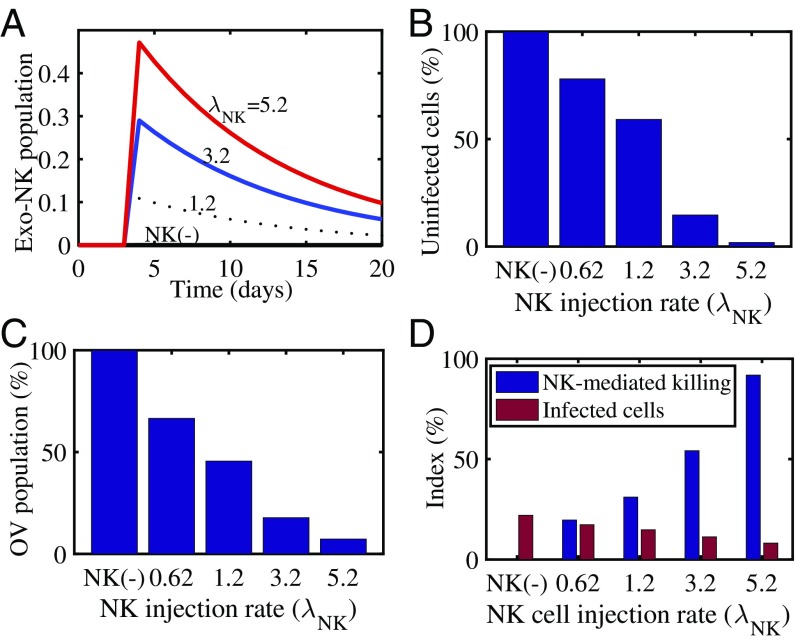
We investigated the effect of adjuvant NK cell therapy on tumor growth. Fig. 2 was obtained when we injected NK cells into the tumor with various injection rates in Eq. 5. We saw that the increased NK cells (Fig. 2A) killed more uninfected tumor cells (Fig. 2B) than only OV and bortezomib (OV–bortezomib) therapy. Since these NK cells also attack OV-infected cells, this enhanced immune response resulted in a decrease in the OV population (Fig. 2C). Fig. 2D shows the relative number of infected cell populations and relative number of killed cancer cells by NK cells. Overall, we saw that NK cell-mediated tumor cell killing was increased and OV–bortezomib-mediated infection was decreased as the NK cell injection rate () was increased. We concluded that NK cell adjuvant therapy can enhance glioma cell killing, even though NK cell treatment reduces oHSV replication.
Fig. 2.
Simulation results for NK cell-mediated antitumor cell killing and infected cells with various NK injection rates (). (A) Time courses of exogenous NK (exo-NK) cell populations for (NK), 1.2, 3.2, and 5.2. (). (B) Normalized population (percent) of uninfected cancer cells for , 0.62, 1.2, 3.2, and 5.2. (C) Normalized OV population (percent) for , 0.62, 1.2, 3.2, and 5.2. (D) NK cell-mediated antitumor killing (blue) and infected cell populations (red) at final time ( d) for various injection rates [ (NK), 0.62, 1.2, 3.2, and 5.2].
Either Small or Large NK Cells Lead to Better Antitumor Efficacy.
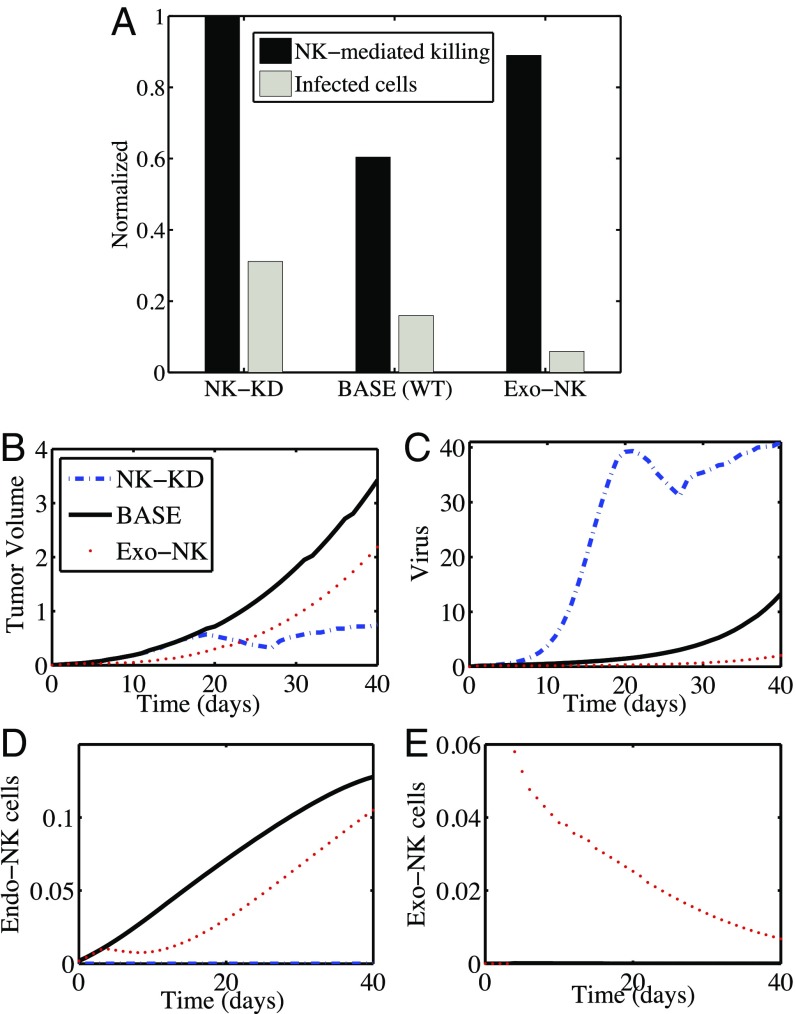
Since activated NK cells impede viral infection, replication, and ultimately tumor cell lysis, leading to virus clearance, we tested the impact of NK cells on the antitumor efficacy of OV–bortezomib combination therapy by depleting NK cells with anti-Asialo–GM1 antibody (Fig. 3). In Fig. 3A, in the NK-KD column (), the bars represent the relative number of killed cancer cells by NK-mediated immune response (black bar) and relative population of infected cells (gray bar) at day 40. The rightmost set of bars (Exo-NK cells) corresponds to the case wherein both endogenous and exogenous NK cells are present in the tumor, satisfying Eqs. 4 and 5. The center column [BASE (WT)] corresponds to the case wherein endogenous NK cells satisfy Eq. 4 with . Fig. 3 B–E shows time courses of tumor volume and populations of OVs, endogenous NK cells, and exogenous NK cells, respectively. Intratumoral injection of NK cells into the tumor microenvironment 3 d after oHSV treatment in bortezomib-treated mice enhanced NK cell-mediated immune attack to reduce the tumor size (Fig. 3B, dotted line).
Fig. 3.
Both NK cell depletion and NK cell adjuvant therapy significantly enhance antitumor efficacy of mice treated with both bortezomib and oHSV. (A) Simulation results in antitumor efficacy (black bars) and infected cell population (gray bars) at day 40 for cases of NK cell-depletion (NK-KD), control (base), and exogenous NK cell injection (Exo-NK). (B–E) Time courses of tumor volume (B) and populations of OVs (C), endogenous NK cells (D), and exogenous NK cells (E) for the corresponding cases.
Since these NK cells also kill OVs within the infected tumor cells, the virus population was significantly reduced (Fig. 3C), and the effect of necroptotic cell death in the tumor population via OV–bortezomib therapy was also reduced. By contrast, in the NK cell-depletion case (NK-KD), there was no contribution to tumor cell killing from endogenous and exogenous NK cells (). In particular, increased survival of infected cells (Fig. 3A; gray bars) from the immune attack led to the suppression of tumor growth (Fig. 3B, dashed line) due to a rapid replication of OVs (Fig. 3C, dashed line). The oscillation seen in the tumor volume and virus density can be explained as follows: The increase in tumor volume in the first 20 d (as a result of an increase in the uninfected and infected tumor cells) was accompanied by increased virus density. The increased anticancer virus level then resulted, during the following 8 d, in a decrease in tumor volume, and, correspondingly, in a decrease in the density of infected cells and virus. After day 28, the virus level was too small to stop the tumor volume from growing. By comparing these results with the control case, our mathematical model predicts that (i) depletion of endogenous NK cells removes the immune attack on infected tumor cells, resulting in increased OV activity and overall tumor killing; and (ii) injection of NK cells into the tumor system increases tumor cell killing by NK cells, leading to improved antitumor efficacy. Thus, the model predicts that the number of killed cancer cells (and the anticancer efficacy) is larger when the number of NK cells is very small or very large, as opposed to in the case of an intermediate number of NK cells. These findings are confirmed in the experiments below.
Effect of Bortezomib on OV Replication and Antitumor Efficacy.
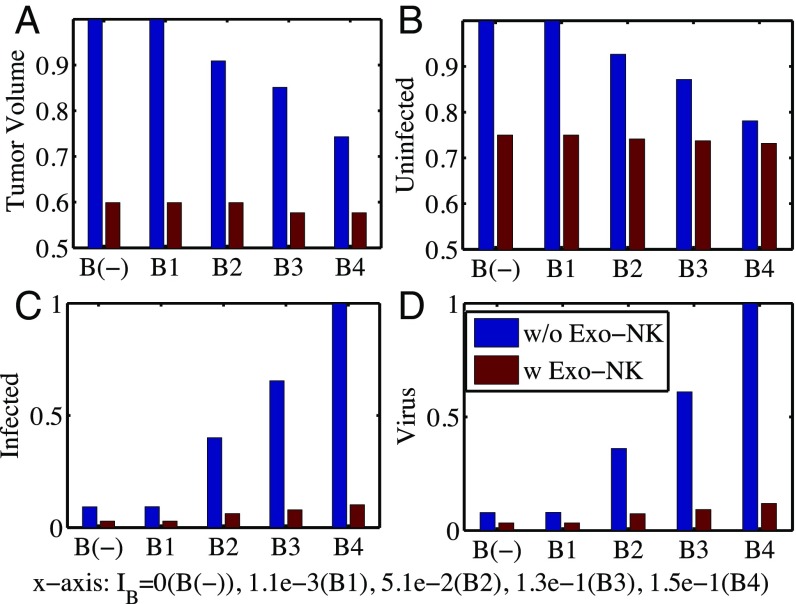
In Fig. 4, we investigated the effect of bortezomib treatment on antitumor efficacy of OV therapy in the absence (blue bars) and presence (red bars) of exogenous NK cells for various bortezomib supply rates: ()). In the absence of exogenous NK cells, tumor volume was decreased as the bortezomib level was increased compared with the control case [B();], leading to a better antitumor efficacy (Fig. 4A, blue bars). Bortezomib enhanced virus replication (Fig. 4D, blue bars) and infected cell population (Fig. 4C, blue bars), leading to better OV-boosted cancer cell killing. This enhancement of viral activities in the presence of bortezomib concurred well with experimental results in previous studies (3, 5). However, the effect of the bortezomib treatment was minimal in the presence of exogenous NK cells. For example, virus replication (Fig. 4D, red bars) and infected cell population (Fig. 4C, red bars) were insignificant, leading to little change in antitumor efficacy (Fig. 4A, red bars). This behavior of low response for various bortezomib levels was also observed in our experiments.
Fig. 4.
Effect of bortezomib on antitumor efficacy. (A) Normalized tumor volume at day 40 without (blue bars) and with (red bars) exogenous NK cell injection for various bortezomib supply rates (). (B–D) Relative population of uninfected cancer cells (B), infected cancer cells (C), and oHSV (D), corresponding to A.
Experimental Validation.
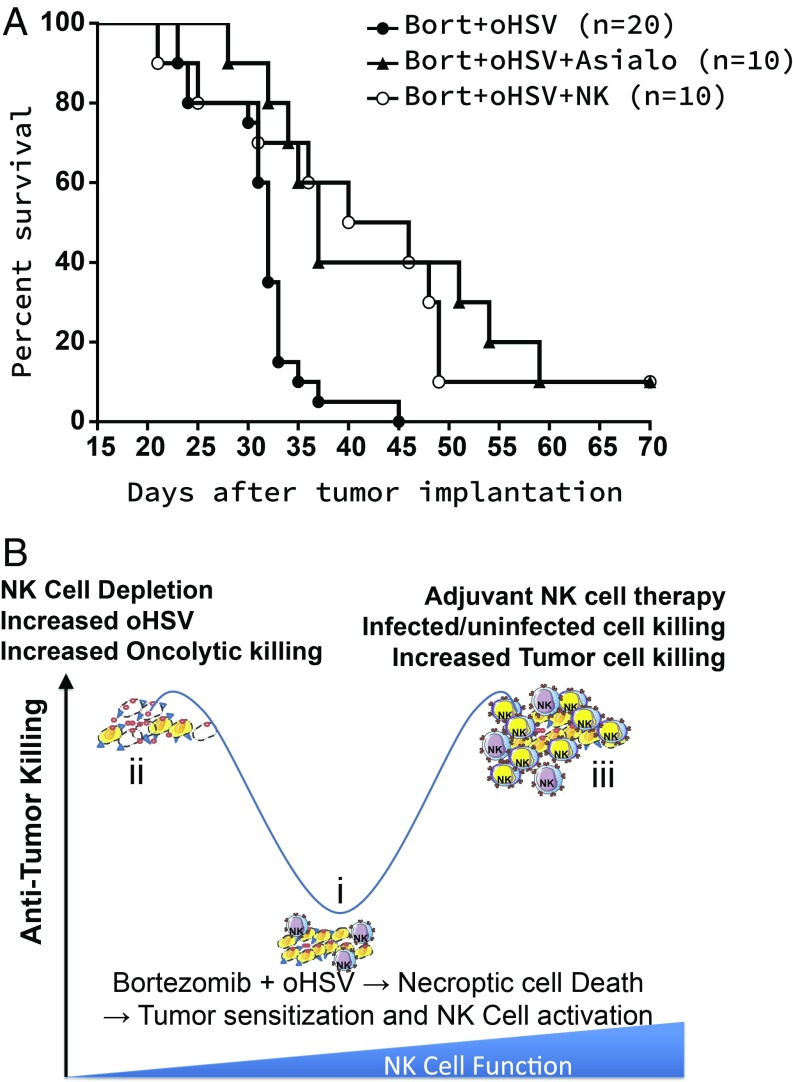
Fig. 5A shows the survival time in mice bearing intracranial patient-derived primary glioma (GBM30) tumors treated with bortezomib and oHSV. The survival time for mice treated with OV–bortezomib was much shorter than the survival time for mice undergoing the same OV–bortezomib therapy with either depletion of their endogenous NK cells or with introduction of their NK cells by exogenous NK cell injection. NK cells were depleted by using anti-Asialo–GM1 antibody given to mice by intraperitoneal injection 2 d before virotherapy, followed by semiweekly injections for the duration of the experiment as described in ref. 7; we and other investigators have used this antibody to deplete NK cells in mice. We also confirmed ablation of NK cells in the spleen of mice after treatment with this antibody. In tumor-bearing mice after treatment with oHSV, this antibody reduced NK cell infiltration by nearly fivefold, as described in ref. 7. Fig. 5B illustrates a dynamic antitumor killing model with NK cell function as a key parameter. Necroptic cell death increased the expression of tumor cell surface receptors that are known to activate NK cells (CD155, CD112, and CD58, drawn as blue triangles on tumor cells). This also resulted in increased expression of TRAIL on NK cells, which led to the induction of apoptosis in tumor cells. Despite increased NK cell activation, the depletion of NK cells (step ii) improved antitumor efficacy and suggests that the primary antitumor response was likely due to direct virus targeting of the cancer cell population. Our findings also showed that complementing endogenous NK cells with adjuvant NK cell immunotherapy improved overall efficacy (step iii), probably through the facilitation of a robust NK cell-mediated tumor cell killing response beyond the limits of endogenous NK cells which focused on both infected and uninfected tumor cell populations.
Fig. 5.
(A) Experimental results: Kaplan–Meier survival curves of mice treated with bortezomib (Bort) and oHSV with or without adjuvant NK cell therapy. Both NK cell depletion and NK cell adjuvant therapy significantly enhance antitumor efficacy of mice treated with both bortezomib and oHSV. (B) A model depicting the impact of bortezomib and oHSV combination therapy on NK cell activity in vivo.
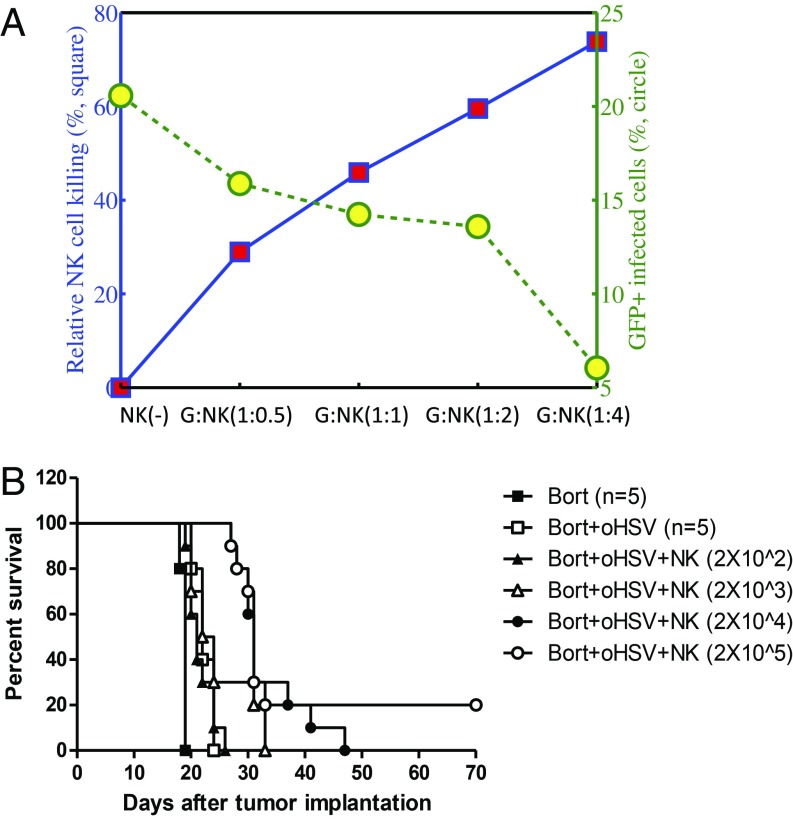
As shown in Fig. 6, we investigated the effect of adjuvant NK therapy on tumor growth using in vitro (Fig. 6A) and in vivo (Fig. 6B) experiments. We first examined the effect of NK cells on tumor cell killing in coculture with various tumor:NK cell ratios (G:NK = 1:0.5, 1:1, 1:2, and 1:4) (Fig. 6A). As the relative population of NK cells in the coculture was increased, the relative NK cell-mediated killing was significantly increased from 29 to 74%, while the population of GFP+ infected cells decreased from 21% (control case) to 6%. (See SI Appendix for detailed analysis of cell death due to OV infection and immune attack.) We next tested in vivo the effect of increasing the level of adjuvant treatment with NK cells for patient-derived primary GBM tumor-bearing mice treated with bortezomib and oHSV. In agreement with the results shown in Fig. 6A (the cases bortezomib + oHSV vs. bortezomib + oHSV + NK), we found that increasing the level of exogenous NK cells improved mice survival. This was to be expected from Fig. 2D of our model simulation.
Fig. 6.
Comparison between experimental data and simulation results on NK cell adjuvant therapy. (A) In vitro experimental results for control (NK) and increasing number of NK cells in coculture system. (B) Kaplan–Meier survival curves of adjuvant NK therapy in mice treated with bortezomib (Bort) and oHSV therapy. High numbers, but not lower numbers, of adjuvant NK cell therapy significantly enhanced antitumor efficacy.
Discussion
The recent FDA approval of T-Vec for advanced nonresectable melanoma patients underscores the potential of biological OV therapy to treat aggressive cancers. Yoo et al. (3) have shown that bortezomib, a proteasome inhibitor, up-regulated expression of HSP90, which enhanced nuclear localization of the viral polymerase, resulting in the promotion of virus replication and antitumor efficacy of OV therapy.
Previous studies demonstrated that the tumor microenvironment plays an important role in tumor growth (8, 9) and OV therapy (10). In particular, modulation of host immune attack may reduce intratumoral invasion of innate immune cells, including macrophages and NK cells, and can increase viral propagation, leading to enhanced antitumor efficacy (7, 11, 12). It was also shown that macrophage- and microglia-secreted TNF induces oHSV-infected tumor cell apoptosis, thus lowering viral replication and efficacy (13).
NK cells are essential components of the innate immune system and play a critical role in host immunity against cancer (14). Only 10% of all lymphocytes in the peripheral blood are NK cells, whereas T lymphocytes make up 50–70% of all lymphocytes (15). However, the NK cell ability to recognize and kill “invaders” and tumor cells without the requirement of antigen exposure has been seen as a promising factor in the treatment of malignant diseases, including cancer (15–17). NK cells display rapid and potent immunity to metastatic and hematological cancers, and current studies seek to exploit their antitumor properties in the clinic (18). Immunosuppressive effects of tumor microenvironment can be overcome by including exogenous NK cells in a combination treatment (19). Different approaches of NK cell therapy, including bortezomib (20), are in experimental and clinical trials targeting various agents, pathways, and receptors of microenvironmental cells (20–39). In the present work, we considered a particular combination treatment, OV–bortezomib therapy, and studied the effect of exogenous NK cell injection and reduced NK cells by depleting endogenous NK cells using anti-Asialo–GM1 antibody.
We have developed a mathematical model by a system of PDEs to study the effect of NK cells on OV–bortezomib therapy. We have shown that OV–bortezomib therapy can be exploited by manipulating the number of NK cells. By reducing the number of endogenous NK cells, or by increasing the number of exogenous NK cells, the efficacy of the antitumor treatment is increased. We have conducted in vitro and in vivo experiments that are in agreement with the conclusions of the mathematical model. The mathematical model also predicts that a small delay in NK cell adjuvant therapy may allow a greater virus spread before the adjuvant therapy, thereby increasing antitumor efficacy. However, a large delay in adjuvant therapy decreased the advantage of NK cell-induced tumor cell killing, leading to worse antitumor efficacy. It is important to note that while NK cell depletion was initiated 2 d before viral injection, the adjuvant cell therapy was given a few days (3 d) after OV treatment to exploit the NK cell-induced changes in the tumor microenvironment after OV therapy. The mathematical simulation thus predicts that a scenario in which transient NK cell depletion before virus therapy followed by NK cell adjuvant therapy given after OV–bortezomib therapy would have the maximal benefits (SI Appendix, Figs. S4 and S5). In particular, Fig. 5 shows that either strategy, i.e., NK cell depletion or exogenous NK cell injection, increased survival time, although it is not clear which of the two strategies is better. The answer should also depend on negative side effects associated with the depletion of NK cells (weak immune system) and with the injection of exogenous NK cells (toxicity and inflammation).
Materials and Methods
Mathematical Modeling Methods.
All model simulations were performed by using a finite volume method with fractional step method (40) as well as the nonlinear solver nksol for algebraic systems. The model equations were solved on an adaptive spatial grid and an adaptive time step.
Cell Culture and Virus.
Patient-derived primary GBM neurospheres, GBM30, were obtained from E. Chiocca, Ohio State University, Columbus, OH, and U251T3 cells were created in our laboratory (May 2009) as a tumorigenic clone of U251 cells by serially passaging these cells three times in mice (5). Monkey kidney epithelial-derived Vero cells were purchased from the American Type Culture Collection in 2015. GBM30 and U251T3 were authenticated by the University of Arizona Genetics Core via short tandem repeat profiling in January 2015. Vero cells have not been authenticated since receipt. GBM30 cells were maintained as tumor spheres in neurobasal medium supplemented with 2% B27 without vitamin A, human EGF (20 ng/mL), and basic FGF (20 ng/mL) in low-attachment cell culture flasks. U251T3 and Vero cells were maintained in DMEM (Gibco BRL) supplemented with 10% FBS. All cells were maintained at 37 °C in a humidified atmosphere with 5% carbon dioxide and maintained with 100 U of penicillin per mL and 0.1 mg of streptomycin per mL. Cells were routinely monitored for changes in morphology and growth rate. All cells were negative for Mycoplasma. The construction and generation of oHSV, 34.5ENVE, has been described, and virus was prepared and titered as described (41). Virus was propagated in Vero cells as described (42).
Live/Dead Cell Staining.
U251T3-mCherry, which stably expresses mCherry, was pretreated with or without 12 nmol/L bortezomib for 16 h followed by PBS or oHSV treatment at a multiplicity of infection of 0.01 (ED50). Two hours after oHSV infection, the cells were washed to remove unbound virus and then overlaid with different numbers of primary donor-derived human NK cells. Twenty-four hours later, cells were harvested and stained with a Live/Dead Fixable Aqua Dead cell staining solution (Invitrogen) according to the manufacturer’s instruction. The percentage of dead cells was quantified by flow cytometry using a fluorescence-activated cell sorter (LSRII; Becton-Dickinson), and data were analyzed by using FloJo software as described (5, 43).
Animal Surgery.
All mouse experiments were housed and handled in accordance with the Subcommittee on Research Animal Care of the Ohio State University guidelines and have been approved by the Institutional Review Board. Six-week-old female athymic nu/nu mice (Charles River Laboratories) were used for all studies. Athymic nude mice bearing intracranial GBM30 tumors were treated with bortezomib (0.8 mg/kg) intraperitoneally twice a week for the duration of the study and with oHSV on day 10 after tumor implantation. For NK cell depletion experiments, 100 L of 1 mL of Asialo–GM1 antibody combined with 1 mL of water (Wako; 986-10001) was injected intraperitoneally 2 d before oHSV injection and twice a week thereafter for the duration of the study. For NK cell adjuvant experiments, mice were intratumorally injected with various number of primary NK cells 3 d after oHSV injection and monitored for survival as per the Ohio State University Institutional Animal Care and Use Committee protocol.
Supplementary Material
Acknowledgments
This work was supported in part by a National Science Foundation award (Y.K. and A.F.); National Institutes of Health Grants CA150153, CA163205, NS045758, and NS064607 (to B.K.); the Basic Science Research Program through the National Research Foundation of Korea funded by Ministry of Education Grant NRF-2015R1D1A1A01058702 (to Y.K.); and Konkuk University’s research support program for its faculty on sabbatical leave in 2017 (Y.K.).
Footnotes
The authors declare no conflict of interest.
This article contains supporting information online at www.pnas.org/lookup/suppl/doi:10.1073/pnas.1715295115/-/DCSupplemental.
References
- 1.Kanai R, Wakimoto H, Cheema T, Rabkin SD. Oncolytic herpes simplex virus vectors and chemotherapy: Are combinatorial strategies more effective for cancer? Future Oncol. 2010;6:619–634. doi: 10.2217/fon.10.18. [DOI] [PMC free article] [PubMed] [Google Scholar]
- 2.Cvek B, Dvorak Z. The ubiquitin-proteasome system (UPS) and the mechanism of action of bortezomib. Curr Pharm Des. 2011;17:1483–1499. doi: 10.2174/138161211796197124. [DOI] [PubMed] [Google Scholar]
- 3.Yoo J, et al. Bortezomib-induced unfolded protein response increases oncolytic HSV-1 replication resulting in synergistic antitumor effects. Clin Cancer Res. 2014;20:3787–3798. doi: 10.1158/1078-0432.CCR-14-0553. [DOI] [PMC free article] [PubMed] [Google Scholar]
- 4.Hui B, et al. Proteasome inhibitor interacts synergistically with autophagy inhibitor to suppress proliferation and induce apoptosis in hepatocellular carcinoma. Cancer. 2012;118:5560–5571. doi: 10.1002/cncr.27586. [DOI] [PubMed] [Google Scholar]
- 5.Yoo J, et al. Bortezomib treatment sensitizes oncolytic HSV-1 treated tumors to NK cell immunotherapy. Clin Cancer Res. 2016;22:5265–5276. doi: 10.1158/1078-0432.CCR-16-1003. [DOI] [PMC free article] [PubMed] [Google Scholar]
- 6.Friedman A, Tian J, Fulci G, Chiocca E, Wang J. Glioma virotherapy: Effects of innate immune suppression and increased viral replication capacity. Cancer Res. 2006;66:2314–2319. doi: 10.1158/0008-5472.CAN-05-2661. [DOI] [PubMed] [Google Scholar]
- 7.Alvarez-Breckenridge C, et al. NK cells impede glioblastoma virotherapy through NKp30 and NKp46 natural cytotoxicity receptors. Nat Med. 2012;18:1827–1834. doi: 10.1038/nm.3013. [DOI] [PMC free article] [PubMed] [Google Scholar]
- 8.Quail D, Joyce J. The microenvironmental landscape of brain tumors. Cancer Cell. 2017;31:326–341. doi: 10.1016/j.ccell.2017.02.009. [DOI] [PMC free article] [PubMed] [Google Scholar]
- 9.Kim Y, Jeon H, Othmer H. The role of the tumor microenvironment in Glioblastoma: A mathematical model. IEEE Trans Biomed Eng. 2017;64:519–527. doi: 10.1109/TBME.2016.2637828. [DOI] [PMC free article] [PubMed] [Google Scholar]
- 10.Kurozumi K, et al. Effect of tumor microenvironment modulation on the efficacy of oncolytic virus therapy. J Natl Cancer Inst. 2007;99:1768–1781. doi: 10.1093/jnci/djm229. [DOI] [PubMed] [Google Scholar]
- 11.Haseley A, et al. Extracellular matrix protein CCN1 limits oncolytic efficacy in glioma. Cancer Res. 2012;72:1353–1362. doi: 10.1158/0008-5472.CAN-11-2526. [DOI] [PMC free article] [PubMed] [Google Scholar]
- 12.Thorne A, et al. Role of cysteine-rich 61 protein (CCN1) in macrophage-mediated oncolytic herpes simplex virus clearance. Mol Ther. 2014;22:1678–1687. doi: 10.1038/mt.2014.101. [DOI] [PMC free article] [PubMed] [Google Scholar]
- 13.Meisen W, et al. The impact of macrophage- and microglia-secreted TNF on oncolytic HSV-1 therapy in the glioblastoma tumor microenvironment. Clin Cancer Res. 2015;21:3274–3285. doi: 10.1158/1078-0432.CCR-14-3118. [DOI] [PMC free article] [PubMed] [Google Scholar]
- 14.Rezvani K, Rouce R. The application of natural killer cell immunotherapy for the treatment of cancer. Front Immunol. 2015;6:578. doi: 10.3389/fimmu.2015.00578. [DOI] [PMC free article] [PubMed] [Google Scholar]
- 15.Klingemann H. Challenges of cancer therapy with natural killer cells. Cytotherapy. 2015;17:245–249. doi: 10.1016/j.jcyt.2014.09.007. [DOI] [PubMed] [Google Scholar]
- 16.Dahlberg C, Sarhan D, Chrobok M, Duru A, Alici E. Natural killer cell-based therapies targeting cancer: Possible strategies to gain and sustain anti-tumor activity. Front Immunol. 2015;6:605. doi: 10.3389/fimmu.2015.00605. [DOI] [PMC free article] [PubMed] [Google Scholar]
- 17.Herberman R, Ortaldo J. Natural killer cells: Their roles in defenses against disease. Science. 1981;214:24–30. doi: 10.1126/science.7025208. [DOI] [PubMed] [Google Scholar]
- 18.Guillerey C, Huntington N, Smyth M. Targeting natural killer cells in cancer immunotherapy. Nat Immunol. 2016;17:1025–1036. doi: 10.1038/ni.3518. [DOI] [PubMed] [Google Scholar]
- 19.Chen Y, et al. Efficacy of adjuvant chemotherapy combined with immunotherapy with cytokine-induced killer cells for gastric cancer after d2 gastrectomy. Int J Clin Exp Med. 2015;8:7728–7736. [PMC free article] [PubMed] [Google Scholar]
- 20.Krieg S, Ullrich E. Novel immune modulators used in hematology: Impact on NK cells. Front Immunol. 2013;3:388. doi: 10.3389/fimmu.2012.00388. [DOI] [PMC free article] [PubMed] [Google Scholar]
- 21.Sakamoto N, et al. Phase I clinical trial of autologous NK cell therapy using novel expansion method in patients with advanced digestive cancer. J Transl Med. 2015;13:277. doi: 10.1186/s12967-015-0632-8. [DOI] [PMC free article] [PubMed] [Google Scholar]
- 22.Parkhurst M, Riley J, Dudley M, Rosenberg S. Adoptive transfer of autologous natural killer cells leads to high levels of circulating natural killer cells but does not mediate tumor regression. Clin Cancer Res. 2011;17:6287–6297. doi: 10.1158/1078-0432.CCR-11-1347. [DOI] [PMC free article] [PubMed] [Google Scholar]
- 23.Ruggeri L, et al. Effectiveness of donor natural killer cell alloreactivity in mismatched hematopoietic transplants. Science. 2002;295:2097–2100. doi: 10.1126/science.1068440. [DOI] [PubMed] [Google Scholar]
- 24.Miller J, et al. Successful adoptive transfer and in vivo expansion of human haploidentical NK cells in patients with cancer. Blood. 2005;105:3051–3057. doi: 10.1182/blood-2004-07-2974. [DOI] [PubMed] [Google Scholar]
- 25.Tonn T, et al. Treatment of patients with advanced cancer with the natural killer cell line NK-92. Cytotherapy. 2013;15:1563–1570. doi: 10.1016/j.jcyt.2013.06.017. [DOI] [PubMed] [Google Scholar]
- 26.Klingemann H. Are natural killer cells superior CAR drivers? OncoImmunology. 2014;3:e28147. doi: 10.4161/onci.28147. [DOI] [PMC free article] [PubMed] [Google Scholar]
- 27.Glienke W, et al. Advantages and applications of CAR-expressing natural killer cells. Front Pharmacol. 2015;6:21. doi: 10.3389/fphar.2015.00021. [DOI] [PMC free article] [PubMed] [Google Scholar]
- 28.Burns L, et al. IL-2-based immunotherapy after autologous transplantation for lymphoma and breast cancer induces immune activation and cytokine release: A phase I/II trial. Bone Marrow Transplant. 2003;32:177–186. doi: 10.1038/sj.bmt.1704086. [DOI] [PubMed] [Google Scholar]
- 29.Conlon K, et al. Redistribution, hyperproliferation, activation of natural killer cells and CD8 T cells, and cytokine production during first-in-human clinical trial of recombinant human interleukin-15 in patients with cancer. J Clin Oncol. 2015;33:74–82. doi: 10.1200/JCO.2014.57.3329. [DOI] [PMC free article] [PubMed] [Google Scholar]
- 30.Kim P, et al. IL-15 superagonist/IL-15RαSushi-Fc fusion complex (IL-15SA/IL-15RαSu-Fc; ALT-803) markedly enhances specific subpopulations of NK and memory CD8+ T cells, and mediates potent anti-tumor activity against murine breast and colon carcinomas. Oncotarget. 2016;7:16130–16145. doi: 10.18632/oncotarget.7470. [DOI] [PMC free article] [PubMed] [Google Scholar]
- 31.Parameswaran R, et al. Repression of GSK3 restores NK cell cytotoxicity in AML patients. Nat Commun. 2016;7:11154. doi: 10.1038/ncomms11154. [DOI] [PMC free article] [PubMed] [Google Scholar]
- 32.Bachanova V, et al. Clearance of acute myeloid leukemia by haploidentical natural killer cells is improved using IL-2 diphtheria toxin fusion protein. Blood. 2014;123:3855–3863. doi: 10.1182/blood-2013-10-532531. [DOI] [PMC free article] [PubMed] [Google Scholar]
- 33.Young A, Mittal D, Stagg J, Smyth M. Targeting cancer-derived adenosine: New therapeutic approaches. Cancer Discov. 2014;4:879–888. doi: 10.1158/2159-8290.CD-14-0341. [DOI] [PubMed] [Google Scholar]
- 34.Gluck W, et al. Phase I studies of interleukin (IL)-2 and rituximab in B-cell non-Hodgkin’s lymphoma: IL-2 mediated natural killer cell expansion correlations with clinical response. Clin Cancer Res. 2004;10:2253–2264. doi: 10.1158/1078-0432.ccr-1087-3. [DOI] [PubMed] [Google Scholar]
- 35.Vallera D, et al. IL15 trispecific killer engagers (TriKE) make natural killer cells specific to CD33+ targets while also inducing persistence, in vivo expansion, and enhanced function. Clin Cancer Res. 2016;22:3440–3450. doi: 10.1158/1078-0432.CCR-15-2710. [DOI] [PMC free article] [PubMed] [Google Scholar]
- 36.Kohrt H, et al. CD137 stimulation enhances the antilymphoma activity of anti-CD20 antibodies. Blood. 2011;117:2423–2432. doi: 10.1182/blood-2010-08-301945. [DOI] [PMC free article] [PubMed] [Google Scholar] [Retracted]
- 37.Benson D, et al. A phase 1 trial of the anti-KIR antibody IPH2101 in patients with relapsed/refractory multiple myeloma. Blood. 2012;120:4324–4333. doi: 10.1182/blood-2012-06-438028. [DOI] [PMC free article] [PubMed] [Google Scholar]
- 38.Vey N, et al. A phase 1 trial of the anti-inhibitory KIR mAb IPH2101 for AML in complete remission. Blood. 2012;120:4317–4323. doi: 10.1182/blood-2012-06-437558. [DOI] [PubMed] [Google Scholar]
- 39.Nguyen S, et al. HLA-E upregulation on IFN-gamma-activated AML blasts impairs CD94/NKG2A-dependent NK cytolysis after haplo-mismatched hematopoietic SCT. Bone Marrow Transplant. 2009;43:693–699. doi: 10.1038/bmt.2008.380. [DOI] [PubMed] [Google Scholar]
- 40.Tyson R, Stern L, LeVeque R. Fractional step methods applied to a chemotaxis model. J Math Biol. 2000;41:455–475. doi: 10.1007/s002850000038. [DOI] [PubMed] [Google Scholar]
- 41.Yoo JY, et al. Antitumor efficacy of 34.5ENVE: A transcriptionally retargeted and “Vstat120”-expressing oncolytic virus. Mol Ther. 2012;20:287–297. doi: 10.1038/mt.2011.208. [DOI] [PMC free article] [PubMed] [Google Scholar]
- 42.Yoo JY, et al. Copper chelation enhances antitumor efficacy and systemic delivery of oncolytic HSV. Clin Cancer Res. 2012;18:4931–4941. doi: 10.1158/1078-0432.CCR-12-0697. [DOI] [PMC free article] [PubMed] [Google Scholar]
- 43.Bolyard C, et al. BAI1 orchestrates macrophage inflammatory response to HSV infection—Implications for oncolytic viral therapy. Clin Cancer Res. 2017;23:1809–1819. doi: 10.1158/1078-0432.CCR-16-1818. [DOI] [PMC free article] [PubMed] [Google Scholar]
Associated Data
This section collects any data citations, data availability statements, or supplementary materials included in this article.


