Significance
Estimates of migration are important for understanding the dynamics of natural populations. A statistic known as FST is often used to measure levels of genetic differentiation among natural populations. Equations that translate FST into estimates of migration are based on “ideal” populations, which are subject to many simplifying assumptions compared with real populations. Therefore, theoretical estimates of migration might not be realistic. We modeled populations of Atlantic cod in the North Sea and the adjacent Skagerrak region to compare how migration is related to the complexities of real populations, and how actual migration compares with predictions based on theory. Results are intended to help apply population genetic theory to practical situations.
Keywords: Wright’s equation, population dynamics, genetic connectivity, fisheries management, population genetic theory
Abstract
Genetic data are commonly used to estimate connectivity between putative populations, but translating them to demographic dispersal rates is complicated. Theoretical equations that infer a migration rate based on the genetic estimator FST, such as Wright’s equation, FST ≈ 1/(4Nem + 1), make assumptions that do not apply to most real populations. How complexities inherent to real populations affect migration was exemplified by Atlantic cod in the North Sea and Skagerrak and was examined within an age-structured model that incorporated genetic markers. Migration was determined under various scenarios by varying the number of simulated migrants until the mean simulated level of genetic differentiation matched a fixed level of genetic differentiation equal to empirical estimates. Parameters that decreased the Ne/Nt ratio (where Ne is the effective and Nt is the total population size), such as high fishing mortality and high fishing gear selectivity, increased the number of migrants required to achieve empirical levels of genetic differentiation. Higher maturity-at-age and lower selectivity increased Ne/Nt and decreased migration when genetic differentiation was fixed. Changes in natural mortality, fishing gear selectivity, and maturity-at-age within expected limits had a moderate effect on migration when genetic differentiation was held constant. Changes in population size had the greatest effect on the number of migrants to achieve fixed levels of FST, particularly when genetic differentiation was low, FST ≈ 10−3. Highly variable migration patterns, compared with constant migration, resulted in higher variance in genetic differentiation and higher extreme values. Results are compared with and provide insight into the use of theoretical equations to estimate migration among real populations.
Dispersal is fundamental to the dynamics of ecological systems. Individuals may disperse and interact in many complex ways, resulting in population structures that can range from complete panmixia to distinct populations, metapopulations, and isolation-by-distance (1–3). Knowledge of dispersal rates is important for defining units for management. Patterns of dispersal are likely to be stochastic, and factors affecting population-level dispersal rates are complicated and not fully understood (4, 5). Dispersal can be affected by population size, recruitment success, and life history parameters to oceanographic and annual climactic variation (5, 6).
Genetic data are commonly used to estimate connectivity between putative populations, but translating them to demographic dispersal rates is extremely difficult (7). Interpretation of genetic data can be particularly problematic when genetic differentiation is not significantly different from zero, because it is difficult to distinguish between moderate dispersal rates and panmixia (8). Lack of genetic differentiation may be due to high dispersal rates between populations, a lack of statistical power, or insufficient time for differences to accrue among separate groups. There are several indirect formulae that can be used to estimate dispersal (e.g., refs. 9 and 10); one of the most common is FST ≈ 1/(4Nem + 1), hereafter referred to as Wright’s equation (11), where Ne is the effective population size of each population under the island model in migration−drift equilibrium and m is the migration rate, and the effective number of migrants is the product of Ne and m, Me = Nem, implying that the reproductive success of immigrants is equal to residents.
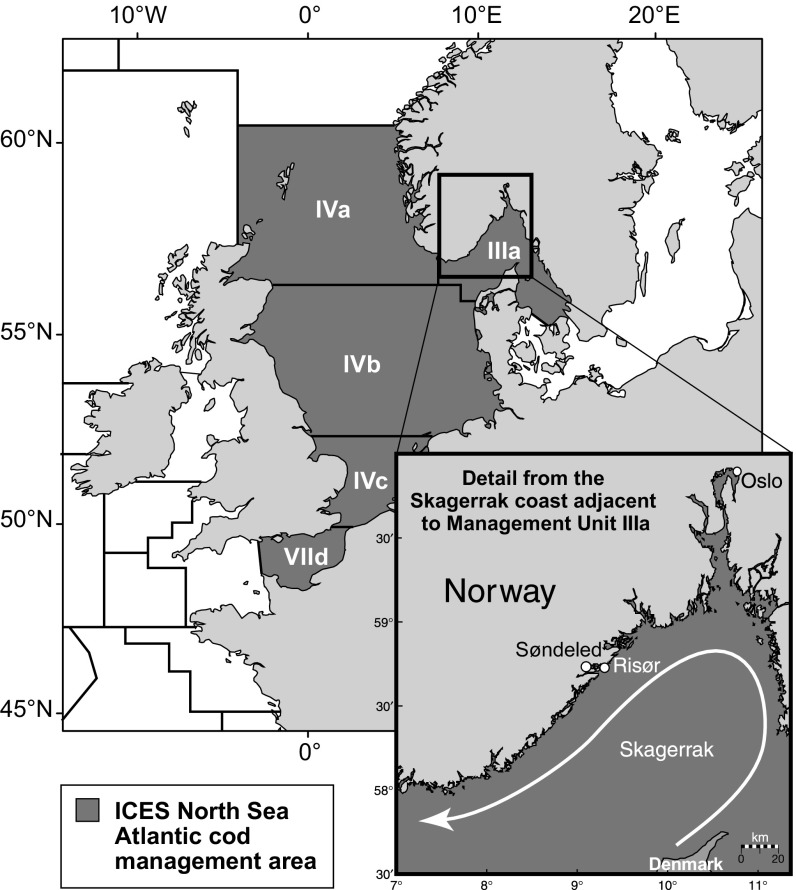
The goal of this study was to examine how characteristics of natural populations and varying patterns of migration affect the relationship between genetic differentiation and demographic connectivity among populations that are exchanging migrants. We compared the relationship between genetic differentiation and migration in simulated age-structured populations with Wright−Fisher populations to explore how well Wright’s equation estimated migration in real populations. Simulations explored the demographic relationships within a particularly well-studied system, Atlantic cod (Gadus morhua) in the North Sea, and two smaller populations on the Norwegian coast in the Skagerrak: a coastal population at Risør, referred to as the outer coast, and a fjord population, Søndeled, referred to as the inner fjord (Fig. 1). Simulated populations were at migration−drift equilibrium, and simulations incorporated 13 microsatellite markers, similar to a study on population structure in this system (12). Connectivity between these two regions has been examined with genetics and tagging (12–15), and research suggests that adults are generally sedentary and migration takes place passively at the larval stage from the North Sea to the Skagerrak, at rates related to the current strength (15). Migration in the other direction has not been observed; therefore migration was modeled unidirectionally from the North Sea to the Skagerrak in most cases, but the effects of bidirectional (two-way) migration was also explored (13, 15). Measured levels of genetic differentiation between the North Sea and the inner fjord and outer coast were in contrast, with low levels of differentiation between the outer coast and the North Sea, FST = 0.0001 to 0.0003, and higher levels of differentiation between the inner fjord and the North Sea, FST = 0.0039 to 0.0051 (12, 14).
Fig. 1.
North Sea management areas and Skagerrak region; ICES management unit divisions and subdivisions in the NE Atlantic; areas IV (a, b, and c), VIId, and IIIa are included in the North Sea Atlantic cod management area. (Inset) Map of the Skagerrak coast, with the predominant ocean current indicated by the curved arrow, and the location of the inner fjord (Søndeled) and outer (Risør) coast. Adapted with permission from ref. 37.
Results and Discussion
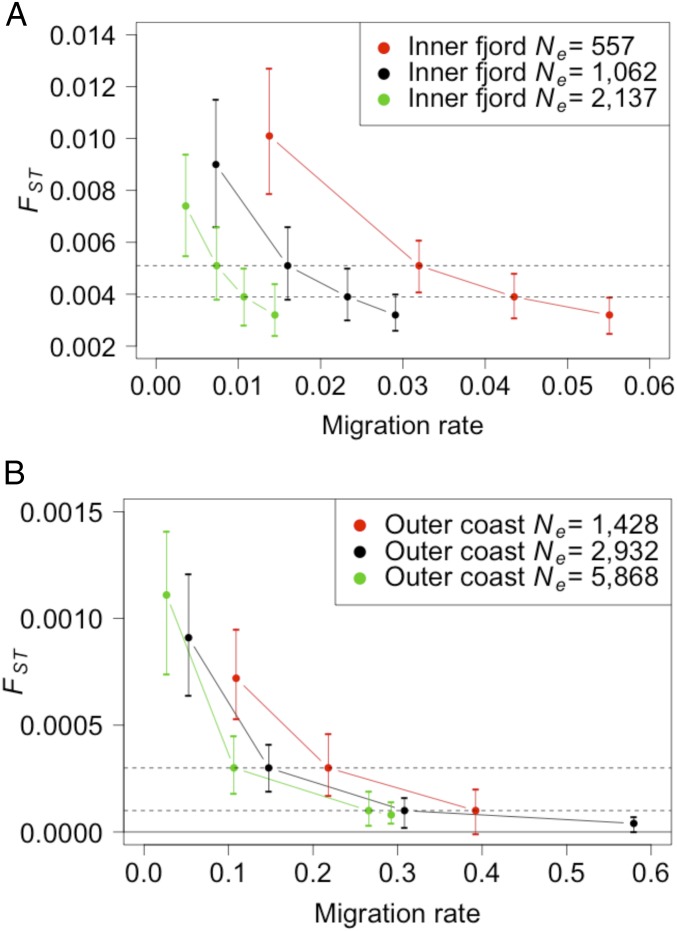
Simulation results yielded a range of 55 to 80 age-0-y migrants per year (M0) from the North Sea to the inner fjord, based on empirical estimates of differentiation (FST; Table 1). This represented a small proportion of the age-0-y class of the inner fjord population (N0 = 3,438), or 17 to 25 effective migrants per generation (Me) (Fig. 2 and SI Appendix, Table S1). The range of M0 from the North Sea to the outer coast represented a larger contribution of the outer coast age-0-y class, M0 = 1,400 to 2,925 migrants per year out of N0 = 9,492 (Me = 433 to 904; Fig. 2 and SI Appendix, Table S1). Increasing the simulated North Sea population size by 5× over the base case sizes resulted in a lower number of migrants required to explain differences between the North Sea and the outer coast; the estimated number of migrants decreased from a range of 1,400 to 2,925 to a range of 1,060 to 2,500 (SI Appendix, Table S1). The resulting range of migration rates (11.3 to 26.6%) suggests that the proportion of migration from the North Sea to the outer coast would be over 10% regardless of the size of the North Sea population (SI Appendix, Table S1).
Table 1.
Empirical levels of genetic differentiation using 13 microsatellite loci, measured by FST, between Atlantic cod samples from two different years of samples (year shown) from the North Sea and the inner fjord and the outer coast (12)
| Location/year | Inner fjord (2005) | Outer coast (2000) |
| N. Sea 2000/2001 | 0.0039 (P = 0.0013) | 0.0003 (P = 0.7022) |
| N. Sea 2002 | 0.0051 (P = 0.0001) | 0.0001 (P = 0.3414) |
North Sea cod were sampled from the German Bight in 2002 and off Hirtshals in 2000, 2001.
Fig. 2.
Visual representation of the mean (with 10% and 90% quantiles) levels of genetic differentiation, under different migration rates from the North Sea to the (A) inner fjord and (B) outer coast (data from SI Appendix, Table S1). Simulations used base case parameterization, with double and half the inner fjord and outer coast populations. The targeted empirical levels of genetic differentiation are shown as dotted horizontal lines, and zero is shown as a solid horizontal line in B. Response to migration is also shown at 25 and 100 migrants per year with the inner fjord (in A) and at 500 and 5,500 migrants per year with the outer coast, except for the smallest population size (in B), and translated into migration rate.
The value of 10% migration is often considered a threshold for demographic connection (16); therefore, these analyses indicate that the North Sea and the outer coast are demographically connected. Observed differences in size and maturity between the North Sea and the outer coast appear contradictory to demographic connectivity (SI Appendix, Fig. S1 and ref. 17). However, similar results have been observed in other marine fish species, e.g., Atka mackerel Pleurogrammus monopterygius in the Aleutian Islands region of Alaska demonstrate growth and maturity differences that have been attributed to diet rather than genetic differentiation (18, 19). Demographic dependence has been found among most Skagerrak outer coast populations and the North Sea (13), but previous analysis excluded the Risør population because it displayed independent dynamics. The current work supports the idea that the outer coast is demographically impacted by larval drift from the North Sea, similar to the other Norwegian coastal populations.
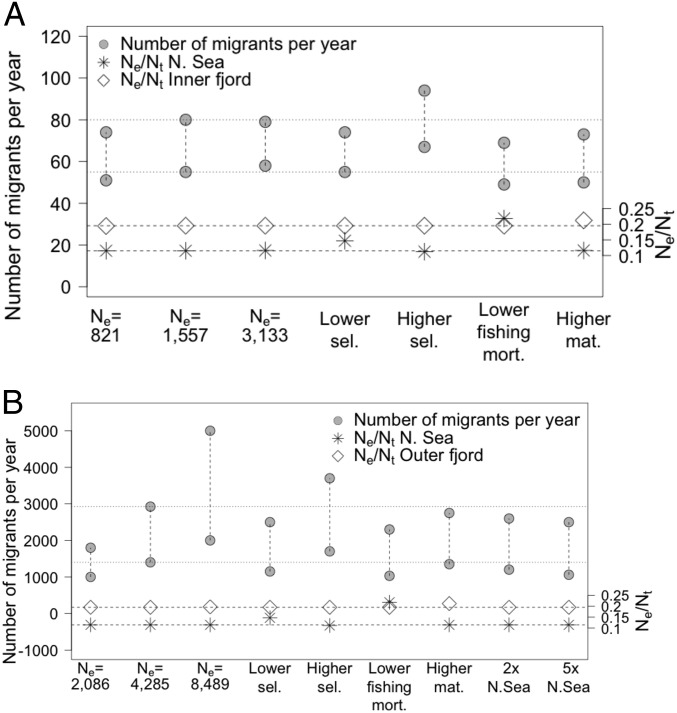
Changes to migration estimates were relatively small in response to sensitivity tests for selectivity, fishing mortality, and maturity (Fig. 3 and SI Appendix, Table S1). The highest relative change occurred under higher fishing selectivity in the North Sea, which increased the estimate of migration to 3,700 for outer coast and 94 for inner fjord simulations (compared with high base case migration estimates of 2,925 and 80 for the outer coast and inner fjord, respectively). The lowest relative change occurred under lower fishing mortality in the North Sea; migration estimates were 1,030 for outer coast and 49 for inner fjord simulations (compared with low base case estimates of 1,400 and 55 for the outer coast and inner fjord, respectively). Results of sensitivity tests that examined the effects of maturity-at-age, fishing mortality, and fishing gear selectivity on the number of migrants required for a fixed level of genetic differentiation (Fig. 3) were driven by how these factors affected the Ne/Nt ratio, where Nt is the population census size. When the Ne/Nt ratio increased in the North Sea population, migrants from that population were more potent vectors of genetic material. In other words, when the Ne/Nt ratio increased in the donor population, fewer migrants were needed for the same level of genetic differentiation (Table 1). This effect was also true when the Ne/Nt ratio increased in the recipient Skagerrak population, because the higher Ne/Nt ratio resulted in more migrants reproducing in the recipient population (Fig. 3). Factors that increased the Ne/Nt ratio were higher maturity-at-age in the Skagerrak population, which can occur under high fishing pressure (e.g., refs. 20 and 21); lower fishing gear selectivity-at-age, 5% rather than 50% quantile values applied to the North Sea population; and lower fishing mortality rate (Fig. 3 and SI Appendix, Table S1). Higher fishing gear selectivity (60% rather than 50% quantiles) had the opposite effect; it increased fishing mortality rates, and decreased the Ne/Nt ratio in the simulated North Sea population, thereby increasing the number of migrants required for fixed levels of genetic differentiation. Higher maturity-at-age increased the number of mature young fish, and was only examined in the recipient populations, but, if higher maturity-at-age were applied to the North Sea or another source population, it would result in a higher Ne/Nt ratio, more genetic connectivity, and lower levels of genetic differentiation. Changes in the census size (double and half) of the outer coast population had a larger effect than did similar changes to the size of the inner fjord on the estimated number of migrants when levels of genetic differentiation were held constant (Fig. 3). This difference reflects the property that, when FST is very low, small errors in FST increase errors in estimating Nem (e.g., ref. 22); the outer coast and the North Sea were characterized by lower levels of genetic differentiation (FST = 0.0001 to 0.0003) than the inner fjord and the North Sea (FST = 0.0039 to 0.0051, Table 1).
Fig. 3.
Sensitivity analyses of the estimated number of migrants between the simulated North Sea and the (A) inner fjord and (B) outer coast required to achieve empirical levels of genetic differentiation (Table 1). The first three sets of circles represent migration for half, equal, and double the estimated inner fjord (in A) and outer coast (in B) population sizes. Proceeding sets of circles indicate migration under lower and higher selectivity (sel.) applied to the North Sea, lower fishing mortality (mort.) in the North Sea, higher maturity (mat.) in the inner fjord and outer coasts, and higher North Sea population size (B only). Dotted lines represent base case migration for comparison. The Ne/Nt ratio is shown at the bottom of each plot; diamonds denote the Skagerrak and asterisks denote the North Sea. Dashed lines represent base case Ne/Nt values.
Increases in mortality rates generally shift the age structure toward the younger, immature age classes, but it is of interest to monitor the number of adults, or mature individuals, Na (23). While increasing mortality results in reduced effective size of the population (Ne), it reduces Na even more, so the ratio of the effective population size to the number of adults, or mature individuals (Ne/Na), actually increases (23). In the current study, Nt included age-0-y fish, which were not subject to the same mortality as adults; therefore, increases in fishing mortality decreased the Ne/Nt ratio (SI Appendix, Table S1).
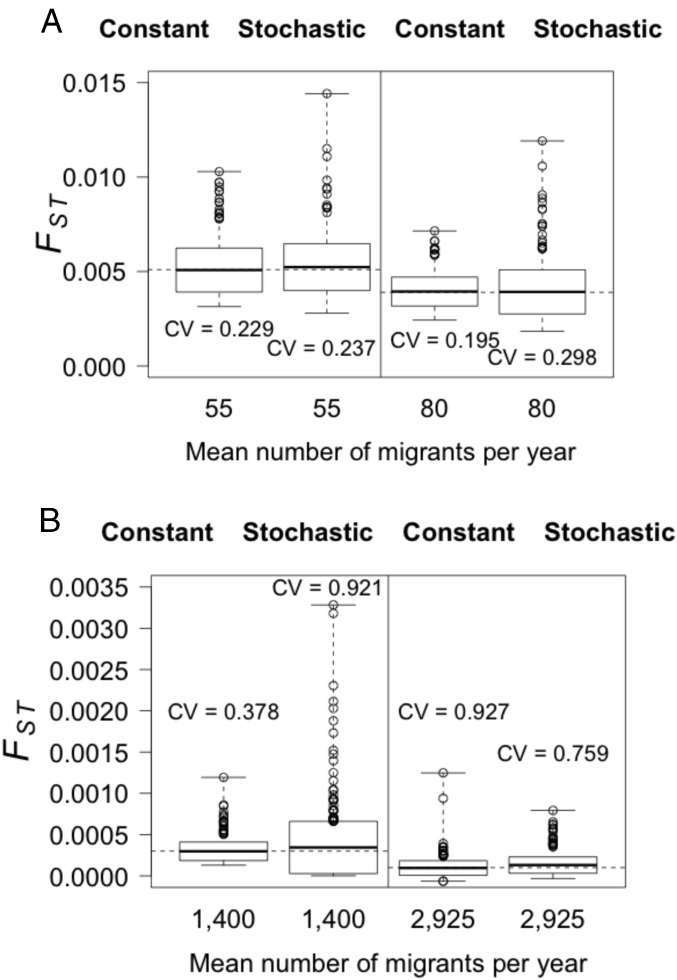
Stochastic migration with a coefficient of variation, CV = 1.31, increased levels of genetic differentiation on the order of 1%, because it resulted in a wider range of extreme FST values above the mean (Fig. 4 and Table 2). This is due to the lognormal distribution of migration used to simulate stochasticity intended to mimic natural processes, with the median level lower than the mean and occasional years of extremely high migration (13). Dispersal is a stochastic process; in fact, stochasticity in dispersal rates may be key to the persistence of metapopulations (24). Simulations with stochastic migration showed that levels of genetic differentiation among populations connected by migration varied around a central tendency, similar to previous studies (25). These complement observations of temporal differences commonly observed in studies of genetic differentiation (26), and may support other theories explaining temporal changes in allele frequencies, such as sweepstakes reproductive success (27). Levels of uncertainty documented here with 100 simulations for each case show that temporal samples provide varying estimates of genetic differentiation whether migration is static (Fig. 5) or stochastic (Fig. 4) when populations are in migration−drift equilibrium, although stochastic migration is more likely in natural systems. In addition, variance typically increased with stochastic migration (Fig. 4). These results support the use of multiple temporal samples to provide a more accurate mean estimate of genetic differentiation among populations than a single estimate (8).
Fig. 4.
Boxplot of genetic differentiation (FST) resulting from constant vs. stochastic migration for North Sea vs. (A) inner fjord and (B) outer coast simulations. Migration was tested at the same levels of migration, and migration rate relative to the recipient population m, that base case parameterizations estimated to be the upper and lower levels of migration: 55 (m = 1.6%) and 80 (m = 2.3%) for the North Sea vs. inner fjord and 1,300 (m = 14.7%) and 2,800 (m = 30.8%) for the North Sea vs. outer coast.
Table 2.
Results of stochastic migration rates, using a lognormal distribution of migrants with a CV of 1.31
| Region | M0 (Me) | FST (mean, 10% and 90% quantiles) |
| Inner fjord | 55 (17) | 0.0052 (0.0039, 0.0067) |
| Inner fjord | 80 (25) | 0.0039 (0.0028, 0.0053) |
| Outer coast | 1,400 (433) | 0.00034 (0.00013, 0.00053) |
| Outer coast | 2,925 (904) | 0.00013 (0.00002, 0.00025) |
Mean FST (10% and 90% quantiles) and mean number of migrants were selected to match base case simulation results for constant migration (55 and 80 for inner fjord simulations and 1,400 and 2,925 for outer coast simulations). The number of migrants (M0) refers to the number of age-0-y migrants per year, and Me represents the effective number of migrants per generation.
Fig. 5.
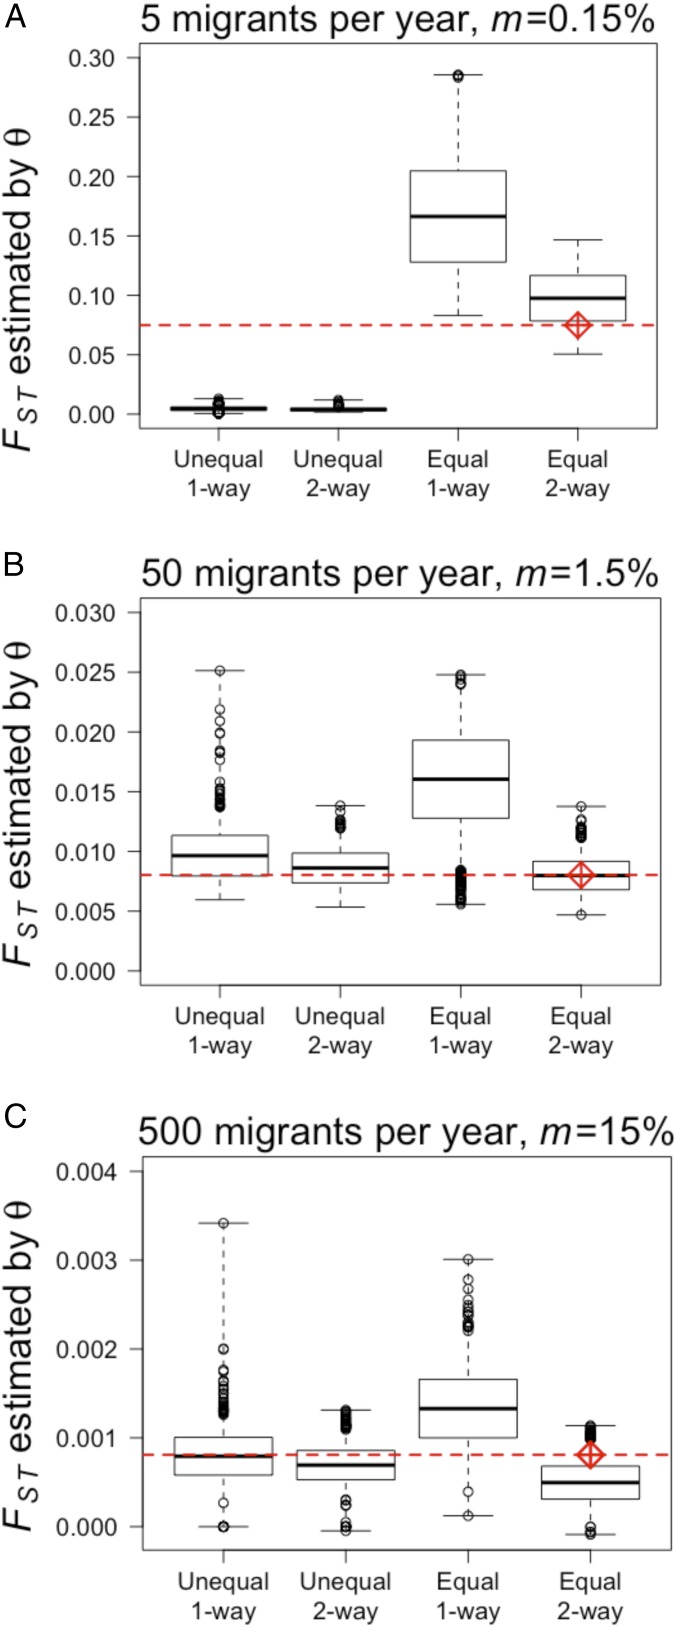
Simulated and theoretical levels of genetic differentiation between two age-structured populations without mutation over 100 simulations, for (A) 5 (m = 0.15%), (B) 50 (m = 1.5%), and (C) 500 (m = 0.15%) migrants per year, where m is calculated with respect to the recipient population. Within each panel, boxplots are (in this order) unequal population sizes (N ≈ 5,400 and N ≈ 65,000) with one-way migration from the large to the small population, unequal population sizes with two-way migration, equal population sizes (two populations size N ≈ 5,500) with one-way migration, and equal population sizes with two-way migration. Red diamonds represent theoretical predictions for theta (33, 35), and the red horizontal line is drawn at the theoretical prediction value. Boxplots show mean, 1 SD, and minimum and maximum values.
Age-structured populations were characterized by higher differentiation than non-age-structured populations, which follows from lower Ne/Nt ratio in age-structured populations if census size is constant (Fig. 6 A and B vs. Fig. 6 C and D). FST predicted by Wright’s equation was within the range of 100 simulations in all cases of age-structured populations when Nem was known (Fig. 5); mean simulated FST values were higher than theoretical estimates when migration was low (Fig. 5A) and lower than theoretical estimates when migration was high (and FST was low, Fig. 5C). Wright’s equation is compared with two-way migration and equal population size scenarios in Fig. 5 because these most closely match the assumptions associated with that equation. One-way migration increased genetic differentiation over two-way (bidirectional) migration regardless of relative population size or migration rate, by decreasing the exchange of genes (Fig. 5).
Fig. 6.
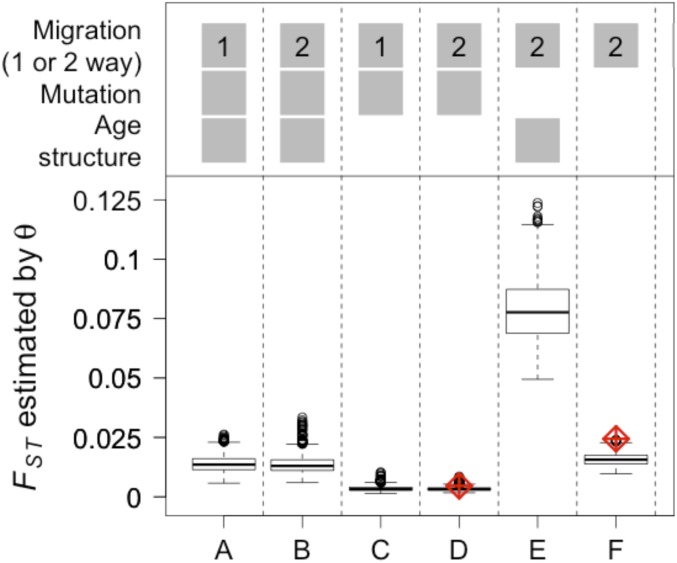
The effect of age structure, mutation, and one vs. two-way migration on FST between two populations of unequal size, reflecting the North Sea and inner fjord best estimates (∼64,000 and 5,400). Five individuals migrated per year in all cases, and these were of age 0 y, m = 0.15%, in age-structured models (cases A, B, and E). The red diamonds represent theoretical predictions of FST (equation 2 of ref. 35).
Mutation, which is typically negligible over short evolutionary time periods, decreased levels of genetic differentiation when mutation rates were similar to migration rate (refs. 28 and 29, Fig. 6B vs. Fig. 6E, and Fig. 6D vs. Fig. 6F), and the finite-island model with mutation and migration (30) predicted FST accurately (Fig. 6D). Therefore, information about relative population sizes and patterns of migration can be used to provide additional insight into the amount of migration between two populations.
Research on genetic population structure in natural populations is often designed to inform management decisions and conservation efforts. Knowledge of genetic divergence (e.g., FST) is insufficient for assessing demographic connectivity (7, 22) for two reasons: (i) Demographic connectivity depends on the migration rate (m) rather than the number of migrants (Nem), and (ii) linking FST to levels of migration (i.e., Wright’s equation) rests on a number of assumptions that may be unrealistic (22). Here, we solved the first problem by including an external estimate of population size N and Ne from simulated populations, as described in SI Appendix, which allowed us to extract a separate estimate of m from the composite estimate of Nem. We solved the second problem by examining robustness to assumptions through computer simulations.
Briefly, our simulations demonstrated high levels of robustness to several key assumptions, including the number of populations (two rather than infinite), their relative sizes (unequal rather than equal), and the direction of migration between them (one-way rather than two-way). We found that FST, with and without stochastic migration, rapidly approached its pseudo drift−migration equilibrium value, as expected when the number of migrants is not extremely low. These characteristics are expected to be fairly common in nature, especially for marine organisms, and facilitate the adoption of Wright’s equation in real populations.
Some factors particular to our model, including maturity-at-age, fishing mortality, and fishing gear selectivity, did have an effect on the number of migrants required to reach the observed FST. However, the effect was driven by how these factors influenced the effective to census population size ratio (Ne/Nt). We demonstrated that reasonable variation in these factors typically resulted in small changes in the estimated migration. These findings suggest a general procedure for dealing with violations of the assumptions associated with Wright’s equation by evaluating their impact on the Ne/Nt ratio and adjusting the estimated number of migrants accordingly. In conclusion, we find that Wright’s equation provides a useful starting point for estimating dispersal from genetic data (FST) in real-world organisms that depart strongly from assumptions of Wright’s equation, provided we have prior information on population sizes and basic biological knowledge of the population system, such as the age or stage of dispersal.
Materials and Methods
The model consisted of a large donor population and two recipient populations with different levels of genetic differentiation (FST) with the donor, and exemplified a fairly common phenomenon in the marine environment: source sink dynamics involving a dispersive larval phase (e.g., refs. 13, 31, and 32). The recipient populations differed in size and genetic differentiation with the donor population; therefore, model runs that explored the relationship between the donor population and the first recipient population were performed separately from runs between the donor population and the second recipient population. The model incorporated age-structured population dynamics, one-way larval migration from the larger to the smaller population, and stochastic mutation at expected rates during the simulation period. In each year, the genetic composition of each new recruit was generated by randomly selecting (with replacement) one male and one female from the group of spawning fish. Migrants were subject to the same level of fishery selection, fishing mortality, and natural mortality as fish in the recipient population. Mutation was simulated by random draws from a Beta(0.6,1) distribution that were scaled down by 0.01. Migration was determined by varying the number of simulated migrants (M0) until the mean simulated level of genetic differentiation, FST measured by theta, θ (33), fell within observed levels of genetic differentiation (Table 1). The model provided estimates of the level of migration between the North Sea and the Skagerrak and was known within the framework of the operating model; therefore, migration is generally referred to as a known value rather than an estimate.
Base case simulations were always run with two populations, one representing the North Sea and the other representing one of two recipient populations within the Skagerrak region, parameterized based on the Risør archipelago or the adjacent Søndeled fjord (Fig. 1 and SI Appendix, Table S1). The modeled population size of the North Sea population was scaled down by approximately an order of magnitude from the estimated size, for computational reasons (SI Appendix); most runs were performed with a large, but feasible value, ∼6.4 × 10⁴ fish, and sensitivity to the North Sea population size was tested. Base case parameters included best estimates for inner fjord (∼5,400) and outer coast (∼15,000) population sizes and North Sea size of ∼6.4 × 10⁴, as well as population-specific estimates for fishing gear selectivity, fishing mortality, maturity, and natural mortality at age (SI Appendix, Tables S2 and S3). Ages in the model were 0 to 6 y, where age 6 y included all ages 6 y and above. Age was shifted to the previous spring spawning season; age-0-y fish were spawned the previous spring. Census sizes were based on fall surveys. Parameterization of age-specific survival and birth rates were incorporated as in ref. 12.
Sensitivity tests were performed to examine the effect of uncertainty in population size, fishing gear selectivity, fishing mortality, and maturity-at-age on migration when genetic differentiation was fixed at empirical values (Table 1). The Beverton−Holt recruitment equation incorporated initial biomass and recruitment; therefore, population dynamics were density-dependent. Constant mean stock size facilitated interpretation of sensitivity tests, so that only one variable was changed at a time. Half and double the size of simulated Skagerrak inner fjord and outer coast populations were tested to examine the effect on population size. Sensitivity to larger North Sea population sizes was tested by increasing the simulated size of the North Sea population to approximately double and 5 times the base case size, while the outer coast population was held constant at its base case size. Arbitrarily lower and higher levels of migration than those required to achieve empirical levels of genetic differentiation (25 and 100 for inner fjord simulations and 500 and 5,500 for outer coast simulations) were also applied to each population size to assess a wider range of sensitivity to migration (Fig. 2). The effects of a range of fishing gear selectivity (the probability of fish being retained in fishing gear at a given age) for the North Sea were examined by replacing mean selectivity with 5% and 60% quantile values. Quantiles 65% and higher resulted in such high mortality on ages 1 y and above that the population was not viable (SI Appendix, Table S2). Results from the high sensitivity tests were limited to simulations in which the North Sea population size did not fall below 10,000 fish. The simulated North Sea fishing mortality rate was reduced to a greater extent than recommended by International Council for the Exploration of the Sea (ICES) in 2008 of 0.4 y−1, from 0.75 y−1 to 0.12 y−1, while holding stock sizes constant (34). The mean estimate of maturity-at-age of Skagerrak cod was replaced with the upper 95% quantiles for maturity-at-age to examine the effect of a higher proportion of spawning individuals, and was calculated using raw maturity data (12) and assuming that maturity data are binomially distributed (SI Appendix, Table S2).
Stochastic migration of larvae from the North Sea to the Skagerrak has been documented (13). The effect of stochastic versus constant migration was quantified by comparing base case model runs with the same number of migrants in each year to runs with a lognormal distribution of migrants. Lognormal distributions with CV = 1.31 were selected to have a mean number of migrants equal to that of their constant migration counterparts (Fig. 4 and SI Appendix, Eq. 5).
A series of simulations compared the effect of age structure, one- vs. two-way migration, equal vs. unequal population sizes, and mutation during the simulation period with that of a simplified model, in which there is only one age, no mutation, and two-way migration. In these simulations (Fig. 6), there were two populations, whose sizes reflected the base case for the North Sea and inner fjord, there were five migrants per year, and population sizes were ∼5,400 and ∼6.4 × 10⁴, with migration from the larger to the smaller population. Simulations were also run with no mutation and with 5, 50, and 500 migrants per year to examine how different levels of migration affected the relationship between simulated and predicted results (Fig. 5). A version of Wright’s equation (equation 2 of ref. 35, with mutation considered negligible),
was used to predict theta for n = 2 populations.
We define the migration rate, m, for a particular (recipient) population as m = M/N, where M is the number of migrants, and N is the population size of the population of interest. This equation assumes that migration takes place randomly among all age classes, and that migration is one-directional. Migration of a single age class x is defined relative to the size of that age class in the population, mx = Mx/Nx. Most simulations were performed with one-way migration, and migration was presented relative to the Skagerrak, or smaller, population, unless specified otherwise. In the base case of unequal populations, migration for the smaller population (outer coast), m = 1,400/9,492 = 14.7%.
In the simple Wright island model, the effective number of migrants per generation can be represented as Me = Nem. When generations overlap, the number of juveniles in the population per year is N0, and the effective population size per generation (Ne) is then a complicated function of N0 since it also involves the lifetime variance in reproductive success (36). However, under the assumption that survival and reproduction are the same for immigrant and native juveniles, this variance remains unchanged whether an individual is a juvenile migrant, M0, or a member of the age-0-y class, N0. The ratio M0/Me must then equal N0/Ne, so that Me = M0Ne/N0. As a numerical example (SI Appendix, Table S1, first line): M0 = 55 and Ne/N0 = (Ne/Nt)/(Nt/N0) = 0.195*5,444/3,438 = 0.309, so that Me = 55*0.309 = 17, where * indicates multiplication. When M0 = 5 and the population structure remains the same, Me = 5*0.309 = 1.54, and using this quantity in the theoretical formula for FST we predict FST = 1/(1 + 4Me(2/(2 − 1))) = 0.075, which is the value represented by the red diamond and dotted line in Fig. 5A.
Supplementary Material
Acknowledgments
Fred Allendorf, Eric C. Anderson, Matt Jay, Kim Rand, Vladimir Minin, Tore Schweder, Asa Sourdiffe, Robin Waples, and Rebecca White provided technical support and useful feedback on the manuscript. Funding was provided by the Centre for Ecological and Evolutionary Synthesis, Oslo, Norway, and the National Oceanographic and Atmospheric Administration, US Department of Commerce.
Footnotes
The authors declare no conflict of interest.
This article contains supporting information online at www.pnas.org/lookup/suppl/doi:10.1073/pnas.1800096115/-/DCSupplemental.
References
- 1.Levin S. Dispersion and population interactions. Am Nat. 1974;108:207–228. [Google Scholar]
- 2.Rousset F. Genetic differentiation and estimation of gene flow from F-statistics under isolation by distance. Genetics. 1997;145:1219–1228. doi: 10.1093/genetics/145.4.1219. [DOI] [PMC free article] [PubMed] [Google Scholar]
- 3.Hanski I. Metapopulation dynamics. Nature. 1998;396:41–49. [Google Scholar]
- 4.Wysham DB, Hastings A. Sudden shifts in ecological systems: Intermittency and transients in the coupled Ricker population model. Bull Math Biol. 2008;70:1013–1031. doi: 10.1007/s11538-007-9288-8. [DOI] [PubMed] [Google Scholar]
- 5.Hastings A. Timescales, dynamics, and ecological understanding. Ecology. 2010;91:3471–3480. doi: 10.1890/10-0776.1. [DOI] [PubMed] [Google Scholar]
- 6.Hastings A. Transients: The key to long-term ecological understanding? Trends Ecol Evol. 2004;19:39–45. doi: 10.1016/j.tree.2003.09.007. [DOI] [PubMed] [Google Scholar]
- 7.Lowe WH, Allendorf FW. What can genetics tell us about population connectivity? Mol Ecol. 2010;19:3038–3051. doi: 10.1111/j.1365-294X.2010.04688.x. [DOI] [PubMed] [Google Scholar]
- 8.Waples R. Separating the wheat from the chaff: Patterns of genetic differentiation in high gene flow species. Heredity. 1998;89:438–450. [Google Scholar]
- 9.Slatkin M. Inbreeding coefficients and coalescence times. Genet Res. 1991;58:167–175. doi: 10.1017/s0016672300029827. [DOI] [PubMed] [Google Scholar]
- 10.Hössjer O, Jorde PE, Ryman N. Quasi equilibrium approximations of the fixation index under neutrality: The finite and infinite island models. Theor Popul Biol. 2013;84:9–24. doi: 10.1016/j.tpb.2012.11.005. [DOI] [PubMed] [Google Scholar]
- 11.Wright S. Evolution in Mendelian populations. Genetics. 1931;16:97–159. doi: 10.1093/genetics/16.2.97. [DOI] [PMC free article] [PubMed] [Google Scholar]
- 12.Knutsen H, et al. Are low but statistically significant levels of genetic differentiation in marine fishes ‘biologically meaningful’? A case study of coastal Atlantic cod. Mol Ecol. 2011;20:768–783. doi: 10.1111/j.1365-294X.2010.04979.x. [DOI] [PubMed] [Google Scholar]
- 13.Stenseth NC, et al. Ecological and genetic impact of Atlantic cod larval drift in the Skagerrak. Proc Biol Sci. 2006;273:1085–1092. doi: 10.1098/rspb.2005.3290. [DOI] [PMC free article] [PubMed] [Google Scholar]
- 14.Knutsen H, et al. Transport of North Sea cod larvae into the Skagerrak coastal populations. Proc Biol Sci. 2004;271:1337–1344. doi: 10.1098/rspb.2004.2721. [DOI] [PMC free article] [PubMed] [Google Scholar]
- 15.Rogers LA, Olsen EM, Knutsen H, Stenseth NC. Habitat effects on population connectivity in a coastal seascape. Mar Ecol Prog Ser. 2014;511:153–163. [Google Scholar]
- 16.Palsbøll PJ, Bérubé M, Allendorf FW. Identification of management units using population genetic data. Trends Ecol Evol. 2007;22:11–16. doi: 10.1016/j.tree.2006.09.003. [DOI] [PubMed] [Google Scholar]
- 17.Heath MR, Kunzlik PA, Gallego A, Holmes SJ, Wright PJ. A model of meta-population dynamics for North Sea and West of Scotland cod–The dynamic consequences of natal fidelity. Fish Res. 2008;93:92–116. [Google Scholar]
- 18.Canino MF, Spies I, Lowe SA, Grant WS. Highly discordant nuclear and mitochondrial DNA diversities in Atka mackerel. Mar Coast Fish. 2010;2:375–387. [Google Scholar]
- 19.Rand K, Beauchamp D, Lowe S. Longitudinal growth differences and the influence of diet quality on Atka mackerel of the Aleutian Islands, Alaska: Using a bioenergetics model to explore underlying mechanisms. Mar Coast Fish. 2010;2:362–374. [Google Scholar]
- 20.Law R. Fishing, selection, and phenotypic evolution. ICES J Mar Sci. 2000;57:659–668. [Google Scholar]
- 21.Chuwen B, Potter I, Hall N, Hoeksema S, Laurenson L. Changes in catch rates and length and age at maturity, but not growth, of an estuarine plotosid (Cnidoglanis macrocephalus) after heavy fishing. Fish Bull. 2011;109:247–260. [Google Scholar]
- 22.Whitlock MC, McCauley DE. Indirect measures of gene flow and migration: FST not equal to 1/(4Nm + 1) Heredity (Edinb) 1999;82:117–125. doi: 10.1038/sj.hdy.6884960. [DOI] [PubMed] [Google Scholar]
- 23.Waples RS. Life-history traits and effective population size in species with overlapping generations revisited: The importance of adult mortality. Heredity (Edinb) 2016;117:241–250. doi: 10.1038/hdy.2016.29. [DOI] [PMC free article] [PubMed] [Google Scholar]
- 24.Williams PD, Hastings A. Stochastic dispersal and population persistence in marine organisms. Am Nat. 2013;182:271–282. doi: 10.1086/671059. [DOI] [PubMed] [Google Scholar]
- 25.Taylor B, Chivers S, Sexton S, Dizon A. Evaluating dispersal estimates using mtDNA data: Comparing analytical and simulation approaches. Conserv Biol. 2000;14:1287–1297. [Google Scholar]
- 26.Skoglund P, Sjödin P, Skoglund T, Lascoux M, Jakobsson M. Investigating population history using temporal genetic differentiation. Mol Biol Evol. 2014;31:2516–2527. doi: 10.1093/molbev/msu192. [DOI] [PMC free article] [PubMed] [Google Scholar]
- 27.Hedgecock D. Does variance in reproductive success limit effective population sizes of marine organisms? In: Beaumont AR, editor. Genetics and Evolution of Aquatic Organisms. Chapman Hall; London: 1994. pp. 122–134. [Google Scholar]
- 28.O’Reilly PT, Canino MF, Bailey KM, Bentzen P. Inverse relationship between F and microsatellite polymorphism in the marine fish, walleye pollock (Theragra chalcogramma): Implications for resolving weak population structure. Mol Ecol. 2004;13:1799–1814. doi: 10.1111/j.1365-294X.2004.02214.x. [DOI] [PubMed] [Google Scholar]
- 29.Ryman N, Leimar O. Effect of mutation on genetic differentiation among nonequilibrium populations. Evolution. 2008;62:2250–2259. doi: 10.1111/j.1558-5646.2008.00453.x. [DOI] [PubMed] [Google Scholar]
- 30.Cockerham CC, Weir BS. Correlations, descent measures: Drift with migration and mutation. Proc Natl Acad Sci USA. 1987;84:8512–8514. doi: 10.1073/pnas.84.23.8512. [DOI] [PMC free article] [PubMed] [Google Scholar]
- 31.Bode M, Bode L, Armsworth PR. Larval dispersal reveals regional sources and sinks in the Great Barrier Reef. Mar Ecol Prog Ser. 2006;308:17–25. [Google Scholar]
- 32.Chen K, et al. Reconstructing source-sink dynamics in a population with a pelagic dispersal phase. PLoS One. 2014;9:e95316. doi: 10.1371/journal.pone.0095316. [DOI] [PMC free article] [PubMed] [Google Scholar]
- 33.Weir BS, Cockerham CC. Estimating F-Statistics for the analysis of population structure. Evolution. 1984;38:1358–1370. doi: 10.1111/j.1558-5646.1984.tb05657.x. [DOI] [PubMed] [Google Scholar]
- 34.International Council for the Exploration of the Sea 2012. Report of the working group on the assessment of demersal stocks in the North Sea and Skagerrak (WGNSSK), 4–10 May 2011 (Int Counc Explor Sea, Copenhagen), ICES CM 2011/ACOM:13.
- 35.Waples RS, Gaggiotti O. What is a population? An empirical evaluation of some genetic methods for identifying the number of gene pools and their degree of connectivity. Mol Ecol. 2006;15:1419–1439. doi: 10.1111/j.1365-294X.2006.02890.x. [DOI] [PubMed] [Google Scholar]
- 36.Hill WG. A note on effective population size with overlapping generations. Genetics. 1979;92:317–322. doi: 10.1093/genetics/92.1.317. [DOI] [PMC free article] [PubMed] [Google Scholar]
- 37.Knutsen H, Jorde PE, André C, Stenseth NC. Fine-scaled geographical population structuring in a highly mobile marine species: The Atlantic cod. Mol Ecol. 2003;12:385–394. doi: 10.1046/j.1365-294x.2003.01750.x. [DOI] [PubMed] [Google Scholar]
Associated Data
This section collects any data citations, data availability statements, or supplementary materials included in this article.


