Abstract
Objective/Hypothesis
Previous reports have documented the feasibility to utilize electrocochleography (ECochG) to acoustic signals to assess trauma caused during cochlear implantation. The hypothesis is that intraoperative round window ECochG before and after electrode insertion will help predict postoperative hearing preservation outcomes in cochlear implant recipients.
Study Design
Prospective cohort study
Methods
Intraoperative round window ECochG responses were collected from thirty-one cochlear implant recipients (14 children and 17 adults) immediately prior to and just after electrode insertion. Hearing preservation was determined by postoperative changes in behavioral thresholds.
Results
On average, the post-insertion response was smaller than the pre-insertion by an average of 4 dB across frequency. However, in some cases (12/31) the response increased after insertion.. The subsequent hearing loss was greater than the acute loss in the ECochG, averaging 22 dB across the same frequency range (250–1000 Hz). There was no correlation between the change in the ECochG response and the corresponding change in audiometric threshold.
Conclusion
Intraoperative ECochG is a sensitive method for detecting electrophysiologic changes during implantation but had limited prognostic value regarding hearing preservation in the current conventional cochlear implant patient population where hearing preservation was not intended.
Keywords: Electrocochleography, Intraoperative monitoring, Cochlear physiology, Cochlear implants, Hearing preservation
INTRODUCTION
Many factors in hearing preservation cochlear implantation remain a mystery. To shed light on the mechanisms of hearing loss during surgery and also to improve hearing preservation rates, intraoperative monitoring strategies have been proposed1–3. The underlying idea is that that real-time measures may guide the surgeon to optimize the electrode insertion process. However, electrically evoked compound action potentials (ECAPs) as implemented in most modern cochlear implant devices (NRT®, NRI®, ART®) have failed to demonstrate significant correlations with electrode positions, mapping parameters, residual hearing, or speech outcomes4.
An alternative approach is to record cochlear responses to acoustic stimulation1. Since most cochlear implant candidates have detectable levels of residual hearing, and histologic studies were able to confirm the presence of hair cells in this patient population5, the use of traditional electrocochleography (ECochG) from the round window and within the cochlea was explored.
Early experiments demonstrated the potential feasibility in an animal model6 using various electrode types, hearing loss scenarios, stimulus parameters, and timing variables7–9. Animal experiments utilizing neurotoxins have helped to characterize hair cell and neural contributions to the ECochG signal10. These animal results were translated to humans during cochlear implantation, where robust early auditory potentials were efficiently collected in the vast majority of conventional cochlear implant recipients11–14, even in patients with audiometrically documented profound levels of sensorineural hearing loss. Placement of the recording electrode within scala tympani further improved the signal-to-noise ratio with even larger potentials as compared to the round window recordings15. Thus, ECochG measurements appear to be a viable tool to ultimately allow for real-time monitoring during the electrode insertion process, both in conventional cochlear implant recipients as well as in candidates where hearing preservation is intended.
Additionally, a high degree of correlation between the magnitude of these recordings and the subsequent speech perception performance in adults was found12,13. Specifically, the overall magnitude of RW ECochG was shown to account for roughly 40 percent of the variance observed in postoperative adult CI outcomes, and 32% in a pediatric group. However, the correlation between intraoperative ECochG measures of the effects of implantation on postoperative hearing outcomes remains unclear. Previous animal work demonstrated that the levels of postoperative hearing loss measured about four weeks post-surgically were generally underestimated by measures obtained during the procedure16. Some human data show intraoperative ECochG recording to have a useful role in hearing preservation17, but other reports show relatively little correlation between ECochG changes and hearing outcomes2,18. Thus, the present work aims to correlate intraoperative round window ECochG before and after electrode insertion with postoperative residual hearing outcomes in cochlear implant recipients.
MATERIALS & METHODS
Subjects
Thirty-one subjects undergoing CI surgery were enrolled and had ECochG recordings performed immediately before and after electrode insertion. All procedures were approved by the study institution’s institutional review board. All cochlear implant patients were eligible for inclusion, with exceptions for those undergoing revision surgeries and non-English speaking patients. Informed consent was obtained from each subject. Tables 1 and 2 provide an overview of all subjects included.
Table I.
Demographic and surgical characteristics of the study population.
| Characteristic | Count or Average | Percent Total or SD |
|---|---|---|
| Sex | ||
| Male | 13 | 42% |
| Female | 18 | 58% |
|
| ||
| Age at implantation (years) | ||
| Adults (n = 17) | 59.4 | 17.3 |
| Children (n = 14) | 4.1 | 2.3 |
|
| ||
| Surgery | ||
| Surgeon 1 | 10 | 32% |
| Surgeon 2 | 21 | 68% |
|
| ||
| Insertion Method | ||
| Round window | 11 | 35% |
| Cochleostomy | 20 | 65% |
|
| ||
| Surgical Complications | ||
| Bent tip on initial insertion | 1 | 3% |
| Back-up device required; mild gusher | 1 | 3% |
|
| ||
| Electrode Brand and Type | ||
| Cochlear Contour Advance | 15 | 48% |
| Cochlear Slim Straight | 1 | 3% |
| MED-EL Concert Standard | 11 | 35% |
| MED-EL Concert Medium | 2 | 6% |
| MED-EL Flex EAS | 1 | 3% |
| ABC 90K | 1 | 3% |
Table II.
Data on all 31 patients including the pure tone thresholds pre and postoperatively as well as the ECoG results prior to electrode insertion as well as immediately thereafter. The subjects are separated into 3 main groups based on which electrode was utilized. Specifically, subjects either received limited insertion lengths using a free fitting approach (hearing preservation group, HP), a standard MED-EL device featuring a long electrode insertion of 31.5 mm (Lateral Wall group), or insertion of a pre-formed Cochlear Corporation Contour Advance electrode (Preformed group). Mean changes for both pure tone hearing as well as ECoG measures between groups did not reach statistically significant levels.
| Group | Subject | Surgery | PTA (250, 500, 1000) | 4-Tone ECoG | |||||||||
|---|---|---|---|---|---|---|---|---|---|---|---|---|---|
| Case | Age | Gender | Manufacturer | Electrode | HP | Scalar Opening | Pre | Post | Change | Pre | Post | Change | |
| HP | 31 | 6.7 | Female | Cochlear | 422 | Yes | Cochleostomy | 68 | 75 | 7 | −17 | −18 | 1 |
| 1 | 70.9 | Male | MED-EL | Flex EAS | Yes | Round Window | 23 | 100 | 77 | 8 | 11 | −3 | |
| 27 | 59.0 | Female | MED-EL | Medium | Yes | Round Window | 63 | 112 | 48 | 15 | 9 | 6 | |
| 30 | 55.0 | Male | MED-EL | Medium | Yes | Round Window | 85 | 117 | 32 | −11 | −8 | −3 | |
|
| |||||||||||||
| 13 | 8.7 | Female | Advanced Bionics | 1J | No | Cochleostomy | 117 | 120 | 3 | 16 | 13 | 3 | |
|
| |||||||||||||
| Preformed | 2 | 7.2 | Female | Cochlear | Contour Advance | No | Cochleostomy | 52 | 68 | 17 | 9 | 7 | 2 |
| 4 | 1.8 | Male | Cochlear | Contour Advance | No | Cochleostomy | 117 | 120 | 3 | 1 | −3 | 4 | |
| 6 | 75.8 | Male | Cochlear | Contour Advance | No | Cochleostomy | 57 | 100 | 43 | 9 | −16 | 25 | |
| 9 | 3.3 | Male | Cochlear | Contour Advance | No | Cochleostomy | 92 | 120 | 28 | −1 | −4 | 3 | |
| 11 | 39.6 | Male | Cochlear | Contour Advance | No | Round Window | 83 | 113 | 30 | 28 | 18 | 10 | |
| 15 | 47.1 | Female | Cochlear | Contour Advance | No | Cochleostomy | 82 | 108 | 27 | 8 | 5 | 3 | |
| 16 | 2.4 | Male | Cochlear | Contour Advance | No | Cochleostomy | 97 | 115 | 18 | −4 | −7 | 3 | |
| 17 | 18.2 | Male | Cochlear | Contour Advance | No | Cochleostomy | 115 | 118 | 3 | 5 | −14 | 19 | |
| 18 | 2.7 | Female | Cochlear | Contour Advance | No | Cochleostomy | 93 | 113 | 20 | 5 | 9 | −4 | |
| 19 | 3.4 | Female | Cochlear | Contour Advance | No | Cochleostomy | 88 | 103 | 15 | 8 | −2 | 10 | |
| 21 | 65.6 | Male | Cochlear | Contour Advance | No | Cochleostomy | 72 | 98 | 27 | 3 | 12 | −8 | |
| 23 | 6.0 | Female | Cochlear | Contour Advance | No | Cochleostomy | 78 | 112 | 33 | −14 | −20 | 6 | |
| 25 | 5.6 | Male | Cochlear | Contour Advance | No | Cochleostomy | 78 | 102 | 23 | 3 | −7 | 10 | |
| 26 | 3.6 | Female | Cochlear | Contour Advance | No | Cochleostomy | 73 | 75 | 2 | −9 | −19 | 10 | |
| 29 | 2.9 | Male | Cochlear | Contour Advance | No | Cochleostomy | 87 | 105 | 18 | 0 | 4 | −4 | |
|
| |||||||||||||
| Lateral Wall | 3 | 49.6 | Female | MED-EL | Standard | No | Round Window | 88 | 120 | 32 | 2 | 3 | −1 |
| 5 | 81.0 | Female | MED-EL | Standard | No | Round Window | 68 | 120 | 52 | 17 | 16 | 1 | |
| 7 | 48.4 | Male | MED-EL | Standard | No | Round Window | 108 | 110 | 2 | −2 | 0 | −1 | |
| 8 | 41.6 | Female | MED-EL | Standard | No | Round Window | 90 | 120 | 30 | 32 | 15 | 17 | |
| 10 | 78.4 | Female | MED-EL | Standard | No | Cochleostomy | 120 | 120 | 0 | 9 | 12 | −2 | |
| 12 | 1.1 | Female | MED-EL | Standard | No | Cochleostomy | 80 | 120 | 40 | 0 | −5 | 5 | |
| 14 | 70.1 | Female | MED-EL | Standard | No | Cochleostomy | 85 | 120 | 35 | 5 | 16 | −11 | |
| 20 | 82.3 | Male | MED-EL | Standard | No | Round Window | 72 | 100 | 28 | −5 | −11 | 6 | |
| 22 | 69.3 | Female | MED-EL | Standard | No | Round Window | 58 | 105 | 47 | 17 | 19 | −2 | |
| 24 | 57.6 | Female | MED-EL | Standard | No | Round Window | 118 | 120 | 2 | −8 | −6 | −2 | |
| 28 | 2.4 | Female | MED-EL | Standard | No | Cochleostomy | 115 | 108 | −7 | 34 | 7 | 26 | |
|
| |||||||||||||
| Min | 1.1 | 23.3 | 68.3 | −6.7 | −17.4 | −20.1 | −11.0 | ||||||
| Max | 82.3 | 120.0 | 120.0 | 76.7 | 33.5 | 19.2 | 26.0 | ||||||
| Average | 34.4 | 84.6 | 108.3 | 23.7 | 5.3 | 1.2 | 4.1 | ||||||
| SD | 30.7 | 22.4 | 14.0 | 18.7 | 12.2 | 11.8 | 8.7 | ||||||
Hearing Thresholds and Surgical Factors
Preoperative thresholds were obtained an average of 115±124 days prior to implantation and postoperative thresholds were taken 55±34 days after the surgery. Frequencies where no behavioral responses were obtained were scored at a threshold of 120 dB HL.
ECochG Recordings
The details of the setup have been described elsewhere10. Briefly, a standard transmastoid facial recess approach was used to access the RW. A sterile, disposable monopolar probe (Neurosign, Magstim Co., Wales, UK) was placed on the membranous portion of the RW to serve as the recording device and a Bio-logic Navigator Pro (Natus Medical Inc., San Carlos, CA) was used to deliver stimuli and record responses. Alternating-phase stimuli were tones bursts at 250, 500, 750, and 1000 Hz delivered at 95–110 dB SPL (peak equivalent) through a foam insert via Etymotic microphones (ER-3) in the ipsilateral ear.
After initial recordings at the RW, the recording electrode was removed, the CI implantation was performed, and the recording electrode was returned to a position just outside the round window for post-insertion ECochG. Electrical speaker artifacts were tested by crimping the sound tube.
ECochG Signal Analysis
The ECochG magnitudes were measured as the “total response” (ECochG-TR) sum of significant peaks in the spectrum at the stimulus frequency and its harmonics. Significant responses were those where the peaks exceeded the mean noise level by three standard deviations. The noise level and variance were determined from 4–6 frequency bins near the peak of interest. The response measures were analyzed using custom MATLAB scripts (Natick, MA).
Statistical Analysis
The ECochG responses obtained before and after electrode insertion and the audiometric thresholds measured pre- and postoperatively were compared using repeated measure, 2-way ANOVAs based on stimulus frequency and group (before and after). Other biographical and surgical factors, including age, device and use of the round window or a cochleostomy for the insertion, were investigated using univariate and partial correlations. Further, patients were grouped according to the electrode type. As such, a hearing preservation group comprised of shorter, lateral wall electrodes that have been shown to result in mostly non-traumatic implantations. The other groups consisted of either a long lateral wall electrode (MED-EL Standard array, 31.5 mm), or a preformed array (Contour Advance, Cochlear Corporation). One Advanced Bionics mid-scala device (1J electrode) was not included in either group. The presence of statistically significant differences for both the ECochG and LF-PTA measures was evaluated using 2-tailed t-tests. SPSS version 22 (IBM, Armonk, NY) was used for the statistical analysis.
RESULTS
Table I illustrates demographic and surgical data, hearing threshold changes, and ECochG response changes due to insertion for all 31 implanted subjects.
Examples of Changes in ECochG Response Magnitude After Electrode Insertion
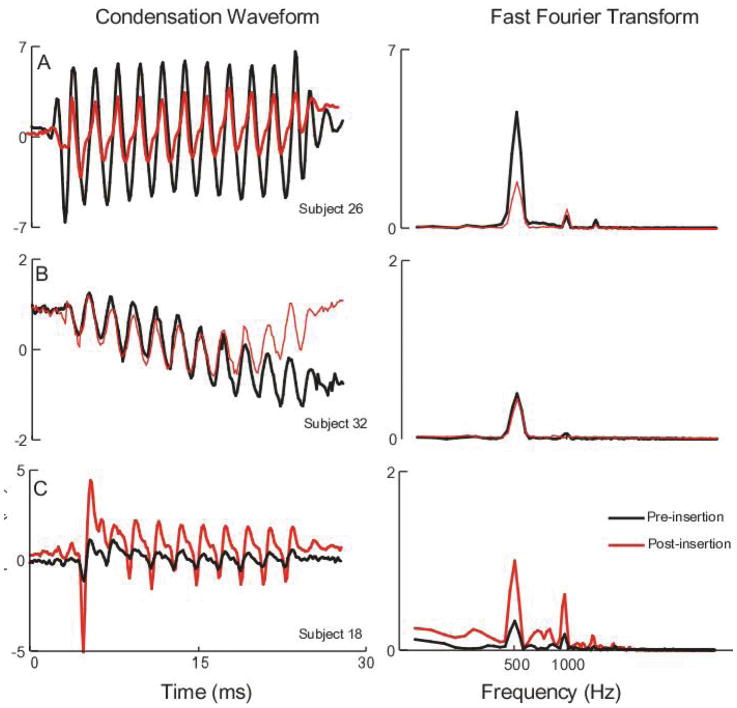
Examples of ECochG patterns observed between the pre- and post-insertion ECochG responses to a 500 Hz tone burst at 107 dB SPL (90 dB nHL) are demonstrated in Figure 1. Figure 1A shows a subject where the response prior to electrode insertion (black) was larger than the post-insertion response (red). This difference was seen in both the time waveform (left) and the spectrum (right). The overall magnitude loss was approximately 50%. This case represents a result that could be indicative of cochlear damage due to electrode placement. Figure 1B illustrates a case where the responses were essentially unchanged immediately after the electrode was placed. This case could represent a non-traumatic insertion. Figure 1C shows a case where the ECochG response increased after electrode insertion. Various possible reasons for this result will be considered in the Discussion.
Figure 1.
Example ECoG responses to 500 Hz tone burst stimuli before and after device insertion. The left panels show the waveform to condensation phase stimuli while the right panels show the spectrum. A: example of a case where the response decreased after insertion; B: Example of a case where the response increased after insertion; C: Example of a case where the response was approximately the same before and after device insertion.
Distributions of Changes in ECochG Response Magnitude After Electrode Insertion
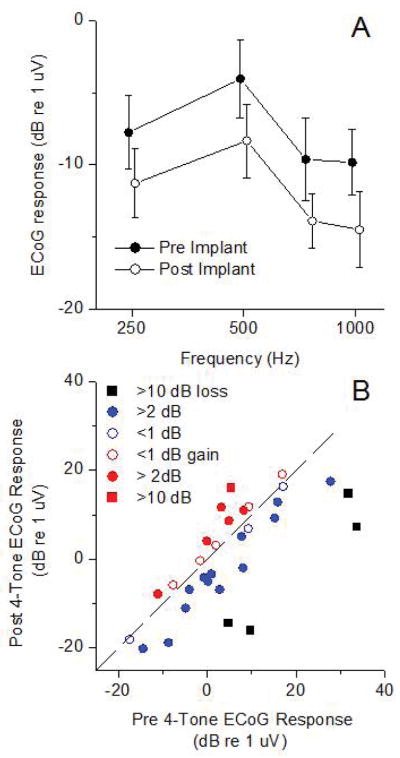
The average response changes in the ECochG-TR are shown in Figure 2. For each frequency where over 50% of the subjects showed a significant response (Fig. 2A), there was an overall average decline of 3–5 dB. The changes showed significant effects of frequency and between pre and post-insertion (2-way ANOVA, F(frequency)=7.039, df=3, p=0.002, and (F(pre/post)=4.31, df=1, p=0.048). There was no interaction between frequency and group, indicating similar frequency tuning before and after insertion (F(interaction)=0.53 df=3, p=0.66).
Figure 2.
Changes in ECoG response magnitude after implantation. A: Mean response versus stimulus frequency. Error bars are standard error (n=31). The tones bursts were delivered at 90 dB nHL. The post-implant data is shifted slightly in frequency for visual presentation. B: Distribution of 4-tone average ECoG response. Symbol colors for each case are from the 400 Hz data in Figure 2A.
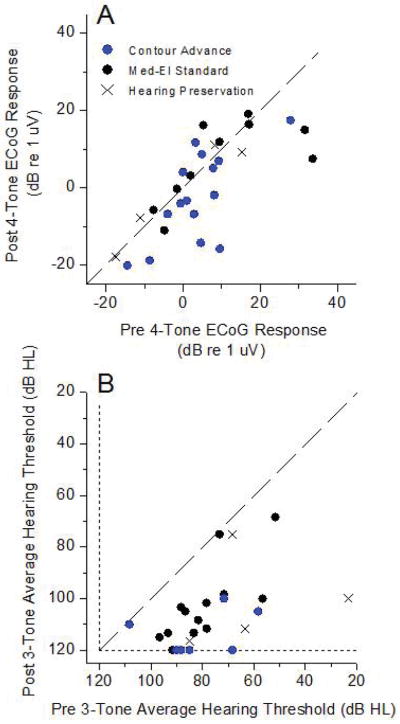
In individual cases, the responses could remain the same or even increase after implantation, as illustrated in Fig. 1. A scatter plot of the change in ECochG-TR (Fig. 2B) shows different degrees of response loss (black and blue symbols) or gain (red symbols). The range of response loss was from −11 dB (i.e., an 11 dB increase) to 26 dB. Losses of response were most common (19/31, 61%), but cases of response increases were not rare (12/31, 39%).
Changes In Audiometric Thresholds After Electrode Insertion and Correlation With ECochG Results
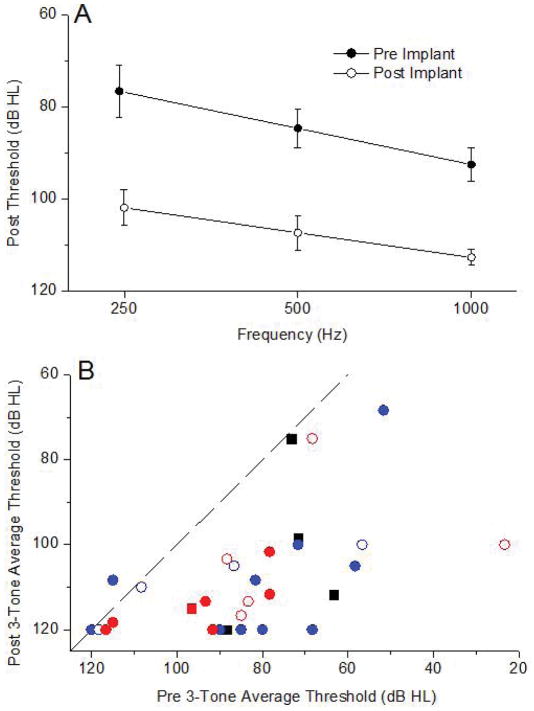
Substantial threshold increases occurred for all three frequencies (Figure 3A). These changes averaged 20–25 dB across frequency, compared to an average 3–5 dB loss in the ECochG-TR (Fig. 2A). As with ECochG, a repeated measures, two way ANOVA considering frequency and the two groups (pre and post implantation) showed main effects of frequency (F=6.68, df=2, p=0.004) and group (F=49.6, df=1, p<0.001), but no interaction between them (F=1.66, df=2, p=0.208).
Figure 3.
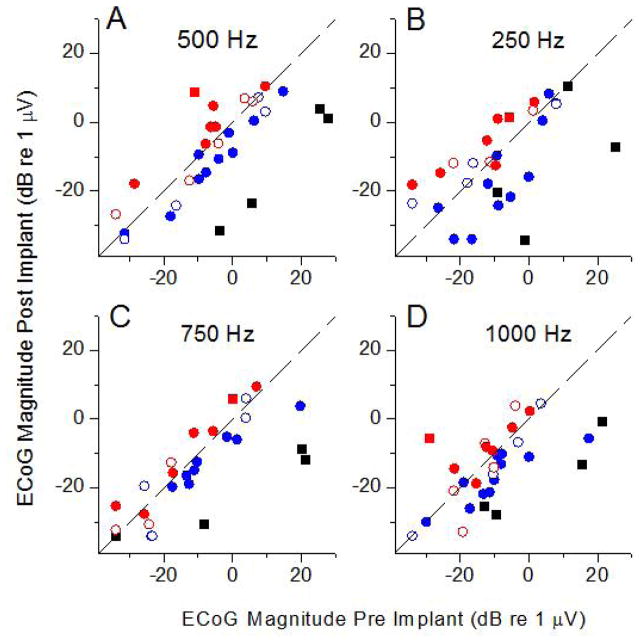
Changes in the ECoG response magnitude for different stimulus frequencies. A: 500 Hz; B: 250 Hz; C: 750 Hz; D: 1,000 Hz. Colors are the same as from Figure 2B.
The distribution of pre and post-surgery PTA thresholds showed that most were well below the line of equality, with some subjects losing hearing entirely (Figure 3B). Nine of the 31 cases had hearing threshold increases that were less than 10 dB HL. For comparison purposes, the colors utilized in Figure 3B represent those used for each case in Figure 2B. Of the four cases with the largest loss of ECochG-TR, one had nearly no increase in the hearing threshold and the others increased by amounts that were common for most cases in general. Cases where the ECochG increased also had substantial subsequent hearing threshold increases.
The lack of a relationship between ECochG response losses and increases in hearing threshold is further shown in Figure 4. Six cases were omitted because the pre-implant PTA was >110 dB, so there was little range for a threshold increase to occur. Linear regression showed no relationship between the ECochG response loss and the PTA increase.
Figure 4.
Pure tone thresholds before and after implantation. A: Average thresholds for 3 frequencies. B: Three-tone thresholds before and after implantation. Symbols and colors represent the ECoG results using the same colors and symbols as in Figure 2B.
Factors correlated with ECochG and hearing outcomes
Most subjects who received Cochlear Corp. devices were children (11/16), implanted by surgeon 2 (12/16), and the insertion was through a cochleostomy (15/16). In contrast, most subjects who received a MED-EL device were adults (11/14), implanted by surgeon 1 (8/14), and had a RW insertion (10/14). Analysis of partial correlations using these factors did not reveal any that were significantly correlated with hearing outcomes independent of the others.
DISCUSSION
Residual cochlear physiology was monitored with ECochG before and after implant insertion and correlated with hearing losses in a series of conventional implant subjects. Compared to the changes in the ECochG, the hearing threshold changes were much larger, and were consistently in the direction of threshold increases. In contrast, the ECochG showed response losses in most cases, but increases in others. There was no correlation between the change in the ECochG magnitude and the change in the hearing thresholds, even in cases where there were large losses in the ECochG.
Choice Of Stimuli And Response Metric
The metric used is the ECochG-TR, which is the magnitude of the spectral elements at the stimulus frequency and its harmonics in the steady-state (after the CAP) response to tones. One reason to measure a magnitude reduction rather than threshold increase is speed of measurement. The ECochG responses at the RW are typically large, with excellent signal to noise ratio, unlike thresholds which by definition have a poor signal/noise ratio, requiring more averages to determine. Another reason is that the response to a suprathreshold sound will be from a wide extent of the functionally remaining cochlea, while the response near threshold will be produced by a limited cochlear extent. Therefore, the change in magnitude will be capable of detecting changes in a larger fraction of the cochlea than is the case at threshold.
The reason to use the ongoing portion rather than the CAP is the greater accuracy and precision of measurement. The magnitude of the ongoing response to a tone can be measured from the peaks of the spectrum of the response (Figure 1). In some cases, the CAP is also a large and easily measured part of the ECochG response (e.g., Figure 1C), but to low frequencies, which is typically the main part of the cochlea remaining, this is not typically the case. To low frequencies in CI subjects the CAP is often small due to the limited extent of the cochlea where the hair cell-nerve connection is still functional, and because of reduced synchrony due to long rise times compared to high frequency tone bursts. The CAP to low frequencies is also variable in shape because it overlaps in both time and frequency with the CM.
ECochG Response Changes Post-Insertion
The mean ECochG reductions post-insertion (Figure 2A) are consistent with reports by Mandala, et al. 17, Adunka, et al. 1, and Radeloff, et al. 2 who also noted significantly smaller CAP amplitudes, smaller CM amplitudes, and increased CM thresholds, respectively, for most subjects. A decrease is the expected response, because intracochlear trauma and mechanical changes induced by electrode insertion should cause a reduction in ECochG responses, as has been postulated by these same investigators. However, ECochG responses post-insertion increased in a substantial number of subjects (Figures 1C, 2B, and 3). Several reasons could account for an increase. First, especially in cases where a RW insertion was performed (n = 11), once the barrier between the cochlear generator and the recording device is breached the post-insertion extracochlear recording electrode can be in direct contact with perilymph. It would thus have an intracochlear, rather than an extracochlear recording environment, which are on average more than twice as large as extracochlear measurements.23 Secondly, increases in ECochG responses could be due to a different position of the recording electrode in the RW niche for the two recordings due to obstruction from the implanted array. An approach that utilizes a fixed recording site before, during and after the insertion3,17 is more cumbersome but can remove this potential issue. Third, the ECochG response is a complicated mixture of potentials from hair cell and neural sources, and any relative damage can affect the phase of the summation and thus cause either an increase or decrease of the response10,24. This effect, unlike the previous two, is also consistent with a loss or gain of response to different frequencies within the same subject, which was seen in several cases. Finally, modeling has shown that the effect of an electrode stiffening a basal portion of the basilar membrane can increase the movement in more apical regions25. Complex effects of an electrode across frequency were observed in an animal model that introduced a flexible electrode while recording the ECochG8.
The Lack Of Correlation Between Pre- And Post-Implantation Changes In ECochG Responses And Hearing Thresholds
In all but a few cases, the ECochG magnitude change was much smaller than hearing threshold increases, and there was no correlation between the two. Recent work by Dalbert, et al. 3, also found no association between intraoperative ECochG changes after insertion and pure tone audiograms four weeks postoperatively. These results suggest that factors subsequent to electrode insertion are the major causes of hearing loss due to implantation. Major efforts to reduce factors related to inflammation and fibrosis will presumably help in understanding and ameliorating these effects26,27. The subjects studied here were drawn from the general population of CI recipients, and most of the surgeries were not designed to preserve hearing. While ECochG is a strong predictor of speech perception outcomes, this current data indicate that trauma measured during surgery may not serve as a good predictor of subsequent hearing levels. However, it is clear that intraoperative ECochG is a feasible approach to monitoring and reducing trauma caused during the surgery itself, which is likely to be an important factor in speech perception outcomes (ref Charlie, wanna, nobl).
CONCLUSIONS
Intraoperative round window ECochG appears to be sensitive tool for detecting electrophysiologic changes during electrode insertion. Various signal patterns and changes were observed and the overall correlations with postoperative hearing outcomes were low. This, however, is a somewhat expected result considering that the study population included mostly conventional cochlear implant recipients irrespective of residual hearing status. Thus, the current paper serves as a proof of concept and future studies will have to examine these techniques in a more controlled hearing preservation setting perhaps with an intracochlear recording site. Also, it is likely that a real-time ECochG sub-signal analysis will produce additional parameters from multiple source generators within the cochlea and spiral ganglion that may identify the health of specific structures instead of providing a more global parameter. These variables may assist in both surgical electrode placement and a more accurate prediction of hearing preservation outcomes.
Figure 5.
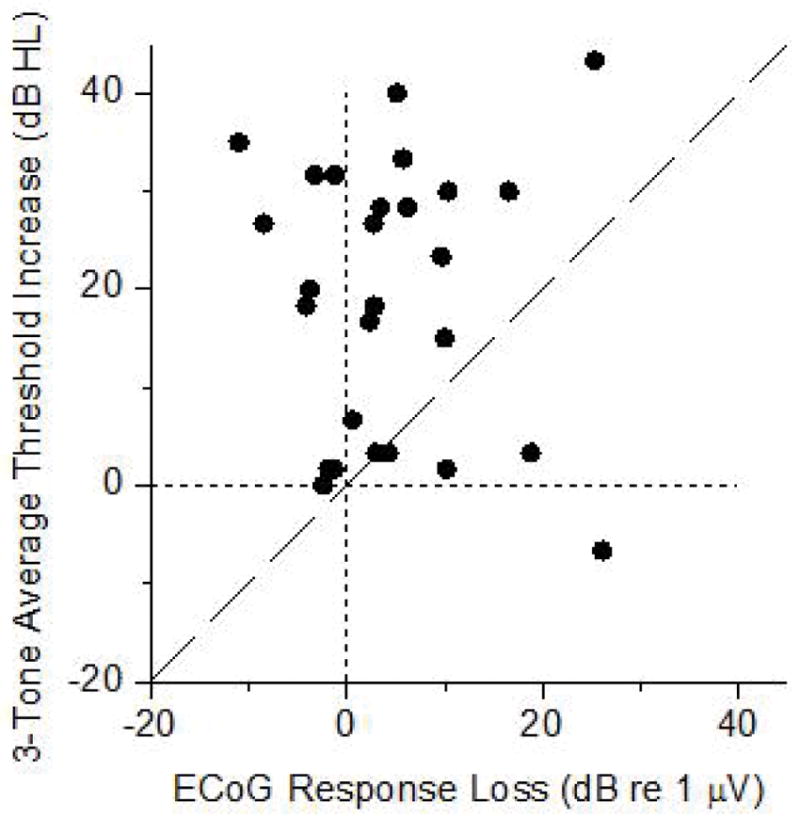
Lack of correlation between the ECoG response losses and hearing threshold increases.
Figure 6.
Brand comparison pre- and post-insertion. A: Intraoperative ECoG response. B: Hearing thresholds. See Table I for the different devices used.
Table III.
Analysis of factor effects on changes in the ECoG response magnitude and hearing threshold.
| Factor | Univariate correlation (Pearson) | Partial Correlations | ||||
|---|---|---|---|---|---|---|
| ECoG | n=30 | PTA | n=24 | PTA | n=24 | |
| r | p | r | p | r | p | |
| Device | −0.169 | 0.397 | −0.443 | 0.030 | −0.290 | 0.190 |
| Age | 0.143 | 0.452 | 0.402 | 0.047 | 0.250 | 0.270 |
| Approach | −0.144 | 0.448 | −0.215 | 0.314 | 0.062 | 0.790 |
| Surgeon | 0.132 | 0.486 | 0.062 | 0.772 | 0.116 | 0.618 |
Acknowledgments
The authors would like to thank Ken Hutson and Joseph Roche for helpful comments on the manuscript and Stephen H. Pulver for excellent technical assistance.
Footnotes
Level of Evidence: 2b
Financial Disclosures:
Oliver F. Adunka: Contractual research support from Advanced Bionics, Cochlear Corporation, and MED-EL. Consultant for MED-EL Corporation and Advanced Bionics Corporation.
Craig A. Buchman: Contractual research support from Cochlear Corporation and MED-EL. Unpaid consultant for Advanced Bionics, Cochlear, and Anspach Corporation.
Douglas C. Fitzpatrick: Contractual research support from Advanced Bionics, Cochlear Corporation, and MED-EL Corporation, research grant support from the NIH-NIDCD.
Conflict of Interest:
Supported by a grant from the MED-El Corporation and the Howard Holderness Distinguished Medical Scholars Program at the University of North Carolina.
References
- 1.Adunka O, Roush P, Grose J, Macpherson C, Buchman CA. Monitoring of cochlear function during cochlear implantation. Laryngoscope. 2006;116:1017–1020. doi: 10.1097/01.mlg.0000217224.94804.bb. [DOI] [PubMed] [Google Scholar]
- 2.Radeloff A, Shehata-Dieler W, Scherzed A, et al. Intraoperative monitoring using cochlear microphonics in cochlear implant patients with residual hearing. Otol Neurotol. 2012;33:348–354. doi: 10.1097/MAO.0b013e318248ea86. [DOI] [PubMed] [Google Scholar]
- 3.Dalbert A, Sim JH, Huber AM. Electrophysiologic Monitoring of Residual Hearing During and After Cochlear Implantation. Association for Research in Otolaryngology 37th Annual Midwinter Meeting; San Diego, CA: Association for Research in Otolaryngology Abstracts; 2014. pp. 317–318. [Google Scholar]
- 4.Miller CA, Brown CJ, Abbas PJ, Chi SL. The clinical application of potentials evoked from the peripheral auditory system. Hear Res. 2008;242:184–197. doi: 10.1016/j.heares.2008.04.005. [DOI] [PubMed] [Google Scholar]
- 5.Schuknecht HF. Auditory and cytocochlear correlates of inner ear disorders. Otolaryngol Head Neck Surg. 1994;110:530–538. doi: 10.1177/019459989411000610. [DOI] [PubMed] [Google Scholar]
- 6.Adunka OF, Mlot S, Suberman TA, et al. Intracochlear recordings of electrophysiological parameters indicating cochlear damage. Otol Neurotol. 2010;31:1233–1241. doi: 10.1097/MAO.0b013e3181f1ffdf. [DOI] [PMC free article] [PubMed] [Google Scholar]
- 7.Campbell AP, Suberman TA, Buchman CA, Fitzpatrick DC, Adunka OF. Correlation of early auditory potentials and intracochlear electrode insertion properties: an animal model featuring near real-time monitoring. Otol Neurotol. 2010;31:1391–1398. doi: 10.1097/MAO.0b013e3181f6c899. [DOI] [PMC free article] [PubMed] [Google Scholar]
- 8.Demason C, Choudhury B, Ahmad F, et al. Electrophysiological properties of cochlear implantation in the gerbil using a flexible array. Ear Hear. 2012;33:534–542. doi: 10.1097/AUD.0b013e3182498c28. [DOI] [PMC free article] [PubMed] [Google Scholar]
- 9.Choudhury B, Adunka OF, Demason CE, Ahmad FI, Buchman CA, Fitzpatrick DC. Detection of intracochlear damage with cochlear implantation in a gerbil model of hearing loss. Otol Neurotol. 2011;32:1370–1378. doi: 10.1097/MAO.0b013e31822f09f2. [DOI] [PMC free article] [PubMed] [Google Scholar]
- 10.Forgues M, Koehn HA, Dunnon AK, et al. Distinguishing hair cell from neural potentials recorded at the round window. J Neurophysiol. 2014;111:580–593. doi: 10.1152/jn.00446.2013. [DOI] [PMC free article] [PubMed] [Google Scholar]
- 11.Choudhury B, Fitzpatrick DC, Buchman CA, et al. Intraoperative round window recordings to acoustic stimuli from cochlear implant patients. Otol Neurotol. 2012;33:1507–1515. doi: 10.1097/MAO.0b013e31826dbc80. [DOI] [PMC free article] [PubMed] [Google Scholar]
- 12.Fitzpatrick DC, Campbell AT, Choudhury B, et al. Round window electrocochleography just before cochlear implantation: relationship to word rECochGnition outcomes in adults. Otol Neurotol. 2014;35:64–71. doi: 10.1097/MAO.0000000000000219. [DOI] [PMC free article] [PubMed] [Google Scholar]
- 13.McClellan JH, Formeister EJ, Merwin WH, 3rd, et al. Round Window Electrocochleography and Speech Perception Outcomes in Adult Cochlear Implant Subjects: Comparison With Audiometric and Biographical Information. Otol Neurotol. 2014 doi: 10.1097/MAO.0000000000000557. [DOI] [PubMed] [Google Scholar]
- 14.Formeister EJ, McClellan JH, Merwin WH, 3rd, et al. Intraoperative round window electrocochleography and speech perception outcomes in pediatric cochlear implant recipients. Ear Hear. doi: 10.1097/AUD.0000000000000106. In press. [DOI] [PubMed] [Google Scholar]
- 15.Campbell AP, Suberman TA, Buchman CA, Fitzpatrick DC, Adunka OF. Flexible cochlear microendoscopy in the gerbil. Laryngoscope. 2010 doi: 10.1002/lary.20979. accepted for publication. [DOI] [PMC free article] [PubMed] [Google Scholar]
- 16.Pike JM, Choudhury B, Awan O, Adunka OF, Buchman CA, Fitzpatrick DC. Effects of intracochlear trauma on long-term hearing outcomes in normal hearing gerbils. 2012 Annual Spring Meeting of the American Otological Society; San Diego, CA. 2012. [Google Scholar]
- 17.Mandala M, Colletti L, Tonoli G, Colletti V. Electrocochleography during cochlear implantation for hearing preservation. Otolaryngol Head Neck Surg. 2012;146:774–781. doi: 10.1177/0194599811435895. [DOI] [PubMed] [Google Scholar]
- 18.Dalbert A, Sim JH, Gerig R, Pfiffner F, Roosli C, Huber A. Correlation of Electrophysiological Properties and Hearing Preservation in Cochlear Implant Patients. Otol Neurotol. 2015 doi: 10.1097/MAO.0000000000000768. [DOI] [PubMed] [Google Scholar]
- 19.Henry KR. Auditory nerve neurophonic recorded from the round window of the Mongolian gerbil. Hear Res. 1995;90:176–184. doi: 10.1016/0378-5955(95)00162-6. [DOI] [PubMed] [Google Scholar]
- 20.Snyder RL, Schreiner CE. The auditory neurophonic: basic properties. Hear Res. 1984;15:261–280. doi: 10.1016/0378-5955(84)90033-9. [DOI] [PubMed] [Google Scholar]
- 21.Radeloff A, Unkelbach MH, Tillein J, et al. Impact of intrascalar blood on hearing. Laryngoscope. 2007;117:58–62. doi: 10.1097/01.mlg.0000242073.02488.f4. [DOI] [PubMed] [Google Scholar]
- 22.Campbell AP, Suberman TA, Buchman CA, Fitzpatrick DC, Adunka OF. Flexible cochlear microendoscopy in the gerbil. Laryngoscope. 2010;120:1619–1624. doi: 10.1002/lary.20979. [DOI] [PMC free article] [PubMed] [Google Scholar]
- 23.Calloway NH, Fitzpatrick DC, Campbell AP, et al. Intracochlear electrocochleography during cochlear implantation. Otol Neurotol. 2014;35:1451–1457. doi: 10.1097/MAO.0000000000000451. [DOI] [PubMed] [Google Scholar]
- 24.He W, Porsov E, Kemp D, Nuttall AL, Ren T. The group delay and suppression pattern of the cochlear microphonic potential recorded at the round window. PLoS One. 2012;7:e34356. doi: 10.1371/journal.pone.0034356. [DOI] [PMC free article] [PubMed] [Google Scholar]
- 25.Kiefer J, Bohnke F, Adunka O, Arnold W. Representation of acoustic signals in the human cochlea in presence of a cochlear implant electrode. Hear Res. 2006;221:36–43. doi: 10.1016/j.heares.2006.07.013. [DOI] [PubMed] [Google Scholar]
- 26.Kiefer J, Ye Q, Tillein J, Adunka O, Arnold W, Gstottner W. Protecting the cochlea during stapes surgery: is there a role for corticosteroids? Adv Otorhinolaryngol. 2007;65:300–307. doi: 10.1159/000098849. [DOI] [PubMed] [Google Scholar]
- 27.Ye Q, Kiefer J, Tillein J, Klinke R, Gstoettner W. Intracochlear application of steroids: an experimental study in guinea pigs. Cochlear Implants Int. 2004;5(Suppl 1):17–18. doi: 10.1179/cim.2004.5.Supplement-1.17. [DOI] [PubMed] [Google Scholar]
- 28.Kujawa SG, Liberman MC. Adding insult to injury: cochlear nerve degeneration after “temporary” noise-induced hearing loss. J Neurosci. 2009;29:14077–14085. doi: 10.1523/JNEUROSCI.2845-09.2009. [DOI] [PMC free article] [PubMed] [Google Scholar]


