

Summary
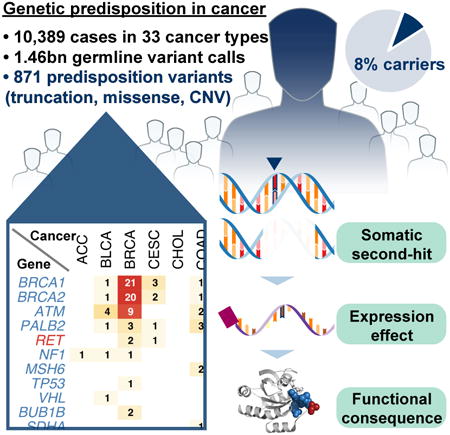
We conducted the largest investigation of predisposition variants in cancer to date, discovering 853 pathogenic or likely pathogenic variants in 8% of 10,389 cases from 33 cancer types. Twenty-one genes showed single or cross-cancer associations, including novel associations of SDHA in melanoma and PALB2 in stomach adenocarcinoma. The 659 predisposition variants and 18 additional large deletions in tumor suppressors, including ATM, BRCA1 and NF1, showed low gene expression and frequent (43%) loss of heterozygosity/biallelic two-hit events. We also discovered 33 such variants in oncogenes, including missenses in MET, RET, PTPN11 associated with high gene expression. We nominated 47 additional predisposition variants from prioritized VUSs supported by multiple evidences involving case-control frequency, loss of heterozygosity, expression effect, and co-localization with mutations and modified residues. Our integrative approach links rare predisposition variants to functional consequences, informing future guidelines of variant classification and germline genetic testing in cancer.
Keywords: Cancer predisposition, germline and somatic genomes, LOH, variant pathogenicity
Graphical abstract
Introduction
A sizable fraction of cancer is heritable (Lichtenstein et al., 2000), yet known common variants explain only a limited percentage of the genetic burden in cancer (Bodmer and Tomlinson, 2010). More than 100 genes, mostly tumor suppressors, have been found to harbor rare, predisposing alleles (Rahman, 2014). Most reports on germline variants have focused on single cancer types, although mounting evidence has suggested shared predisposition factors across cancer types. Previous pan-cancer studies have highlighted pathogenic germline variants in tumor suppressor genes, including ATM, BRCA1, BRCA2, BRIP1, and PALB2 in adult cancers in The Cancer Genome Atlas (TCGA) (Lu et al., 2015b) and the Collaborative Oncological Gene-environment Study (COGS) (Southey et al., 2016), as well as TP53, APC, BRCA2, NF1, PMS2, and RB1 using 1,120 pediatric cancer cases from the Pediatric Cancer Genome Project (PCGP) (Zhang et al., 2015). As sequencing projects expand, large-scale, systematic analyses are needed to increase statistical power and to compare predisposition factors among gene categories and cancer types.
Clinical interpretation of germline variants is a pressing challenge. Conflicting claims resulting from variability in sequencing technologies, analysis pipelines, and interpretations hinder the application of such knowledge (Amendola et al., 2016). Recent American College of Medical Genetics and Genomics–Association for Molecular Pathology (ACMG–AMP) guidelines provide a systematic method for interpretation of sequence variants for genetic disorders (Richards et al., 2015); however, a high fraction of variants are relegated to the unknown significance (VUS) category, often due to rarity and conflicting results in existing databases and the primary literature. Systematic analyses of high-throughput data associated with germline variants, such as matching tumor sequencing and mRNA sequencing data, can provide evidence of functional consequences and further inform clinical interpretation. For example, paired normal-tumor sequencing analysis of allele fraction can validate whether variants of tumor suppressors are undergoing positive selection in the context of the classic two-hit model (Knudson, 1971; Knudson, 2001; Lu et al., 2015b) and mRNA analysis can validate whether a germline truncation results in reduced expression. Of note, the current ACMG/AMP guidelines do not make use of this type of somatic analysis evidence for evaluation of germline variants.
In this study, we analyzed the landscape of pathogenic variants from 10,389 individuals across 33 cancer types in the TCGA cohort. We identified 8% of cases carrying pathogenic or likely pathogenic germline variants, ranging in prevalence from a striking 22.9% in PCPG to a scarce 2.2% in CHOL. Notably, we identified 33 such variants within oncogenes. In contrast to variants of tumor suppressor genes showing association with low expression (47.6% in bottom 25% of the carrier sample's respective cancer cohort) and LOH (38.5%), variants in oncogenes are associated with high expression (62% in top 25%). We further investigated the functionality of these variants through validation in other cancer cohorts and experiments on RET alleles. Finally, we discovered another 18 copy number deletions and nominated 47 VUSs based on multiple lines of evidences suggesting functionality. Altogether, our study represents the largest systematic discovery of rare, germline predisposition variants and provides a firm basis for addressing their functionality in cancer.
Results
Data Generation and Sharing on Cloud
The TCGA PanCanAtlas Germline Working Group analyzed germline predisposing variants in 10,389 samples across 33 cancer types (Table 1). A focus group conducted variant calling on the Institute for Systems Biology Cancer Genomics Cloud (ISB-CGC) and the resulting calls were shared among all investigators for quality control and downstream analyses (Figure 1A). Specifically, we dockerized the GenomeVIP variant calling system (github.com/ding-lab/GenomeVIP) (Mashl et al., 2017) and deployed more than 121,000 virtual machines running for over 600,000 hours on the ISB-CGC during the course of the project. Variant calls from GATK (McKenna et al., 2010), VarScan2 (Koboldt et al., 2012), and Pindel (Ye et al., 2009; Ye et al., 2015) were merged, filtered, and annotated (Methods), resulting in 286,657,499 total exonic variants, ranging from an average of 33,037 exonic variants per individual of African ancestry to 26,640 of European ancestry (Figure 1B). Our data-sharing paradigm effectively facilitated the analyses required by such an enormous project, avoiding both redundant computation in variant calling/processing and storage of intermediate analysis files in various local computational clusters.
Figure 1. Predisposition variant discovery in 10,389 adult cancers of the TCGA PanCanAtlas cohort.

(A) A scalable variant calling and data sharing model using ISB Cancer Genome Cloud (ISB-CGC). (B) Number of germline variants at each step of discovery from more than 1.46 billion total germline variants called from WES bam files to 1,393 prioritized, manual-reviewed related to cancer predisposition. The 853 pathogenic or likely pathogenic variants are used in downstream analyses. (C) Attributes of the 10,389 cases of 33 cancer types included in the final analyses including TCGA abbreviation of the cancer type, gender ratio and age at onset. See also Figure S1 and S2, and Table S1.
The final set of 10,389 samples passed stringent quality control criteria, showing good coverage, no outlying numbers of variants called, and high concordance with SNP array data (Methods). Sample quality control analysis of germline-normal samples revealed an average coverage of 18 ∼ 174× for the predisposition genes known to harbor rare, pathogenic variants (Methods, Table S1, Figure S1). The passed variant calls achieved an average precision above 0.99 when compared to the genotypes obtained through SNP array data (Figure S1). The germline exomes displayed high quality, with an average TiTv value of 2.88 ± 0.17 and lambda value (Koire et al., 2016) of 0.034 ± 0.003. The median predicted percent false positive calls across 33 cancer types was less than 5%, ranging from 1.2% (MESO) to 16.1% (KIRC, Figure S1). These resources are shared with the cancer researcher community on the cloud for further evaluation across institutions worldwide.
Pathogenic Variant Discovery across 33 Cancer Types
We developed an automatic variant classification pipeline called CharGer (Characterization of Germline Variants, https://github.com/ding-lab/CharGer) by adopting and extending the ACMG–AMP guidelines (Richards et al., 2015) specifically for rare variants in cancer. CharGer queries information from ClinVar (Landrum et al., 2015), including variant entry submissions and disease-gene associations reported. We also generated gene-specific databases for known susceptibility genes, including TP53, BRCA1, BRCA2, RET, and TERT (Methods). Further, in total, we curated 152 genes that contribute to cancer susceptibility, adding 15 genes from the St. Jude PCGP germline study (Zhang et al., 2015), 11 from Cancer Gene Census-Germline, and 12 from recent literature (reference listed in Table S1) to a published list of 114 known predisposition genes (Rahman, 2014) (Table S1). Overall, each variant is evaluated using data available for any of 12 pathogenic evidence levels and 4 benign evidence tags from ACMG-AMP that contribute to a composite score used for automatic classification. After CharGer evaluation, known pathogenic variants in ClinVar and curated databases are marked as pathogenic, whereas variants with CharGer score > 8 as likely pathogenic, and those with CharGer score > 4 as prioritized VUSs (Methods, Figure S2, Table S1). We bench-marked this automated classification and demonstrated its high performance: achieving a sensitivity of 88% and a false-positive rate of 4.9% for detecting pathogenic variants out of 883 germline variants found in pediatric cancer classified by the PCGP expert panel (Zhang et al., 2015).
We applied CharGer to classify variants found in our TCGA cohort into pathogenic, likely pathogenic, and prioritized VUS groups. CharGer initially prioritized 31,963 variants in these samples, 1,393 of which were labeled as rare variants (≤ 0.05% AF in 1000 Genomes and complete ExAC r.3.0.1) relevant to cancer, passing manual review in both normal and tumor samples (Methods). Combining existing database curation and CharGer results, we classified these into 435 pathogenic variants, 418 likely pathogenic variants (Table S2), and 540 prioritized VUSs (Table S2, Figure 1C). This catalog of 853 pathogenic or likely pathogenic germline variants expanded significantly from our previous study, which had focused solely on variants that truncate tumor suppressors in 12 TCGA cancer types (Lu et al., 2015a).
Across all cancer types, 4.1% of cases (n=428) harbored pathogenic variants and another 3.8% (n = 390) carried likely pathogenic variants (Figure 2A). The frequencies of pathogenic or likely pathogenic variants vary greatly across cancer types (Table S3), with the expected high rates in OV (19.9%) and BRCA (9.9%). Other cancer types that involve tissue types exposed to environmental factors, such as SKCM (6.2%) and UVM (5%), had lower percentages of carriers. Notably, 22.9% of PCPG (Fishbein and Nathanson, 2012), 14.1% of PAAD (Solomon et al., 2012), and 12.5% of SARC (Ballinger et al., 2016) cases carried such variants, suggesting significant contributions of rare germline predisposition in these cohorts.
Figure 2. Distribution of pathogenic germline variants across genes and cancer types.

(A) Percentage of TCGA cases carrying pathogenic and likely pathogenic variants in each of the 33 cancer types. (B) Count of pathogenic or likely pathogenic variants in tumor suppressors, oncogenes and other genes in each of the cancer type. (C) Carrier frequency of pathogenic variants in genes enriched in cancers. The numbers in each box (carrier frequency) indicates the percentage of carriers of pathogenic variants of each gene in the specified cancer cohort. The black outlines indicate the cancer type is significantly (FDR < 0.05) enriched for pathogenic variants of that gene. The grey outlines indicate suggestive (FDR < 0.15) enrichment. (D) Counts of pathogenic and likely pathogenic variants in the oncogenes and tumor suppressors enriched in cancers. See also Figure S2 and S7, and Table S2, S3, and S7.
We investigated genes with enriched pathogenic or likely pathogenic variants in each cancer type. Briefly, we first identified cancer types with potential higher enrichment by comparing to pathogenic or likely pathogenic variants identified in the ExAC non-TCGA cohort. We then conducted Total Frequency Testing (TFT) (Basu and Pan, 2011) for one cancer type against all other cancer types, subtracting the ones with potential enrichment for each gene (Methods). We identified 28 specific cancer-gene associations (FDR < 0.05) and 16 additional suggestive (FDR < 0.15) associations (Figure 2C, Table S3). The majority of these findings from the burden test are known associations. For example, pathogenic or likely pathogenic variants of BRCA1 and BRCA2 are highly enriched in OV and BRCA (FDR < 1.15E-05), as expected, while BRCA2 also showed significant enrichment in PAAD (FDR = 0.012). PCPG is associated with a wide array of predisposition factors, including RET, SDHB, VHL, NF1, SDHD, and MAX.
There were several new findings that may suggest unexpected germline susceptibility gene/tumor associations (Table S3). For example, 5 stomach adenocarcinoma patients carried 5 different PALB2 LOF variants (FDR = 0.038, nonsense and frameshift) with variable LOH (2 of 5 tumors) similar to that seen in other PALB2-associated tumors. Only one other recent report suggests this potential association (Sahasrabudhe et al., 2017). Similarly, three melanoma patients carried three different LOF variants in SDHA (FDR = 0.035, and very low expression levels) - a gene not previously associated with melanoma susceptibility. Strikingly, 2 LUSC and 3 GBM patients carry the same rare BUB1B missense variant, namely p.Q912H. A prior mouse model suggested that haploinsufficiency for BUB1B increases the development of carcinogen-induced lung carcinomas (Dai et al., 2004). Thus, our results may have revealed novel cancer susceptibility associations require further study.
At the variant level, we identified 659 pathogenic or likely pathogenic variants in 66 tumor suppressor genes (TSGs) (Figure 2D). We also discovered 33 pathogenic or likely pathogenic variants in 5 oncogenes RET, AR, PTPN11, MET, and CBL. Twenty-one RET variants were found across 11 cancer types. Some appear to be cancer specific; for example, all of the 3 pathogenic MET p.H1112R variants are observed in KIRP (papillary renal carcinoma), validating the previously observed co-segregation of the variant in hereditary KIRP (Schmidt et al., 1998). For tumor suppressors, we identified a total of 57 ATM variants, 36 BRIP1, and 29 PALB2, all in at least 18 cancer types. In contrast, multiple other tumor suppressor genes showed enrichment in specific cancer types, such as BRCA1, BRCA2 variants in BRCA and OV (Figure 2C). For example, all of the 4 tumors containing the pathogenic BRCA1 p.C61G variants in the ring domain are breast invasive carcinoma.
Two-hit Events
To better understand the biological impacts of the discovered variants, we examined the extent of loss of heterozygosity (LOH) using a statistical test we developed previously (Lu et al., 2015b) (Methods). We discovered 157 significant (FDR < 5%) LOH of pathogenic or likely pathogenic germline variants in tumors (Figure 3A), 148 of which were found in tumor suppressor genes. In contrast, significant LOH is only observed in 4 variants of oncogenes, possibly due to their gain-of-function nature and less selection requirement for the activated mutated allele to be homozygous. To validate the allele specificity of the discovered LOH events, we further characterized both the normal/tumor read-count data and tumor CNV calls using GISTIC (Table S4, Methods). Variants showing suggestive LOH (FDR < 0.15 or tumor VAF > 60%, Methods) showed similar extents of deletion to variants with significant LOH (Figure 3B). Thus, many of these are likely true events failing to reach statistical significance due to insufficient sequencing reads, adding up to 38.5% of variants (n=254) in tumor suppressors showing LOH. We further confirmed 154 of these LOH in tumor suppressors are due to deletion of the wild type allele (Figure 3C).
Figure 3. Systematic identification of two-hit events in TCGA cancers.

(A) Identification of loss of heterozygosity (LOH) in oncogenes and tumor suppressors through comparison of variant allele frequencies in tumor and normal samples. Each dot depicts one variant. The diagonal line denotes neutral selection of the germline variant where the normal and tumor variant allele frequencies (VAFs) are identical. (B) Somatic copy number changes detected for the tumors showing significant LOH in each gene. Significant, suggestive, and no evidence of LOH are shown in red, green and grey, respectively. (C) Counts of germline variants showing the various types of classified LOH in cancer predisposition genes, highlighting LOH due to deletion of the wild type alleles in tumor suppressors (shown in orange). (D) Candidate biallelic events of pathogenic or likely pathogenic variants coupled with somatic mutations on gene products of ATM, BRCA2, and MSH6. Germline variants are colored in red and somatic mutations are in blue. Coupled germline and somatic events observed in the same case are linked with grey lines. See also Figure S3 and Table S4.
As expected, strong LOH is observed in cancer types having high hereditary predisposition. The four OV samples containing BRCA1 p.Q1777fs, p.D825fs, p.W372* and p.E797* each showed highly significant LOH (FDR ≤ 3.43E-20), whereas BRCA2 p.E1857fs, p.E294*, and p.Y1762* also showed strong LOH in the other 3 OV samples (FDR ≤ 3.27E-11). We further compared rates of LOH in BRCA1/2 across cancers, finding most BRCA1/2 variants exhibit LOH in OV and a slightly lower fraction in BRCA, and an even lower fraction but notable 11 such events in other cancers (Figure S3). The BRIP1 p.S624* variant showed pathogenic evidence from three independent ClinVar submitters and displayed strong LOH evidence (FDR = 1.31E-16) in an OV sample. RAD51C p.R193* showed LOH in both BRCA and OV (FDR = 3.04E-12 and 5.79E-05, respectively), but not SKCM (FDR=0.933). MET p.H1112R, which was previously shown to cause malignant transformation of NIH 3T3 cells (Schmidt et al., 1998) showed LOH due to amplification of the variant allele in two of the three KIRP samples (FDR = 2.24E-05, 6.98E-3, 0.26, respectively). The positive selection of these germline variants in the tumor further validates their clinical relevance.
Another manifestation of the two-hit hypothesis is a pathogenic or likely pathogenic germline variant coupled with a somatic mutation in the other copy of the predisposition gene. We identified 37 candidate biallelic events when analyzing the tumors in our cohort (Methods, Exact Poisson test, P < 1E-5, Figure 3D, Table S4). Six germline variants of ATM, including two p.T2332fs and one each of p.S2289fs, p.R23*, p.E1267fs and a start loss variant, were coupled with somatic ATM mutations in PRAD, READ, STAD, ESCA, PRAD, and BLCA, respectively. Three cases carrying distinct BRCA2 germline truncations, including p.T1598fs, p.A2314fs, and p.Q1037* also harbored BRCA2 somatic mutations (Figure 3D). A COAD case carried MSH6 p.R248fs germline variant/p.R248* somatic mutation that are mutually exclusive in all sequencing reads, clearly supporting the two-hit abruption of both alleles (Figure S3).
Multiple tumor suppressor genes also showed expression patterns consistent with the two-hit hypothesis: an African American KIRP patient with an age onset of 35 carried the pathogenic FH p.S187* germline variant and a somatic splice site FH mutation and showed low FH expression (at 2.07% of KIRP). A BLCA sample carried the CHEK2 germline p.W93* compounded by 4 different CHEK2 somatic mutations subsequently showing low CHEK2 expression (at 1.7% of BLCA). Overall, these results provide supporting evidence of the two-hit hypothesis through LOH and biallelic events of predisposing alleles across many tumor types.
Altered Gene Product Expression in Variant Carriers
In addition to expression associated with two-hit events, we systematically investigated the gene and protein expression in carriers of pathogenic or likely pathogenic germline variants of the respective gene. Briefly, we calculated the percentile of gene expression for variant carriers relative to other cases in the same cancer cohort. We then conducted a differential expression analysis to look for genes expressed at different levels in variant carriers (Methods). We identified 15 significant (FDR < 0.05, linear regression) and 6 suggestive (FDR < 0.15) gene-cancer associations (Figure 4A-B, Figure S4, Table S5).
Figure 4. Germline variants associated with expression impacts.

(A) Plot showing cancer types where the carrier of each gene's germline variant is associated with significantly higher or lower expression of the gene transcript. Each dot represents a gene-cancer association where the color depicts the cancer type and the shape shows significance. (B) Distribution of gene expression of pathogenic variant carriers. Each dot corresponds to the gene expression percentile in a case carrying germline variants relative to other cases of their corresponding cancer cohort. Variants in oncogenes associated with high expression are labeled. (C) Plot showing cancer types where the carrier of each gene's germline variant is associated with significantly higher or lower expression of the RPPA protein/phosphoprotein marker. Each dot represents a gene-cancer association where the color depicts the cancer type and the shape shows significance. (D) Distribution of protein/phosphoprotein expression of pathogenic variant carriers. Each dot corresponds to the expression percentile of the RPPA marker in a case carrying germline variants relative to other cases of their corresponding cancer cohort. The genes shown in (B) and (D) are based on their significant enrichment of pathogenic variants. See also Figure S4 and Table S5.
In breast cancer, FANCM, ATM, BRCA2, CHEK2, and BRCA1 carriers all showed significant lower-expression of the respective gene (Figure 4A-B). In PCPG, RET carriers showed higher RET expression, whereas SDHB, NF1, and SDHD carriers have lower expression. In addition to breast cancer, ATM carriers exhibited significantly lower expression in LUAD and LGG. We then conducted the same analysis using RPPA data, investigating whether the effects extend to the protein/phosphoprotein levels (Figure 4C-D, Table S5). Notably, ATM carriers were significantly associated with lower protein expression in 5 cancer types, namely STAD, PAAD and PRAD in addition to validating mRNA expression signals in BRCA and LGG. CHEK2 carriers also showed lower protein expression of the Chk2 marker in BRCA and suggestively in BLCA (FDR = 0.053).
Overall, the associated gene expression showed distinct distributions for oncogenes vs. tumor suppressors (Figure 4B). Pathogenic or likely pathogenic germline variants in tumor suppressors are associated with lower distributions in gene expression than those in oncogenes (Two-sample Kolmogorov-Smirnov test, p = 5.70E-7): 47.6% of such variants in tumor suppressors were associated with the bottom quartile of gene expression. In contrast, 62.1% of those in oncogenes were associated with the top quartile, suggesting divergent transcriptional regulation of tumor suppressor genes and oncogenes carrying pathogenic or likely pathogenic variants.
On the variant level, all three tumors with the MET p.H1112R variant were in the top 25% MET gene expression in KIRP. Twelve cases carrying predisposing RET alleles showed high RET expression in their respective cancer cohorts, including 9 PCGP cases and, notably, 3 RET carriers from other cancer types not typically associated with multiple endocrine neoplasia type 2, including p.I852M in LGG (96%), p.D631Y in KIRP (84%), and p.R912P in READ (80%). The two breast cancer carriers of PTPN11 variants p.N58S and p.T411M also showed high expression (>88%). The high expression of the variant-associated oncogenes in tumor, many without detected copy number amplifications, suggests that cancer cells may preferentially up-regulate pathogenic alleles in these oncogenes.
Rare Germline Copy Number Alterations
We systematically scanned for rare, germline CNVs in the same 10,389 samples, using both SNP-array data and XHMM analysis as previously described (Fromer and Purcell, 2014; Ruderfer et al., 2016) on whole exome sequence data (Methods). We identified 42,208 rare (AF < 0.6% considering 50% overlaps) CNVs using SNP-array data and 53,726 using XHMM on the WES data (Figure 5A). 3,584 of overlapping CNVs in both datasets passed rare, frequency filters. On average, each case had 0.38 overlapping deletion and 0.96 overlapping duplications; 44% of the CNVs affected only one single gene while 56% impacted multiple genes (Figure 5B).
Figure 5. Rare germline copy number variations (CNVs).

(A) Copy Number Variations (CNVs) identified through SNP array data, where the CNV value is measured by the log2-transformed segment mean. (B) Copy Number Variations (CNVs) identified through whole-exome sequencing data using XHMM, where the CNV value is measured by the normalized read depth of the genomic region. (C) Characteristics of the 3,582 overlapping CNVs identified using both technologies, including fractions of samples carrying deletions/duplications and the number of genes affected by each type of CNVs. (D) CNVs identified in predisposition genes associated with specific cancer types, along with its CNV value, corresponding gene expression and technology used for detection. *The two pair of events discovered by both the SNP array and WES data in the same CNV carrier. (E) Expression quantile associated with each CNV events in their respective cancer types. Each dot represents one CNV events shown in (D) colored by the cancer type. See also Figure S5.
Given the large amount of discovered CNVs, we hypothesized that the pathogenic CNVs likely reside in genes showing enrichment in specific cancers. Using the 28 associated cancer-gene pair from this cohort (Table S3), we found 18 events (2 were jointly identified using both WES and SNP array) that marked copy number deletions of 11 tumor suppressor genes (Figure 5C, Figure S5). We found 3 BRCA and 2 OV cases showing BRCA1 deletions. Two KIRC cases carried VHL deletions and 1 each of BRCA and PRAD cases carried ATM deletions. Other genes affected by deletions included FH, MSH6, NF1, PALB2 and PTEN.
Notably, we further validated the transcriptional effect of these deletions detected in predisposition genes for specific cancer types: 9 of the 14 cases with highlighted events with expression data showed bottom quantile expression in their respective cancer cohorts (Figure 5D), whereas other deletions did not correspond with lower gene expression in the affected samples (Figure S5).
Independent Genomic Evidence Supporting Pathogenicity
We then sought independent evidence to corroborate the pathogenicity of the 853 identified pathogenic or likely pathogenic variants, including (1) significant enrichment in cancer vs. non-cancer cases at a single variant level, (2) co-localization of variants with pathogenic germline alleles found in pediatric cancers or with recurrent somatic mutations, and (3) co-localization with post-translational modification (PTM) sites.
To determine whether the pathogenic or likely pathogenic variants are enriched in cancer cases, we conducted association testing by comparing allele frequencies in TCGA cases vs. non-TCGA cases in the most-powered Non-Finnish European cohort in the Exome Aggregation Consortium (ExAC r.0.3.1) data comprised of 33,370 individuals (Lek et al., 2016) (Methods). We found 30 unique variants showing suggestive associations (One-tailed Fisher's Exact test, P < 0.05, Figure 6A, Table S6). The top 4 associated variants passing multiple-testing threshold (FDR < 0.05) include ATM p.E1978* (P = 3.50E-06), BRCA1 p.Q1777fs (P = 2.97E-05), POT1 p.R363* (P = 3.11E-05), and PALB2 p.R170fs (P = 5.20E-04). The results also provided supporting evidence of pathogenicity for oncogenic variants such as MET p.H1112R (P = 2.00E-03) and MPL p.F126fs (P = 0.0161).
Figure 6. Independent evidence supporting functionality of pathogenic variants.

(A) Pathogenic germline variants showing significant enrichment in TCGA cases compared to non-TCGA cases in the ExAC Non-Finnish European cohort. (B) Variants with co-localizing recurrent somatic mutations (N ≥ 3 in the TCGA PanCanAtlas MC3 dataset) or pathogenic germline variants in 1,120 pediatric cancers. (C) Site-specific interaction network of predisposition proteins shows how germline substitutions occur in or near experimentally determined binding sites of upstream kinases and other enzymes. See also Figure S6 and Table S6.
In our TCGA cohort, we observed 28 pathogenic or likely pathogenic variants previously discovered in 1,120 pediatric cancers (Zhang et al., 2015)(Figure 6B), including stop-gained variants in BRIP1, ERCC3, FANCC, MSH2, and WRN. Further, we observed 23 incidences of germline variants co-localizing with recurrent (n ≥ 3) somatic mutations found in the TCGA MC3 cohort (Figure 6B, Table S6). Considering unique variants, these include 8 missense variants in TP53, 4 NF1 truncations, and 2 RET missenses. For example, the TP53 p.R248W is a highly recurrent somatic mutation (n=94) while being observed as a germline variant in both pediatric rhabdomyosarcoma (Zhang et al., 2015) and LGG. The MEN2-associated allele RET p.M918T seen in PCPG and associated with MEN2B disorder was also found as a recurrent somatic mutation (n=4). Overall, we observed significant overlaps between both recurrent somatic mutations and PCGP variants and pathogenic or likely pathogenic variants we found in TCGA (Exact Poisson test, P < 2.2e-16 in both tests), implying shared oncogenic processes in predisposition across pediatric/adult cancers and germline/somatic genomes.
To further evaluate whether this set of 853 pathogenic or likely pathogenic variants discovered in TCGA can impact a broader patient population, we examined the direct overlap with these variants in an independent (primarily metastatic) tumor cohort collected at The University of Texas MD Anderson Cancer Center (MDACC), which consists of 3,026 patients in 19 tumor types. Targeted panel sequencing of 201 cancer-related genes, covering 39/99 genes with pathogenic variants, were previously sequenced from these patients based on an institutional clearinghouse protocol for cancer patients (Chen et al., 2015). We rediscovered 29 specific variants found in TCGA (0.96% carrier frequency) in the MDACC cohort from 8 tumor types including breast, colorectal, melanoma, head and neck, and glioblastoma multiforme (Table S6). In comparison, we identified 0.58% carriers of these variants of the same genes in the 53,105 non-TCGA samples in the ExAC cohorts, validating the enrichment of these variants in cancer (Fisher's Exact Test, P = 0.015).
Variants in Post-Translational Modification (PTM) Sites
To investigate the potential functional impact of germline variants on protein signaling, we mapped the 853 variants to 316,216 experimentally collected known post-translational modification (PTM) sites from ActiveDriverDB (Krassowski et al., 2018), PhosphoSitePlus (Hornbeck et al., 2015) and the UniProt Knowledge Base (Consortium, 2017) (Methods). Overall, we found 65 amino acids substitutions (missenses) directly overlaps or sits adjacent to 34 unique PTMs (Table S6), showing a significant enrichment to those variants observed in the 1000 Genomes data set (Methods, permutation test, P < 2×10-11). The top six genes with pathogenic PTM-associated substitutions include VHL (n=10), CHEK2 (n=9), BUB1B (n=9), TP53 (n=8), and RET (n=6). This agrees with our earlier observation that PTM sites are depleted of substitutions in the general human population while the sites are enriched in disease mutations (Reimand et al., 2015).
To illustrate putative mechanisms of germline variants on signaling networks, we systematically mapped the PTM-associated substitutions to known site-specific enzyme-substrate interactions (Hornbeck et al., 2015; Krassowski et al., 2017) (Methods, Figure 6C). Over 60% (21/34) of unique substitutions in 9/18 genes occur in known protein sites bound by upstream kinases and other classes of enzymes. For example, five substitutions in TP53 potentially affect binding sites of kinases, such as Aurora kinase A (AURKA) and CHEK2, and other signaling enzymes, such as MDM2 and EP300, that are known to activate or inhibit TP53 in response to cellular stimuli. Five VHL variants occur in binding sites of the NEK1 kinase that promotes its degradation (Patil et al., 2013). Similarly, CHEK2 p.S428F may affect the auto-phosphorylation and activation of CHEK2 kinase (Gabant et al., 2008). RET p.V804M and p.R921P potentially affect its auto-phosphorylation sites required for RET kinase activity (Kawamoto et al., 2004; Plaza-Menacho et al., 2016). BRCA1 p.R1699W significantly weakens binding to the BACH1 peptide through disruption of the BRCT repeats (Shiozaki et al., 2004). Collectively these results suggest that a subset of pathogenic germline cancer predisposition variants may manifest their function by disrupting and rewiring complex protein signaling networks.
Functional Assessment of Germline RET Alleles
We adapted HotSpot3D (Niu et al., 2016) to conduct co-clustering analysis of pathogenic or likely pathogenic germline variants and somatic mutations on 3D protein structures (Methods). We identified 56 hybrid clusters containing somatic mutations and 21 pathogenic germline variants in 35 genes (Table S6). For example, we observed co-localized VHL germline variants p.C162F, p.L188V and p.R167Q/W co-clustering with somatic mutations affecting 7 other nearby residues.
Interestingly, we observed hybrid clusters in the kinase domain of RET: one includes the co-localized germline variants p.R912P/p.M918T and 10 other somatic mutations (Figure 7A-B) while the other adjacent cluster includes p.I852M along with 5 somatic mutations. Additionally, we also observed germline VUSs co-clustering with somatic mutations in the kinase domain of RET and MET (Figure 7B) potentially providing additional evidence for pathogenicity. One MET kinase domain cluster centered around residue p.H1112, where the known pathogenic germline variant p.H1112R and the somatic mutation p.H1112Y resides. This cluster contained additional somatic mutations including p.T1114S and the pathogenic p.V1110I and a germline VUS p.H1097R. We further identified a RET kinase domain cluster containing co-localized germline VUSs p.R844L/Q, p.R846V and co-clustered VUSs p.R817C, p.E843K (Figure 7B), some of which show additional evidence of functionality. For example, RET p.E843K is associated with high expression (97th percentile) and potential enrichment in the cancer population (p=1.7E-4) (Table S2).
Figure 7. Germline variants in the kinase domain of the receptor tyrosine kinase RET.

(A) Pathogenic or likely pathogenic germline variants along the RET protein observed in the TCGA cohort. (B) Co-clustering of somatic mutations and germline variants in the kinase domain of RET and MET shown on 3D protein structures (PDB structures: 21VT, 1R0P, and 1XPD from left to right). Germline variants are colored in red; somatic mutations are colored in blue; amino acid residues affected by both type of mutations are colored in salmon. (C) Experimental assessment of the signaling functionality of RET germline alleles. In the top bar plot, ligand-independent RET activity was measured through pMAPK/RET/GAPDH normalized to the ratio observed in wild-type. In the bottom barplot, experimental assessment of RET germline alleles measured through pMAPK/GAPDH normalized to the ratio observed in wild-type. See also Table S6.
Because of the preponderance of variants in RET especially in and around the kinase domain, we assessed their functionality by conducting experimental validation of 12 unique germline variants in RET, including 3 pathogenic variants and 9 VUSs (Methods). Additionally, we selected a constitutively-active positive control p.C618F (Wells 1994) and a kinase-dead negative control p.K758M (Table S6).
We evaluated the activity of the RET variants by monitoring the downstream pMAPK levels by Western blot in the absence of its ligand GDNF (Methods). We first measured RET activity through the ratio of pMAPK/RET/GAPDH (Figure 7C). As expected, the constitutively-active p.C618F showed ligand-independent activation, whereas the kinase-dead p.K758M showed background level of pMAPK. The MEN2B syndrome-associated p.M918T also exhibited higher activity consistent with the severe disease phenotype, whereas all other germline VUSs found in this study did not show significant change in activity when pMAPK was used as readout.
Activating mutations tend to couple with up-regulation of the oncogenes as seen for RET MEN2 alleles and MET p.H1112R in our cohort (Figure 4B) and somatic mutations of receptor tyrosine kinases (Bose et al., 2013). We thus analyzed the results by measuring RET activity by pMAPK/GAPDH not controlled for the dynamic RET expression (Figure 7C). While p.R912P was previously shown to co-segregate in familial medullary thyroid carcinoma (Jimenez et al., 2004), our results demonstrate that it may also show ligand-independent activation (T-test using pooled SD, unadjusted P = 0.0019). Multiple other variants also showed minor up-regulation of activity that could be adaptive in a permissive environment, warranting further investigation (Figure 7D).
Nomination of VUSs Using Combined Evidences
Promisingly, our integrative approaches can be further applied to nominate VUSs, connecting them to potential functionality. Among the 540 prioritized VUSs (Figure 1), we discovered 47 additional predisposition variants while requiring at least two lines of evidence involving case-control frequency, loss of heterozygosity, expression effect, and co-localization with recurrent mutations and PTMs (Figure S2, Table S2). These include 6 incidences of cancer-enriched (p =1E-4) ERCC2 p.F544fs, 3 each of FANCC and FANCL truncations, and 1 each of LOH-associated POLH and FANCM variant, whose carriers all showed bottom 25% expression in their respective cancer cohorts. These approaches of functional assessment will likely inform future guidelines of variant classification.
Discussion
We present the largest catalog of germline variants of cancer to date in 10,389 individuals spanning 33 cancers (Figure 1). A total of 853 pathogenic or likely pathogenic variants discovered in 8% of adult cancer cases, a fraction comparable to recent investigations in smaller cohorts of pediatric and adult cancers (Cheng et al., 2017; Parsons et al., 2016; Zhang et al., 2015). This comprehensive survey allowed us to establish enrichment of pathogenic or likely pathogenic factors in each cancer (Figure 2) from BRCA1/2 in OV and BRCA to RET/SDHB/VHL/NF1/SDHD in PCPG. Our analysis also identified putative new associations, e.g. PALB2 in STAD and BUB1B in GBM/LUSC that warrant further study. Further, the concurrent systematic discovery of CNVs revealed 18 rare events, including deletion of ATM, BRCA1 and NF1 associated with clear expression changes (Figure 5), suggesting the importance of other genomic events beyond SNPs and small insertions/deletions.
We fully acknowledge that although this cohort presents one of the largest systematic analysis to date, our power to detect predisposition genes harboring rare variants is still limited, potentially requiring 100,000 samples to achieve 80% power for rare variants of 95% penetrance (Figure S7). Similar power limitation applies to clinical association. We validated previously found predisposition genes associated with onset ages in various cancer types (Table S7). We also investigated variants found in 552 cancer cases with known familial history (Figure S7). While difficulties abound for collecting family information (i.e. non-cohesive family history collection, absent family history for many projects), improved curation of such data will be pivotal for investigation of predisposing variants.
Most of the known predisposing factors in cancer are found in tumor suppressors, however an intriguing smaller set of conditions are associated with heritable activating mutations in oncogenes, such as MET p.H1112R in hereditary papillary renal carcinoma (Schmidt et al., 1998). By conducting the first systematic discovery of germline variants we discovered 33 such variants in oncogenes, including missenses in MET, RET, PTPN11. Particularly, we found pathogenic RET variants associated with high gene expression not only in PCPG but also in LGG, KIRP and READ. The pathogenic RET allele p.R912P (Figure 7) showed potential ligand-independent activation. However, our assay failed to establish functional change in other alleles of familial medullary thyroid cancer, including p.I852M (currently with conflicting evidence in ClinVar) and p.R844Q (currently a VUS in ClinVar). It is possible that MEN2-associated alleles exhibit higher expressivity and have easier to detect molecular functional changes. Weaker gain-of-function RET alleles may exhibit activity depending on cellular context. Additional epigenetics mechanisms such as up-regulation of gene expression may be required for these alleles to achieve their activating potential, such as the candidate germline RET VUS p.E843K, which is associated with enrichment in cancer population, high gene expression, and conservation among homologs but showed no gain of activity in our assay. Our results demonstrate the importance of experimental investigation of the pathogenic variants.
Historically, germline variants have often been overlooked by classification systems due to the lack of evidence in currently available databases and the lack of somatic mutation information in the current ACMG-AMP classification system. In particular, our approach demonstrated the utility of tumor/normal matched sequencing for germline variant interpretation in that they are required to discover two-hit events, including LOH or biallelic events (Figure 3). Within each individual cancer case, we observed that 34% and 4.3% of pathogenic or likely pathogenic germline variants exhibit LOH and biallelic events, respectively (Figure 3C). At the cohort level, we identified germline variants and somatic mutations affecting the same residues. While these approaches provide systematic evaluation germline variants, careful assessments are required to separate effects from compounding factors, such as passenger somatic copy number events that may induce LOH. Such information may also help validate oncogenic effects of variants in pleiotropic genes (Table S2).
Further, by analyzing tumor expression data from RNA-Seq, we identified that approximately half of the variants in tumor suppressors were associated with low gene expression and 62% of variants in oncogenes associated with high expression (Figure 4B), confirming and expanding findings of germline variants in BRCA1/2 and MSH genes associated with low gene expression (Hilton et al., 2002; Morak et al., 2017). While the association between truncating mutations and reduced gene expression is intuitive, it should not be taken for granted: even for predisposition genes, we observed various degrees of reduced gene expression in truncation carriers (Figure S4). Such evidence was used to highlight potentially functional genes affected by somatic mutations (Ding et al., 2015) and can also likely validate transcriptional effect of germline variants (Figure 4).
Germline variants overlapping PTMs suggest signaling as a possible predisposition mechanism of cancer. Beyond the two pathogenic variants that directly overlapped PTM sites (TP53 and PTEN) and additional proximal variants (Figure 6C), selected prioritized VUSs also showed potential of modulating PTMs (Table S6). For example, multiple TP53 variants directly replace arginine residues affected by protein methylation (R156H, R158C, R290C, and R333G), potentially affecting the target gene specificity of TP53 (Jansson et al., 2008). The BRCA1 p.Q1281P variant occurs in a known binding site of the ATR kinase that phosphorylates BRCA1 site p.S1280 in response to DNA damage (Tibbetts et al., 2000). The substitution replaces a known kinase binding motif of ATR and induces a new motif preferred by cyclin dependent kinases (CDKs) (Figure S6) and potentially rewires signaling.
Overall, we systematically examined predisposition variants and their corresponding functional evidence of more than ten thousand samples. The catalog of pathogenic variants in 33 cancer types informs our knowledge of genetic inheritance of cancer. Further, the results showed that each germline allele should be carefully evaluated within the relevant context of its corresponding somatic genome and downstream expression. Such evidence will not only aid validation of pathogenic variants, but also prioritization within large pools of VUSs and discovery into the non-coding genome.
Star Methods
Contact for Reagent and Resource Sharing
Further information and requests for resources and reagents should be directed to and will be fulfilled by the Lead Contact, Li Ding: lding@wustl.edu
Experimental Model and Subject Details
TCGA samples
The Cancer Genome Atlas (TCGA) collected both tumor and non-tumor biospecimens from 10,224 human samples with informed consent under authorization of local institutional review boards (https://cancergenome.nih.gov/abouttcga/policies/informedconsent). TCGA sequence information was obtained from the database of Genotypes and Phenotypes (dbGaP). Sequence data from germline and tumor samples were downloaded by the Institute for Systems Biology Cancer Genomics Cloud (ISB-CGC) from the GDC legacy (GRCh37/hg19) archive.
Cell Lines
For the RET functional assay, we used HEK293T cells. The sex of the HEK293T cells is female. Cells were cultured at 37°C in DMEM (Corning) supplemented with 5% fetal bovine serum (FBS) (Thermo Fisher).
Method Details
Data Generation
Germline variant calling and filtering
For TCGA sequence data downloaded from the GDC, we selected one germline sample and up to one tumor sample per case according to the following procedure. Files designated as TCGA MC3 BAMs were prioritized due to their harmonization. A dockerized version of GenomeVIP (Mashl et al., 2017) was used to coordinate germline variant calling in the guise of integrating multiple tools: Germline SNVs were identified using Varscan (Koboldt et al., 2012) (version 2.3.8 with default parameters, except where –min-var-freq 0.10, --p-value 0.10, --min-coverage 3, --strand-filter 1) operating on a mpileup stream produced by SAMtools (version 1.2 with default parameters, except where -q 1 -Q 13) and GATK (McKenna et al., 2010) (version 3.5, using its haplotype caller in single-sample mode with duplicate and unmapped reads removed and retaining calls with a minimum quality threshold of 10). Germline indels were identified using Varscan (version and parameters as above) and GATK (version and parameters as above) in single-sample mode. We also applied Pindel (Ye et al., 2009) (version 0.2.5b8 with default parameters, except where -x 4, -I, -B 0, and -M 3 and excluded centromere regions (genome.ucsc.edu)) for indel prediction. For all analyses, we used the GRCh37-lite reference and specified an insertion size of 500 whenever this information was not provided in the BAM header.
All resulting variants were limited to coding regions of full-length transcripts obtained from Ensembl release 70 plus the additional two base pairs flanking each exon that cover splice donor/acceptor sites. Single nucleotide variants (SNVs) were based on the union of raw GATK and VarScan calls. We required that indels were called by at least two out of the three callers (GATK, Varscan, Pindel). In addition, we also included high-confidence, Pindel-unique calls (at least 30× coverage and 20% VAF).
We then further required the variants to have an Allelic Depth (AD) ≥ 5 for the alternative allele. A total of 49,123 variants passed these filters. We then conducted readcount analyses for these variants in both normal and tumor samples. We used bam-readcount (version 0.8.0 commit 1b9c52c, with parameters -q 10, -b 15) to quantify the number of reference and alternative alleles. We required the variants to have at least 5 counts of the alternative allele and an alternative allele frequency of at least 20%, resulting in 31,963 variants. Of these, we filtered for rare variants with ≤0.05% allele frequency in 1000 Genomes and ExAC (release r0.3.1).
We then selected for cancer-relevant pathogenic variants, based on whether they were found in the curated cancer variant database or in the curated cancer predisposition gene list, and their associated ClinVar trait. This resulted in 1,678 variants for manual review using the Integrative Genomics Viewer (IGV) software (Robinson et al., 2011). For candidate germline variants having the same genomic change as somatic mutations, we further filtered for the germline variants that may have originated from contaminated adjacent normal samples by eliminating variants called from adjacent normal, the VAF in normal < 30%, and co-localizing with any known somatic mutation. This results in the final 1,393 pass-QC variants for downstream analysis.
We further annotated the corresponding genes of variants as oncogenes or tumor suppressors. We compiled a gene list by combining the oncogenes and tumor suppressors from Vogelstein et al. (Vogelstein et al., 2013) and the GSEA database (Downloaded 2014-11-25). We removed NOTCH1 and NOTCH2 from the oncogene classification in GSEA given their controversial roles. We then further curated several genes, including additional tumor suppressors (ATR, BARD1, ERCC1, FANCI, FANCL, FANCM, POLD1, POLE, POLH, RAD50, RAD51, RAD51C, RAD51D, RAD54L, MAX) and additional oncogenes (AR, STAT3, TERT, MAP2K2).
Genotype data
We used SNP-array derived genotype data of 522,606 SNPs to infer the ethnicity of each sample. Birdseed genotype files of 11,459 samples were downloaded by ISB-CGC from the Genome Data Commons (GDC) legacy (GRCh37/hg19) archive and converted by us to individual VCF files (github.com/ding-lab/birdseed2vcf) for merging into a single combined VCF file. SNP-array genotypes were also used to assess the precision of germline variant calling in the exome (median precision: 0.99).
Somatic mutation calls
We used TCGA MC3 MAF v3 (updated 17 June 2016) for comprehensive somatic mutation calls across TCGA cancer samples. Specifically, we used mc3.v0.2.8.PUBLIC.maf (www.synapse.org/#!Synapse:syn7214402/files/) (Kyle et al., in review).
Somatic copy number variation
We used somatic CNV calls generated using GISTIC for the PanCanAtlas analyses working groups (https://www.synapse.org/#!Synapse:syn5049520.1).
The threshold for calling a somatic CNV was defined using a step-wise process:
We calculated the median log2 copy-ratio level for each arm.
We found the highest and lowest arm medians, H and L.
We opened a small margin H′=H+delta and L′=L-delta (delta=0.1).
We assigned +2 to any segment that is above H′, and -2 to segments below L′.
Segments that were between +delta and H′ get a +1 and segments between -delta and L′ get a -1.
Segments between -delta and +delta get a 0.
-2 scores track with homozygous deletions because whole arms are never homozygously deleted. However, since many tumors have undergone whole genome doubling, in tetraploid tumors and above the min arm level can be 2 copies, and so these -2 scores can represent those with either 0 or 1 copy of a gene. +2 scores track with high level focal amplification since these are usually beyond the highest arm level change. We considered somatics with -1 or -2 as a deletion and +1 or +2 as an amplification.
Clinical data
We used the clinical data provided by the PanCanAtlas clinical working group (https://www.synapse.org/#!Synapse:syn3241074/files/). For family history information, we used the Clinical data used by the MC3 working group. Ancestry calls of each sample was provided by the PanCanAtlas Ancestry Informative Markers (AIM) working group.
Bioinformatics Analyses
Database curation for variant classification
At the gene level, we extended the 114 cancer predisposition genes compiled by Rahman et al. (Rahman, 2014) to a total of 152 genes that contribute to cancer susceptibility based on literature review (Table S1). We added 15 genes based on the St. Jude PCGP germline study (both the autosomal dominant and autosomal recessive cancer predisposition genes), 11 genes from our curation of literature, 11 genes from Cancer Gene Census-Germline (Downloaded 1/5/2016 from http://cancer.sanger.ac.uk/census/) and DROSHA (personal communication with Gang Wu, St. Jude). Source and reference for each gene is attached in Table S1.
At the variant level, in addition to the ClinVar database, we compiled multiple curated gene-specific databases for more comprehensive coverage of known pathogenic variants. These included the IARC TP53 germline mutation database, NHGRI BRCA1 and BRCA2 BIC database (http://research.nhgri.nih.gov/bic/), ARUP MEN2 database for mutations in RET (http://www.arup.utah.edu/database/MEN2/MEN2_display.php), and the ASU database (http://telomerase.asu.edu/diseases.html) for TERT mutations. We included only the BRCA1 and BRCA2 variants marked as clinically important in the BIC database. We also limited our TP53 variants to those that were carried by an affected proband and confirmed as a germline variant in the IARC database. We used TransVar (Zhou et al., 2015) and customized scripts to convert all variant entries to standard HGVSg format to ensure proper matching.
Variant classification pipeline and panel review
Briefly, we developed an automatic pipeline termed CharGer (https://github.com/ding-lab/CharGer) to annotate and prioritize variants by adopting the AMP-ACMG guideline. For the automatic pipeline, we defined 12 pathogenic evidence levels and 4 benign evidence levels using a number of datasets, including ExAC and ClinVar (parsed through MacArthur lab ClinVar: https://github.com/macarthur-lab/clinvar), and computational tools including SIFT (Kumar et al., 2009) and PolyPhen (Adzhubei et al., 2013). The detailed implementation and score of each evidence level is as follows (Table S3):
PVS1, PSC1, PM4, PP2, and PPC1: variants in predisposing genes
Variants in the predisposition gene receive one of these evidence level assignments based on variant type and mode of inheritance. Truncations in susceptibility genes that harbor variants with a dominant mode of inheritance are assigned PVS1, but recessive variants in these genes are assigned PSC1. Considering the PVS1 criteria “null variant in a gene where LOF is a known mechanism of disease”, we only assigned this evidence to truncations in tumor suppressor genes but not oncogenes. Protein length changes due to inframe insertions or deletions or nonstop variants in genes that harbor variants with a dominant mode of inheritance receive a PM4, whereas recessives receive a PPC1. Finally, missense variants in susceptibility genes are tagged as PP2.
PS1 and PM5: pathogenic peptide changes
Variants that result in identical peptide changes as a previously known pathogenic variant on ClinVar (only those marked as Pathogenic but not Likely Pathogenic) or the compiled list are assigned a PS1. Variants that result in a different amino-acid change at the same position are assigned a PM5.
PM1: hotspot variants
HotSpot3D (Niu et al., 2016) was run on MC3 somatic mutation calls (hypermutators removed). The protein structure analysis of HotSpot3D identifies mutation clusters, enriched by recurrent and neighboring pockets of mutations. If a germline variant was found to be a somatic mutation with recurrence in at least two samples among all cancer types in a HotSpot3D cluster, then the variant is flagged with a pathogenic characterization of PM1.
PM2 and BA1: minor allele frequency in populations
Variants that are absent or that show extremely low frequency (MAF < 0.0005) in the ExAC dataset are assigned a PM2, whereas common variants (MAF > 0.05) receive a BA1.
PP3 and BP4: in silico analyses
Several ACMG scores use in silico evidence to determine disease association. We used evidence from SIFT (Kumar et al., 2009) and PolyPhen (Adzhubei et al., 2010), as annotated by VEP (McLaren et al., 2016). Each in silico analysis was taken as one piece of evidence and if both analyses identified as “damaging” or “deleterious” in SIFT (score <0.05) and “probably damaging” from PolyPhen (score >0.432), the variant was assigned a pathogenic characterization of PP3. Conversely, if both in silico analyses identify in opposition to PP3 characterization (>0.05 for SIFT, <0.432 for PolyPhen), then the variant achieves a benign characterization of BP4. The score from each fulfilled evidence level is then summed and classified as described in Figure 1C.
Detection of germline copy number variation events
Whole exome sequencing data on normal samples from 10,389 cases were used for germline CNV detection. XHMM was run as previously described (Ruderfer et al., 2016). Base-resolution coverage was calculated by the GATK DepthOfCoverage module (mapping quality > 20) on 209,486 Ensembl coding exon intervals (build GRCh37) retrieved from UCSC Table Browser. Exon targets with extreme GC content (> 90% or < 10%) or high fraction of repeat-masked bases (> 25%) or extreme length (< 10bp or > 10kbp) or low mean depth (< 10) were filtered out. The target-by-sample depth matrix was mean-centered by target dimension. Then principal component analysis was run to remove the systematic bias, where the top 152 components were removed (whose variances were higher than 70% of the mean variances of all components). The resulting depth matrix was normalized to sample-level z-score. During normalization, targets with high variance (standard deviation>50) were filtered out. CNVs discovery was performed using the Viterbi hidden Markov model (HMM) with default XHMM parameters. Quality for each called CNV was calculated by the forward-backward HMM algorithm, as previously described (Fromer and Purcell, 2014).
Array-based CNVs were filtered based on the number of probes (>10), length (>10kb), frequency (<1%), and absolute segment mean value (|log2(copy-number/2)| > 0.1). After filtering, the array-based CNV callset consisted of 209,559 CNVs found across 6464 individuals.
Analysis of germline variants in post-translational modification (PTM) sites
The dataset of pathogenic germline predisposition variants corresponding to amino acid substitutions were mapped to preferred isoforms and four types of post-translational modification (PTM) sites (phosphorylation, ubiquitination, acetylation, and methylation) using multiple databases, including ActiveDriverDB (Krassowski et al., 2018), PhosphoSitePlus (Hornbeck et al., 2015) and UniProt Knowledge Base (Consortium, 2017). This compiled dataset contains information about previously published PTM sites from experimental studies, such as mass spectrometry and western blots. Variants were considered to affect PTM sites if the corresponding amino acid substitutions affected protein sequence within +/- seven amino acids of the PTM site, similar to earlier studies (Reimand et al., 2013, 2015). Four categories of PTM site substitutions were considered: direct substitutions replaced the central amino acid undergoing post-translational modification, proximal substitutions affected amino acids within +/- two amino acids around the nearest PTM site, and distal substitutions affected amino acids within +/- three to seven amino acids around the nearest PTM site. This resulted in a total number of 316,216 experimentally collected sites; 239,559 phosphorylation sites, 39,493 ubiquitination sites, 13,376 methylation sites, and 23,787 acetylation sites. We further noted network-rewiring substitutions that induced or removed an amino acid near a PTM site that occurred within a kinase binding motif as predicted by the MIMP algorithm (Wagih et al., 2015). Evidence of kinases and other enzymes involved in the mutated PTM sites was also extracted from the databases and associated to primary literature.
Co-localizing and co-clustering of somatic mutations and germline variants
We used somatic mutation calls from the TCGA MC3 MAF, defining germline variants located at the same protein residue as recurrent (n ≥ 3) somatic mutations as co-localizing. We adapted our previously published tool HotSpot3D (Niu et al., 2016)(v.1.8.0) to conduct co-clustering of TCGA MC3 somatic mutations and pathogenic or likely pathogenic germline variants in genes with available PDB structures.
RET variant function assays
HEK293T cells were authenticated by DNA finger printing targeting short tandem repeat (STR) profiles through Genetica Cell Line Testing. They are negative for mycoplasma as determined by the absence of extranuclear signals in DAPI staining. Cells were cultured at 37°C in DMEM (Corning) supplemented with 5% fetal bovine serum (FBS) (Thermo Fisher). Constructions expressing RET variants were generated by Q5 site-directed mutagenesis (New England BioLabs) using a plasmid expressing a wild-type RET (pcDNA3RET9) (Chatterjee et al., 2012) as a template. All constructs were confirmed by sequencing. Cells were transiently transfected with wild-type or mutant RET constructs using Lipofectamine 2000 (Invitrogen Life Technologies) in six-well plates. Twenty-four hours after transfection, cells were switched to medium containing 0.5% FBS for 24 h before the initiation of 20 minutes of treatment with GDNF (100nM) in a subset of samples. Cells were lysed in buffer containing 20 mM Tris-HCl (pH 7.5), 150 mM NaCl, 1 mM Na2EDTA, 1 mM EGTA, 1% NP-40, 1% sodium deoxycholate, 2.5 mM sodium pyrophosphate, 1 mM β-glycerophosphate, 1 mM sodium orthovanadate, and 1 μg/ml leupeptin (Cell Signaling Technology). Protease and phosphatase inhibitors (Roche) were added immediately before use. Samples (15 ug/lane) were boiled in standard commercial SDS-gel loading buffer and run on SDS 10% polyacrylamide gels. Immunoblotting was performed on Immobilon-P PVDF membrane (Millipore). The following antibodies were used for immunoblotting: rabbit monoclonal anti-phospho-p44/42 MAPK (Erk1/2) (Thr202/204) antibodies (Cell Signaling #4370S, at 1:1000 dilution), rabbit polyclonal anti-RET (C31B4) antibodies (Cell Signaling #3223S, at 1:1000 dilution), rabbit monoclonal anti-GAPDH antibodies (Cell Signaling #5174, at 1:1000 dilution), rabbit monoclonal anti-phospho-RET (Tyr905) antibodies (Cell Signaling #3221 1:1000 dilution), rabbit monoclonal anti-phospho-AKT (Ser473) antibodies (Cell Signaling #4060 1:1000 dilution), mouse monoclonal anti-RET (C-3) antibodies (Santa Cruz Biotechnologies #sc-365943 1:100 dilution). Appropriate secondary antibodies with infrared dyes (LI-COR) were used, such as donkey anti-rabbit antibodies for the 680nm channel (LI-COR 926-6807) and donkey anti-mouse antibodies for the 800nm channel (LI_COR 926-32212). Protein bands were visualized using the Odyssey Infrared Imaging System (LI-COR) and further quantified by ImageJ.
Quantification And Statistical Analysis
Burden testing of pathogenic variants
We adapted the Total Frequency Test (TFT) (Basu and Pan, 2011) by collapsing pathogenic and likely pathogenic germline variants to the gene level. We then used total allele counts of pathogenic variants identified in the ExAC nonTCGA cohort using the same CharGer classification pipeline for comparison. We deemed one cancer type shows potentially increased burden of a specific gene if the TFT test against ExAC returned FDR < 0.15.
We then tested burden of pathogenic variants for each cancer type and each gene against all other cancer cohorts as controls, subtracting out the cohorts showing suggestive enrichment for the specific gene in the ExAC analyses. Since all our cohorts are called using the same variant calling pipeline, it avoids the potential danger of comparing against ExAC, which was done in a different batch of variant calls. The resulting P values were adjusted to FDR using the standard Benjamini-Hochberg procedure. We subsequently defined significant and suggestive events in terms of FDR thresholds of 0.05 and 0.15, respectively.
Loss of heterozygosity (LOH) and biallelic events analysis
We applied our previously developed statistical analysis method regarding LOH (Lu et al., 2015b) to individually test the missense and truncation germline variant sets. We tested variants in genes carrying pathogenic or likely pathogenic variants and used variants in other genes to build the null distribution. The resulting P values were adjusted to FDR again using the standard Benjamini-Hochberg procedure. We subsequently defined significant and suggestive events in terms of FDR thresholds of 0.05 and 0.15, respectively. We further captured additional events of suggestive LOH using a criteria of tumor VAF > 0.6 and normal VAF < 0.6.
We then devised an algorithm to classify observed LOH events (both significant and suggestive, FDR < 0.15) as:
Wild-type allele copy number deletion (of the wild type allele): GISTIC CNV result shows lower ploidy below threshold in the gene region. In these reads, the variant allele is significantly enriched compared to the wild type allele, which is likely loss.
Alternative allele copy number amplification: GISTIC CNV result shows higher ploidy above threshold in the gene region. In these reads, the variant allele, which is likely amplified, is significantly enriched compared to the wild type allele.
For biallelic events analysis, we systematically examined the cases carrying both a pathogenic or likely pathogenic germline variant and a missense or truncating somatic mutation in the same gene. The lolliplots are constructed and modified from the PCGP protein paint (https://pecan.stjude.org/proteinpaint) based on the specified RefSeq transcript.
Gene expression analysis
TCGA level-3 normalized RNA expression data were downloaded from Firehose (2016/1/28 analysis archive). The expression percentile of individual genes in each cancer cohort was calculated using the empirical cumulative distribution function (ecdf), as implemented in R. We then used the two-sample Kolmogorov-Smirnov test to compare the expression percentile distribution between variants of oncogenes and tumor suppressors. We also applied the linear regression model to evaluate the protein/phosphoprotein expression percentile difference between carriers of pathogenic or likely pathogenic variant and non-carriers in cancers where there are at least 3 carriers. The resulting P values were adjusted to FDR again using the standard Benjamini-Hochberg procedure.
To examine the possible location-based effect of truncations, we fitted a linear regression model using expression percentile as the dependent variable and a Boolean indicator to label whether or not the truncation is located at the last 50 base pair of the transcript, controlling for variant classification and truncation variant type.
RPPA analysis
TCGA level-3 normalized RPPA expression data of the tumor samples were downloaded from Firehose (2016/1/28 analysis archive). The expression percentile of individual genes in each cancer cohort was calculated using the empirical cumulative distribution function (ecdf), as implemented in R. We then applied the linear regression model to evaluate the protein/phosphoprotein expression percentile difference between carriers of pathogenic or likely pathogenic variant and non-carriers in cancers where there are at least 3 carriers. The resulting P values were adjusted to FDR again using the standard Benjamini-Hochberg procedure.
Association testing of single variants
We conducted association testing of pathogenic germline variants using a one-tailed Fisher's exact test where the alternative hypothesis assumes the tested variant is enriched in TCGA cases compared to non-TCGA cases in the ExAC data (release r0.3.1). To avoid potential false discovery due to population structures, we used the most powered cohort in ExAC, the Non-Finnish European that included 33,370 samples. For allele numbers (AN) and allele counts (AC), we used the adjusted counts, where only individuals with genotype quality (GQ) ≥ 20 and depth (DP) ≥ 10 were included. Vcfanno (Pedersen et al., 2016) was used to annotate allele frequencies of the germline variants. TCGA allele counts were inferred through subtracting ExAC non-TCGA allele counts from ExAC total allele counts. We conducted the single variant association analysis for all alleles.
Enrichment of variants overlapping somatic mutation and PCGP pathogenic variants
To test whether there is a significant overlap between pathogenic germline variants and (1) recurrent somatic mutation, and (2) PCGP pathogenic variants, we conducted a one-sided exact Poisson test where the alternative hypothesis is that the true event rate (overlapping rate) is higher than the background rate. The background event rate is defined as the number of (1) recurrent somatic mutation and (2) PCGP variants divided by the size of the exon (49,586,385 bp) that we conduct our analysis based on. The time base of the event is defined as the number of likely pathogenic or pathogenic variants we observed (n=852).
Enrichment of variants in PTM sites
To evaluate the enrichment of pathogenic variants in PTM sites, we conducted an empirical permutation-based enrichment test by sampling protein substitutions from the 1,000 Genomes dataset as controls. We only focused on the subset of proteins with at least one PTM site. We then sampled substitutions equal to the number of observed pathogenic amino acid substitutions for 100,000 iterations. The median number of PTM-associated substitutions expected by chance alone was eight. We then used this estimate as the rate parameter to the Poisson distribution, deriving a p-value from the probability of observing an equal or greater number of PTM-associated substitutions to our observed number of unique PTM-associated substitutions among pathogenic cancer variants.
Age at onset association analysis
We used a linear regression model to identify associations between age at onset and germline variant carrier of predisposition genes. We then tested genes with greater than or equal to 3 pathogenic and likely pathogenic variants and 1% carriers in individual cancer cohorts. For both the ethnicity and age at onset association analyses, the resulting P values were again adjusted using the Benjamini-Hochberg procedure.
Statistical analysis of activity of RET variants
Statistical testing of the western blotting data quantified using ImageJ was conducted using the R programming language. T-test using pooled SD was applied to compare the normalized ratio of pMAPK/RET/GAPDH or pMAPK/GAPDH for cells carrying each of the mutant construct vs. wilt-type construct.
Data and Software Availability
Data Availability
Researchers who are authorized can apply for access to the data through the germline project hosted on the ISB cancer genome cloud (ISB-CGC). Detailed procedure can be found on the ISB-CGC website: http://isb-cancer-genomics-cloud.readthedocs.io/en/latest/sections/webapp/Gaining-Access-To-Contolled-Access-Data.html. Resource for familiarizing with related cloud computational tools are documented in the github page: https://github.com/ding-lab/PanCanAtlasGermline. Intermediate files used in this study are listed here: https://docs.google.com/document/d/1ymdfAnRR4o4-20bwHI3vPaRPRuoqtqc0pNUVYO2oiPc/edit?usp=sharing. All final results published in this study used the germline variant call data from release1.1. All de-identified pathogenic or likely pathogenic variants and prioritized VUSs used in this study, along with their attributes, can be found in Table S2.
Code Availability
Analysis codes are available at github.com/ding-lab/PanCanAtlasGermline. GenomeVIP Code for is available at github.com/ding-lab/GenomeVIP. CharGer code is available at github.com/ding-lab/CharGer. Birdseed conversion code is available at github.com/ding-lab/birdseed2vcf.
Supplementary Material
Figure S1. Quality control of samples and germline variants. Related to Figure 1. (A) Coverage distribution for each of the samples used for variant calling. (B) Average coverages of 152 predisposition genes known to harbor rare, pathogenic variants. 10,389 samples were retained after all quality control procedure. (C) Concordance of variant calls with genotype data. Samples with less than 60% concordance were eliminated in the final set of 10,389 samples. (D) Estimated false positive rate of variant calls in each cancer types evaluated through negative selection against impactful mutations. Adjacent normals (instead of blood normals) were predominant for the KIRC and LAML project, presenting special challenges for variant calling; downstream filtering processes ensured the quality of pathogenic variants found in these samples. (E) Number of exonic variants identified in each of the normal sample the across 33 cancer types. Each dot indicates an individual colored by their ancestry as determined by PanCanAtlas AIM working group. Samples with lower than 15,000 exonic variants were filtered out.
Figure S2. Variant classification workflow. Related to Figure 1. (A) The process of going from more than 285 million germline variants in exons to the final set of 1,393 pathogenic/likely pathogenic variants and prioritized VUSs using CharGer. (B) Number of pathogenic and likely pathogenic variants identified in each of the 152 cancer predisposition genes curated using different sources. Each dot represents a gene and the labeled ones are the newly added genes (beyond the 114 from Rahman et al.) having more than 10 variants. (C) Pathogenic or likely pathogenic variants identified in this study compared to the previously reported variants from our 2015 pan-cancer germline study (Lu et al., 2015b). (D) Prioritized VUSs nominated through multiple lines of evidences including case-control frequency, loss of heterozygosity, expression association, and co-localization with recurrent mutations and PTM residues.
Figure S3. Further investigation of two-hit events. Related to Figure 3. (A) Rates of LOH associated with BRCA1/2 germline variants in BRCA, OV and other cancer types. (B) IGV screen shots showing a biallelic event in mutually exclusive sequencing reads in a COAD case carrying a paired MSH p.R248fs germline variant/p.R248* somatic mutation.
Figure S4. Number of truncations associated with bottom 25% gene expression in the carrier across different predisposition genes. Observing truncating variants does not guarantee low gene expression in the carrier. Related to Figure 4.
Figure S5. Germline copy number deletions identified using both whole exome sequencing and SNP-array data. Related to Figure 5. (A) A BRCA1 deletion identified in an OV sample and an NF1 deletions identified in an PCPG sample using both datatypes. (B) Deletions identified in associated cancer-gene pairs showed reduced gene expression in the carrier sample whereas an average deletion in 152 predisposition gene does not show such association.
Figure S6. Cancer-associated germline variants in PTM sites implicate potential mechanistic hypotheses. Related to Figure 6. (A) More than 45% of protein amino acid substitutions in our dataset affect post-translational modification (PTM) sites, significantly more than expected from chance alone. Direct substitutions replace post-translationally modified amino acids with non-modified acids (dark red), and proximal and distal substitutions lie within 1-2 and 3-7 amino acids from closest PTM site (orange and yellow, respectively). (B) The majority of PTM-associated substitutions affect phosphorylation, the largest PTM dataset in our study. Substitutions that affect sites with multiple different types of PTM are also apparent. (C) Genes with germline substitutions in PTM sites include known cancer genes like TP53, BRCA1, RET, VHL, PTEN, and others. Colors represent the impact of variants on PTM sites. (D) Analysis of extended germline variant data from TCGA shows that TP53 carries six germline substitutions in three protein methylation sites that are known to regulate its DNA damage response through altered target gene specificity. (E) MET and ATM substitutions are predicted to induce motif rewiring events that lead to the loss of an existing AKT1 binding site and the introduction of a new binding site for AURKA, respectively. (F) Site-specific interaction network of predicted enzyme-substrate interactions as predicted by the MIMP algorithm.
Figure S7. Variants in familial cases and power to identify predisposition genes in case-control cohorts. Related to Figure 2. (A) Pathogenic variants identified in the 552 cancer cases with known familial history of cancer. Each color indicates the type of familial history recorded in the TCGA clinical data. (B) Power analysis of burden analysis to identify predisposition genes in cohort sizes ranging from 100 to 300k.
Table S1. Evidence and reference used for automated classification of germline variants using CharGer. Related to Figure 1. (A) List of 152 cancer predisposition genes. (B) Depth-of-coverage for 152 gene regions of each sample. (C) Evidence level used in CharGer classification.
Table S2. Predisposition variants. Related to Figure 2. (A) Pathogenic or likely pathogenic germline variants. (B) Prioritized variants of unknown significance (VUSs). (C) Variants of pleiotropic genes and their relation to cancer. (D) Prioritized VUSs nominated by more than one line of evidences.
Table S3. Carrier frequency and enrichment of pathogenic or likely pathogenic variants in 33 cancer types. Related to Figure 2. (A) Frequency of pathogenic and likely pathogenic variants in each of the 33 cancer types. (B) Genes associated with higher enrichment of variants across cancer types. (C) In each cancer, previous TCGA investigation of germline variants and associations reported by other studies and potential novel associations.
Table S4. Two-hit events associated with germline variants. Related to Figure 3. (A) Counts of allele-specific LOHs observed for each gene category. (B) Bi-allelic events coupled with pathogenic or likely pathogenic variants.
Table S5. Expression of gene and gene products in variant carriers of each cancer type. Related to Figure 4. (A) Genes associated with altered expressions in variant carriers using RNA-Seq data. (B) Proteins/phosphoproteins associated with altered expressions in variant carriers using RPPA data.
Table S6. Variants with additional lines of functional evidence. Related to Figure 6 and Figure 7. (A) Variants associated with enrichment in cancer vs. controls. (B) Variants co-localized with pathogenic variants in pediatric cancer or recurrent somatic mutations. (C)Variants validated in additional cancer cases of the MDACC cohort. (D) Variants overlapping or adjacent to PTM sites. (E) Co-clustering germline variants and somatic mutations. (F) Result of functional validation of the RET germline alleles.
Table S7. Genes associated with younger age at onset in variant carriers in each cancer type. Related to Figure 2.
Highlights.
871 predisposition variants/CNVs discovered in 8% of 10,389 cases of 33 cancers
Pan-cancer approach identified shared variants and genes across cancers
33 variants affecting activating domains of oncogenes showed high expression
47 VUSs prioritized using cancer enrichment, LOH, expression and other evidence
A pan-cancer analysis identifies hundreds of predisposing germline variants
Acknowledgments
The authors wish to acknowledge The Cancer Genome Atlas. This work was supported by the following grants: U54 HG003273, U54 HG003067, U54 HG003079, U24 CA143799, U24 CA143835, U24 CA143840, U24 CA143843, U24 CA143845, U24 CA143848, U24 CA143858, U24 CA143866, U24 CA143867, U24 CA143882, U24 CA143883, U24 CA144025, U24 CA210969, U24 CA210988, U24 CA211006, R01 CA180006 and R01 HG009711.
Secondary author list
Samantha J. Caesar-Johnson, John A. Demchok, Ina Felau, Melpomeni Kasapi, Martin L. Ferguson, Carolyn M. Hutter, Heidi J. Sofia, Roy Tarnuzzer, Zhining Wang, Liming Yang, Jean C. Zenklusen, Jiashan (Julia) Zhang, Sudha Chudamani, Jia Liu, Laxmi Lolla, Rashi Naresh, Todd Pihl, Qiang Sun, Yunhu Wan, Ye Wu, Juok Cho, Timothy DeFreitas, Scott Frazer, Nils Gehlenborg, Gad Getz, David I. Heiman, Jaegil Kim, Michael S. Lawrence, Pei Lin, Sam Meier, Michael S. Noble, Gordon Saksena, Doug Voet, Hailei Zhang, Brady Bernard, Nyasha Chambwe, Varsha Dhankani, Theo Knijnenburg, Roger Kramer, Kalle Leinonen, Yuexin Liu, Michael Miller, Sheila Reynolds, Ilya Shmulevich, Vesteinn Thorsson, Wei Zhang, Rehan Akbani, Bradley M. Broom, Apurva M. Hegde, Zhenlin Ju, Rupa S. Kanchi, Anil Korkut, Jun Li, Han Liang, Shiyun Ling, Wenbin Liu, Yiling Lu, Gordon B. Mills, Kwok-Shing Ng, Arvind Rao, Michael Ryan, Jing Wang, John N. Weinstein, Jiexin Zhang, Adam Abeshouse, Joshua Armenia, Debyani Chakravarty, Walid K. Chatila, Ino de Bruijn, Jianjiong Gao, Benjamin E. Gross, Zachary J. Heins, Ritika Kundra, Konnor La, Marc Ladanyi, Augustin Luna, Moriah G. Nissan, Angelica Ochoa, Sarah M. Phillips, Ed Reznik, Francisco Sanchez-Vega, Chris Sander, Nikolaus Schultz, Robert Sheridan, S. Onur Sumer, Yichao Sun, Barry S. Taylor, Jioajiao Wang, Hongxin Zhang, Pavana Anur, Myron Peto, Paul Spellman, Christopher Benz, Joshua M. Stuart, Christopher K. Wong, Christina Yau, D. Neil Hayes, Joel S. Parker, Matthew D. Wilkerson, Adrian Ally, Miruna Balasundaram, Reanne Bowlby, Denise Brooks, Rebecca Carlsen, Eric Chuah, Noreen Dhalla, Robert Holt, Steven J.M. Jones, Katayoon Kasaian, Darlene Lee, Yussanne Ma, Marco A. Marra, Michael Mayo, Richard A. Moore, Andrew J. Mungall, Karen Mungall, A. Gordon Robertson, Sara Sadeghi, Jacqueline E. Schein, Payal Sipahimalani, Angela Tam, Nina Thiessen, Kane Tse, Tina Wong, Ashton C. Berger, Rameen Beroukhim, Andrew D. Cherniack, Carrie Cibulskis, Stacey B. Gabriel, Galen F. Gao, Gavin Ha, Matthew Meyerson, Steven E. Schumacher, Juliann Shih, Melanie H. Kucherlapati, Raju S. Kucherlapati, Stephen Baylin, Leslie Cope, Ludmila Danilova, Moiz S. Bootwalla, Phillip H. Lai, Dennis T. Maglinte, David J. Van Den Berg, Daniel J. Weisenberger, J. Todd Auman, Saianand Balu, Tom Bodenheimer, Cheng Fan, Katherine A. Hoadley, Alan P. Hoyle, Stuart R. Jefferys, Corbin D. Jones, Shaowu Meng, Piotr A. Mieczkowski, Lisle E. Mose, Amy H. Perou, Charles M. Perou, Jeffrey Roach, Yan Shi, Janae V. Simons, Tara Skelly, Matthew G. Soloway, Donghui Tan, Umadevi Veluvolu, Huihui Fan, Toshinori Hinoue, Peter W. Laird, Hui Shen, Wanding Zhou, Michelle Bellair, Kyle Chang, Kyle Covington, Chad J. Creighton, Huyen Dinh, HarshaVardhan Doddapaneni, Lawrence A. Donehower, Jennifer Drummond, Richard A. Gibbs, Robert Glenn, Walker Hale, Yi Han, Jianhong Hu, Viktoriya Korchina, Sandra Lee, Lora Lewis, Wei Li, Xiuping Liu, Margaret Morgan, Donna Morton, Donna Muzny, Jireh Santibanez, Margi Sheth, Eve Shinbrot, Linghua Wang, Min Wang, David A. Wheeler, Liu Xi, Fengmei Zhao, Julian Hess, Elizabeth L. Appelbaum, Matthew Bailey, Matthew G. Cordes, Li Ding, Catrina C. Fronick, Lucinda A. Fulton, Robert S. Fulton, Cyriac Kandoth, Elaine R. Mardis, Michael D. McLellan, Christopher A. Miller, Heather K. Schmidt, Richard K. Wilson, Daniel Crain, Erin Curley, Johanna Gardner, Kevin Lau, David Mallery, Scott Morris, Joseph Paulauskis, Robert Penny, Candace Shelton, Troy Shelton, Mark Sherman, Eric Thompson, Peggy Yena, Jay Bowen, Julie M. Gastier-Foster, Mark Gerken, Kristen M. Leraas, Tara M. Lichtenberg, Nilsa C. Ramirez, Lisa Wise, Erik Zmuda, Niall Corcoran, Tony Costello, Christopher Hovens, Andre L. Carvalho, Ana C. de Carvalho, José H. Fregnani, Adhemar Longatto-Filho, Rui M. Reis, Cristovam Scapulatempo-Neto, Henrique C.S. Silveira, Daniel O. Vidal, Andrew Burnette, Jennifer Eschbacher, Beth Hermes, Ardene Noss, Rosy Singh, Matthew L. Anderson, Patricia D. Castro, Michael Ittmann, David Huntsman, Bernard Kohl, Xuan Le, Richard Thorp, Chris Andry, Elizabeth R. Duffy, Vladimir Lyadov, Oxana Paklina, Galiya Setdikova, Alexey Shabunin, Mikhail Tavobilov, Christopher McPherson, Ronald Warnick, Ross Berkowitz, Daniel Cramer, Colleen Feltmate, Neil Horowitz, Adam Kibel, Michael Muto, Chandrajit P. Raut, Andrei Malykh, Jill S. Barnholtz-Sloan, Wendi Barrett, Karen Devine, Jordonna Fulop, Quinn T. Ostrom, Kristen Shimmel, Yingli Wolinsky, Andrew E. Sloan, Agostino De Rose, Felice Giuliante, Marc Goodman, Beth Y. Karlan, Curt H. Hagedorn, John Eckman, Jodi Harr, Jerome Myers, Kelinda Tucker, Leigh Anne Zach, Brenda Deyarmin, Hai Hu, Leonid Kvecher, Caroline Larson, Richard J. Mural, Stella Somiari, Ales Vicha, Tomas Zelinka, Joseph Bennett, Mary Iacocca, Brenda Rabeno, Patricia Swanson, Mathieu Latour, Louis Lacombe, Bernard Têtu, Alain Bergeron, Mary McGraw, Susan M. Staugaitis, John Chabot, Hanina Hibshoosh, Antonia Sepulveda, Tao Su, Timothy Wang, Olga Potapova, Olga Voronina, Laurence Desjardins, Odette Mariani, Sergio Roman-Roman, Xavier Sastre, Marc-Henri Stern, Feixiong Cheng, Sabina Signoretti, Andrew Berchuck, Darell Bigner, Eric Lipp, Jeffrey Marks, Shannon McCall, Roger McLendon, Angeles Secord, Alexis Sharp, Madhusmita Behera, Daniel J. Brat, Amy Chen, Keith Delman, Seth Force, Fadlo Khuri, Kelly Magliocca, Shishir Maithel, Jeffrey J. Olson, Taofeek Owonikoko, Alan Pickens, Suresh Ramalingam, Dong M. Shin, Gabriel Sica, Erwin G. Van Meir, Hongzheng Zhang, Wil Eijckenboom, Ad Gillis, Esther Korpershoek, Leendert Looijenga, Wolter Oosterhuis, Hans Stoop, Kim E. van Kessel, Ellen C. Zwarthoff, Chiara Calatozzolo, Lucia Cuppini, Stefania Cuzzubbo, Francesco DiMeco, Gaetano Finocchiaro, Luca Mattei, Alessandro Perin, Bianca Pollo, Chu Chen, John Houck, Pawadee Lohavanichbutr, Arndt Hartmann, Christine Stoehr, Robert Stoehr, Helge Taubert, Sven Wach, Bernd Wullich, Witold Kycler, Dawid Murawa, Maciej Wiznerowicz, Ki Chung, W. Jeffrey Edenfield, Julie Martin, Eric Baudin, Glenn Bubley, Raphael Bueno, Assunta De Rienzo, William G. Richards, Steven Kalkanis, Tom Mikkelsen, Houtan Noushmehr, Lisa Scarpace, Nicolas Girard, Marta Aymerich, Elias Campo, Eva Giné, Armando López Guillermo, Nguyen Van Bang, Phan Thi Hanh, Bui Duc Phu, Yufang Tang, Howard Colman, Kimberley Evason, Peter R. Dottino, John A. Martignetti, Hani Gabra, Hartmut Juhl, Teniola Akeredolu, Serghei Stepa, Dave Hoon, Keunsoo Ahn, Koo Jeong Kang, Felix Beuschlein, Anne Breggia, Michael Birrer, Debra Bell, Mitesh Borad, Alan H. Bryce, Erik Castle, Vishal Chandan, John Cheville, John A. Copland, Michael Farnell, Thomas Flotte, Nasra Giama, Thai Ho, Michael Kendrick, Jean-Pierre Kocher, Karla Kopp, Catherine Moser, David Nagorney, Daniel O'Brien, Brian Patrick O'Neill, Tushar Patel, Gloria Petersen, Florencia Que, Michael Rivera, Lewis Roberts, Robert Smallridge, Thomas Smyrk, Melissa Stanton, R. Houston Thompson, Michael Torbenson, Ju Dong Yang, Lizhi Zhang, Fadi Brimo, Jaffer A. Ajani, Ana Maria Angulo Gonzalez, Carmen Behrens, Jolanta Bondaruk, Russell Broaddus, Bogdan Czerniak, Bita Esmaeli, Junya Fujimoto, Jeffrey Gershenwald, Charles Guo, Alexander J. Lazar, Christopher Logothetis, Funda Meric-Bernstam, Cesar Moran, Lois Ramondetta, David Rice, Anil Sood, Pheroze Tamboli, Timothy Thompson, Patricia Troncoso, Anne Tsao, Ignacio Wistuba, Candace Carter, Lauren Haydu, Peter Hersey, Valerie Jakrot, Hojabr Kakavand, Richard Kefford, Kenneth Lee, Georgina Long, Graham Mann, Michael Quinn, Robyn Saw, Richard Scolyer, Kerwin Shannon, Andrew Spillane, Jonathan Stretch, Maria Synott, John Thompson, James Wilmott, Hikmat Al-Ahmadie, Timothy A. Chan, Ronald Ghossein, Anuradha Gopalan, Douglas A. Levine, Victor Reuter, Samuel Singer, Bhuvanesh Singh, Nguyen Viet Tien, Thomas Broudy, Cyrus Mirsaidi, Praveen Nair, Paul Drwiega, Judy Miller, Jennifer Smith, Howard Zaren, Joong-Won Park, Nguyen Phi Hung, Electron Kebebew, W. Marston Linehan, Adam R. Metwalli, Karel Pacak, Peter A. Pinto, Mark Schiffman, Laura S. Schmidt, Cathy D. Vocke, Nicolas Wentzensen, Robert Worrell, Hannah Yang, Marc Moncrieff, Chandra Goparaju, Jonathan Melamed, Harvey Pass, Natalia Botnariuc, Irina Caraman, Mircea Cernat, Inga Chemencedji, Adrian Clipca, Serghei Doruc, Ghenadie Gorincioi, Sergiu Mura, Maria Pirtac, Irina Stancul, Diana Tcaciuc, Monique Albert, Iakovina Alexopoulou, Angel Arnaout, John Bartlett, Jay Engel, Sebastien Gilbert, Jeremy Parfitt, Harman Sekhon, George Thomas, Doris M. Rassl, Robert C. Rintoul, Carlo Bifulco, Raina Tamakawa, Walter Urba, Nicholas Hayward, Henri Timmers, Anna Antenucci, Francesco Facciolo, Gianluca Grazi, Mirella Marino, Roberta Merola, Ronald de Krijger, Anne-Paule Gimenez-Roqueplo, Alain Piché, Simone Chevalier, Ginette McKercher, Kivanc Birsoy, Gene Barnett, Cathy Brewer, Carol Farver, Theresa Naska, Nathan A. Pennell, Daniel Raymond, Cathy Schilero, Kathy Smolenski, Felicia Williams, Carl Morrison, Jeffrey A. Borgia, Michael J. Liptay, Mark Pool, Christopher W. Seder, Kerstin Junker, Larsson Omberg, Mikhail Dinkin, George Manikhas, Domenico Alvaro, Maria Consiglia Bragazzi, Vincenzo Cardinale, Guido Carpino, Eugenio Gaudio, David Chesla, Sandra Cottingham, Michael Dubina, Fedor Moiseenko, Renumathy Dhanasekaran, Karl-Friedrich Becker, Klaus-Peter Janssen, Julia Slotta-Huspenina, Mohamed H. Abdel-Rahman, Dina Aziz, Sue Bell, Colleen M. Cebulla, Amy Davis, Rebecca Duell, J. Bradley Elder, Joe Hilty, Bahavna Kumar, James Lang, Norman L. Lehman, Randy Mandt, Phuong Nguyen, Robert Pilarski, Karan Rai, Lynn Schoenfield, Kelly Senecal, Paul Wakely, Paul Hansen, Ronald Lechan, James Powers, Arthur Tischler, William E. Grizzle, Katherine C. Sexton, Alison Kastl, Joel Henderson, Sima Porten, Jens Waldmann, Martin Fassnacht, Sylvia L. Asa, Dirk Schadendorf, Marta Couce, Markus Graefen, Hartwig Huland, Guido Sauter, Thorsten Schlomm, Ronald Simon, Pierre Tennstedt, Oluwole Olabode, Mark Nelson, Oliver Bathe, Peter R. Carroll, June M. Chan, Philip Disaia, Pat Glenn, Robin K. Kelley, Charles N. Landen, Joanna Phillips, Michael Prados, Jeffry Simko, Karen Smith-McCune, Scott VandenBerg, Kevin Roggin, Ashley Fehrenbach, Ady Kendler, Suzanne Sifri, Ruth Steele, Antonio Jimeno, Francis Carey, Ian Forgie, Massimo Mannelli, Michael Carney, Brenda Hernandez, Benito Campos, Christel Herold-Mende, Christin Jungk, Andreas Unterberg, Andreas von Deimling, Aaron Bossler, Joseph Galbraith, Laura Jacobus, Michael Knudson, Tina Knutson, Deqin Ma, Mohammed Milhem, Rita Sigmund, Andrew K. Godwin, Rashna Madan, Howard G. Rosenthal, Clement Adebamowo, Sally N. Adebamowo, Alex Boussioutas, David Beer, Thomas Giordano, Anne-Marie Mes-Masson, Fred Saad, Therese Bocklage, Lisa Landrum, Robert Mannel, Kathleen Moore, Katherine Moxley, Russel Postier, Joan Walker, Rosemary Zuna, Michael Feldman, Federico Valdivieso, Rajiv Dhir, James Luketich, Edna M. Mora Pinero, Mario Quintero-Aguilo, Carlos Gilberto Carlotti, Jr., Jose Sebastião Dos Santos, Rafael Kemp, Ajith Sankarankuty, Daniela Tirapelli, James Catto, Kathy Agnew, Elizabeth Swisher, Jenette Creaney, Bruce Robinson, Carl Simon Shelley, Eryn M. Godwin, Sara Kendall, Cassaundra Shipman, Carol Bradford, Thomas Carey, Andrea Haddad, Jeffey Moyer, Lisa Peterson, Mark Prince, Laura Rozek, Gregory Wolf, Rayleen Bowman, Kwun M. Fong, Ian Yang, Robert Korst, W. Kimryn Rathmell, J. Leigh Fantacone-Campbell, Jeffrey A. Hooke, Albert J. Kovatich, Craig D. Shriver, John DiPersio, Bettina Drake, Ramaswamy Govindan, Sharon Heath, Timothy Ley, Brian Van Tine, Peter Westervelt, Mark A. Rubin, Jung Il Lee, Natália D. Aredes, and Armaz Mariamidze
Footnotes
Author Contributions: L.D. conceived and supervised research. K.H. and L.D. devised analysis strategies and directed data analysis. F.C. designed and supervised functional studies; directed data analyses and provided molecular biology expertise. R.J.M., M.P., J.R., J.W., F.A.M. and K.H. conducted variant calling, filtering and annotation. R.J., K.H., R.J.M., K.E.H, P.C.B., Y.W.K. and A.K conducted variant and sample quality control analyses. K.H., A.D.S., K.C., V.W., K.J., S.K. and L.D. conducted variant classification. K.H., J.W., M.X., M.P., C.L., J.R., N.O., D.C.Z, L.W. and M.D.M. performed data analysis. S.C., D.R., S.P., and K.H. performed family analysis. K.H., M.A.W., J.M. J.R., N.O. and L.D. prepared figures and tables. S.P., F.M.B., R.G., F.C., A.J.L., F.A.M. W.Z., and J.F.D. provided disease expertise. C.O. and D.L. conducted functional assay experiments. S.J. provided materials and expertise for functional studies. K.H., M.K. and M.C.W. performed statistical analysis. K.H., J.R., F.C., and L.D. wrote the manuscript. M.C.W., S.P., K.C., J.F.D., A.J.L., D.I.R. and F.A.M. edited the manuscript. All authors read and approved the manuscript.
Declaration Of Interests: The authors declare no competing financial interests.
Publisher's Disclaimer: This is a PDF file of an unedited manuscript that has been accepted for publication. As a service to our customers we are providing this early version of the manuscript. The manuscript will undergo copyediting, typesetting, and review of the resulting proof before it is published in its final citable form. Please note that during the production process errors may be discovered which could affect the content, and all legal disclaimers that apply to the journal pertain.
References
- Adzhubei I, Jordan DM, Sunyaev SR. Predicting functional effect of human missense mutations using PolyPhen-2. Curr Protoc Hum Genet. 2013;Chapter 7(Unit 7):20. doi: 10.1002/0471142905.hg0720s76. [DOI] [PMC free article] [PubMed] [Google Scholar]
- Adzhubei IA, Schmidt S, Peshkin L, Ramensky VE, Gerasimova A, Bork P, Kondrashov AS, Sunyaev SR. A method and server for predicting damaging missense mutations. Nat Methods. 2010;7:248–249. doi: 10.1038/nmeth0410-248. [DOI] [PMC free article] [PubMed] [Google Scholar]
- Amendola LM, Jarvik GP, Leo MC, McLaughlin HM, Akkari Y, Amaral MD, Berg JS, Biswas S, Bowling KM, Conlin LK, et al. Performance of ACMG-AMP Variant-Interpretation Guidelines among Nine Laboratories in the Clinical Sequencing Exploratory Research Consortium. Am J Hum Genet. 2016;98:1067–1076. doi: 10.1016/j.ajhg.2016.03.024. [DOI] [PMC free article] [PubMed] [Google Scholar]
- Ballinger ML, Goode DL, Ray-Coquard I, James PA, Mitchell G, Niedermayr E, Puri A, Schiffman JD, Dite GS, Cipponi A, et al. Monogenic and polygenic determinants of sarcoma risk: an international genetic study. Lancet Oncol. 2016;17:1261–1271. doi: 10.1016/S1470-2045(16)30147-4. [DOI] [PubMed] [Google Scholar]
- Basu S, Pan W. Comparison of statistical tests for disease association with rare variants. Genet Epidemiol. 2011;35:606–619. doi: 10.1002/gepi.20609. [DOI] [PMC free article] [PubMed] [Google Scholar]
- Bodmer W, Tomlinson I. Rare genetic variants and the risk of cancer. Current Opinion in Genetics and Development. 2010:262–267. doi: 10.1016/j.gde.2010.04.016. [DOI] [PubMed] [Google Scholar]
- Bose R, Kavuri SM, Searleman AC, Shen W, Shen D, Koboldt DC, Monsey J, Goel N, Aronson AB, Li S, et al. Activating HER2 mutations in HER2 gene amplification negative breast cancer. Cancer Discovery. 2013;3:224–237. doi: 10.1158/2159-8290.CD-12-0349. [DOI] [PMC free article] [PubMed] [Google Scholar]
- Chatterjee R, Ramos E, Hoffman M, Vanwinkle J, Martin DR, Davis TK, Hoshi M, Hmiel SP, Beck A, Hruska K, et al. Traditional and targeted exome sequencing reveals common, rare and novel functional deleterious variants in RET-signaling complex in a cohort of living US patients with urinary tract malformations. Hum Genet. 2012 doi: 10.1007/s00439-012-1181-3. [DOI] [PMC free article] [PubMed] [Google Scholar]
- Chen K, Meric-Bernstam F, Zhao H, Zhang Q, Ezzeddine N, Tang LY, Qi Y, Mao Y, Chen T, Chong Z, et al. Clinical actionability enhanced through deep targeted sequencing of solid tumors. Clin Chem. 2015;61:544–553. doi: 10.1373/clinchem.2014.231100. [DOI] [PMC free article] [PubMed] [Google Scholar]
- Cheng DT, Prasad M, Chekaluk Y, Benayed R, Sadowska J, Zehir A, Syed A, Wang YE, Somar J, Li Y, et al. Comprehensive detection of germline variants by MSK-IMPACT, a clinical diagnostic platform for solid tumor molecular oncology and concurrent cancer predisposition testing. BMC Med Genomics. 2017;10:33. doi: 10.1186/s12920-017-0271-4. [DOI] [PMC free article] [PubMed] [Google Scholar]
- Consortium T.U. UniProt: the universal protein knowledgebase. Nucleic Acids Res. 2017;45:D158–D169. doi: 10.1093/nar/gkw1099. [DOI] [PMC free article] [PubMed] [Google Scholar]
- Dai W, Wang Q, Liu T, Swamy M, Fang Y, Xie S, Mahmood R, Yang YM, Xu M, Rao CV. Slippage of mitotic arrest and enhanced tumor development in mice with BubR1 haploinsufficiency. Cancer Res. 2004;64:440–445. doi: 10.1158/0008-5472.can-03-3119. [DOI] [PubMed] [Google Scholar]
- Fishbein L, Nathanson KL. Pheochromocytoma and paraganglioma: understanding the complexities of the genetic background. Cancer Genet. 2012;205:1–11. doi: 10.1016/j.cancergen.2012.01.009. [DOI] [PMC free article] [PubMed] [Google Scholar]
- Fromer M, Purcell SM. Using XHMM Software to Detect Copy Number Variation in Whole-Exome Sequencing Data. Curr Protoc Hum Genet. 2014;81(7):23 21–21. doi: 10.1002/0471142905.hg0723s81. [DOI] [PMC free article] [PubMed] [Google Scholar]
- Gabant G, Lorphelin A, Nozerand N, Marchetti C, Bellanger L, Dedieu A, Quemeneur E, Alpha-Bazin B. Autophosphorylated residues involved in the regulation of human chk2 in vitro. Journal of molecular biology. 2008;380:489–503. doi: 10.1016/j.jmb.2008.04.053. [DOI] [PubMed] [Google Scholar]
- Hilton JL, Geisler JP, Rathe JA, Hattermann-Zogg MA, DeYoung B, Buller RE. Inactivation of BRCA1 and BRCA2 in ovarian cancer. J Natl Cancer Inst. 2002;94:1396–1406. doi: 10.1093/jnci/94.18.1396. [DOI] [PubMed] [Google Scholar]
- Hornbeck PV, Zhang B, Murray B, Kornhauser JM, Latham V, Skrzypek E. PhosphoSitePlus, 2014: mutations, PTMs and recalibrations. Nucleic Acids Res. 2015;43:D512–520. doi: 10.1093/nar/gku1267. [DOI] [PMC free article] [PubMed] [Google Scholar]
- Jansson M, Durant ST, Cho EC, Sheahan S, Edelmann M, Kessler B, La Thangue NB. Arginine methylation regulates the p53 response. Nat Cell Biol. 2008;10:1431–1439. doi: 10.1038/ncb1802. [DOI] [PubMed] [Google Scholar]
- Jimenez C, Dang GT, Schultz PN, El-Naggar A, Shapiro S, Barnes EA, Evans DB, Vassilopoulou-Sellin R, Gagel RF, Cote GJ, et al. A novel point mutation of the RET protooncogene involving the second intracellular tyrosine kinase domain in a family with medullary thyroid carcinoma. J Clin Endocrinol Metab. 2004;89:3521–3526. doi: 10.1210/jc.2004-0073. [DOI] [PubMed] [Google Scholar]
- Kawamoto Y, Takeda K, Okuno Y, Yamakawa Y, Ito Y, Taguchi R, Kato M, Suzuki H, Takahashi M, Nakashima I. Identification of RET autophosphorylation sites by mass spectrometry. The Journal of biological chemistry. 2004;279:14213–14224. doi: 10.1074/jbc.M312600200. [DOI] [PubMed] [Google Scholar]
- Knudson AG. Mutation and cancer: statistical study of retinoblastoma. Proceedings of the National Academy of Sciences of the United States of America. 1971;68:820–823. doi: 10.1073/pnas.68.4.820. [DOI] [PMC free article] [PubMed] [Google Scholar]
- Knudson AG. Two genetic hits (more or less) to cancer. Nat Rev Cancer. 2001;1:157–162. doi: 10.1038/35101031. [DOI] [PubMed] [Google Scholar]
- Koboldt DC, Zhang Q, Larson DE, Shen D, McLellan MD, Lin L, Miller CA, Mardis ER, Ding L, Wilson RK. VarScan 2: Somatic mutation and copy number alteration discovery in cancer by exome sequencing. Genome Research. 2012;22:568–576. doi: 10.1101/gr.129684.111. [DOI] [PMC free article] [PubMed] [Google Scholar]
- Koire A, Katsonis P, Lichtarge O. Repurposing Germline Exomes of the Cancer Genome Atlas Demands a Cautious Approach and Sample-Specific Variant Filtering. Pac Symp Biocomput. 2016;21:207–218. [PMC free article] [PubMed] [Google Scholar]
- Krassowski M, Paczkowska M, Cullion K, Huang T, Dzneladze I, Ouellette BFF, Yamada JT, Fradet-Turcotte A, Reimand J. ActiveDriverDB: human disease mutations and genome variation in post-translational modification sites of proteins. Nucleic Acids Res. 2017 doi: 10.1093/nar/gkx973. [DOI] [PMC free article] [PubMed] [Google Scholar]
- Krassowski M, Paczkowska M, Cullion K, Huang T, Dzneladze I, Ouellette BFF, Yamada JT, Fradet-Turcotte A, Reimand J. ActiveDriverDB: human disease mutations and genome variation in post-translational modification sites of proteins. Nucleic Acids Res. 2018;46:D901–D910. doi: 10.1093/nar/gkx973. [DOI] [PMC free article] [PubMed] [Google Scholar]
- Kumar P, Henikoff S, Ng PC. Predicting the effects of coding non-synonymous variants on protein function using the SIFT algorithm. Nat Protoc. 2009;4:1073–1081. doi: 10.1038/nprot.2009.86. [DOI] [PubMed] [Google Scholar]
- Landrum MJ, Lee JM, Benson M, Brown G, Chao C, Chitipiralla S, Gu B, Hart J, Hoffman D, Hoover J, et al. ClinVar: public archive of interpretations of clinically relevant variants. Nucleic acids research. 2015;44:D862–868. doi: 10.1093/nar/gkv1222. [DOI] [PMC free article] [PubMed] [Google Scholar]
- Lek M, Karczewski KJ, Minikel EV, Samocha KE, Banks E, Fennell T, O'Donnell-Luria AH, Ware JS, Hill AJ, Cummings BB, et al. Analysis of protein-coding genetic variation in 60,706 humans. Nature. 2016;536:285–291. doi: 10.1038/nature19057. [DOI] [PMC free article] [PubMed] [Google Scholar]
- Lichtenstein P, Holm NV, Verkasalo PK, Iliadou A, Kaprio J, Koskenvuo M, Pukkala E, Skytthe A, Hemminki K. Environmental and heritable factors in the causation of cancer--analyses of cohorts of twins from Sweden, Denmark, and Finland. The New England journal of medicine. 2000;343:78–85. doi: 10.1056/NEJM200007133430201. [DOI] [PubMed] [Google Scholar]
- Lu C, Xie M, Wendl MC, Wang J, McLellan MD, Leiserson MD, Huang KL, Wyczalkowski MA, Jayasinghe R, Banerjee T, et al. Patterns and functional implications of rare germline variants across 12 cancer types. Nature communications. 2015a;6:10086. doi: 10.1038/ncomms10086. [DOI] [PMC free article] [PubMed] [Google Scholar]
- Lu C, Xie M, Wendl MC, Wang J, McLellan MD, Leiserson MDM, Huang KL, Wyczalkowski Ma, Jayasinghe R, Banerjee T, et al. Patterns and functional implications of rare germline variants across 12 cancer types. Nature communications. 2015b;6:10086. doi: 10.1038/ncomms10086. [DOI] [PMC free article] [PubMed] [Google Scholar]
- Mashl RJ, Scott AD, Huang KL, Wyczalkowski MA, Yoon CJ, Niu B, DeNardo E, Yellapantula VD, Handsaker RE, Chen K, et al. GenomeVIP: a cloud platform for genomic variant discovery and interpretation. Genome Res. 2017 doi: 10.1101/gr.211656.116. [DOI] [PMC free article] [PubMed] [Google Scholar]
- McKenna A, Hanna M, Banks E, Sivachenko A, Cibulskis K, Kernytsky A, Garimella K, Altshuler D, Gabriel S, Daly M, et al. The genome analysis toolkit: A MapReduce framework for analyzing next-generation DNA sequencing data. Genome Research. 2010;20:1297–1303. doi: 10.1101/gr.107524.110. [DOI] [PMC free article] [PubMed] [Google Scholar]
- McLaren W, Gil L, Hunt SE, Riat HS, Ritchie GR, Thormann A, Flicek P, Cunningham F. The Ensembl Variant Effect Predictor. Genome Biol. 2016;17:122. doi: 10.1186/s13059-016-0974-4. [DOI] [PMC free article] [PubMed] [Google Scholar]
- Morak M, Kasbauer S, Kerscher M, Laner A, Nissen AM, Benet-Pages A, Schackert HK, Keller G, Massdorf T, Holinski-Feder E. Loss of MSH2 and MSH6 due to heterozygous germline defects in MSH3 and MSH6. Fam Cancer. 2017 doi: 10.1007/s10689-017-9975-z. [DOI] [PubMed] [Google Scholar]
- Niu B, Scott AD, Sengupta S, Bailey MH, Batra P, Ning J, Wyczalkowski MA, Liang WW, Zhang Q, McLellan MD, et al. Protein-structure-guided discovery of functional mutations across 19 cancer types. Nat Genet. 2016;48:827–837. doi: 10.1038/ng.3586. [DOI] [PMC free article] [PubMed] [Google Scholar]
- Parsons DW, Roy A, Yang Y, Wang T, Scollon S, Bergstrom K, Kerstein RA, Gutierrez S, Petersen AK, Bavle A, et al. Diagnostic Yield of Clinical Tumor and Germline Whole-Exome Sequencing for Children With Solid Tumors. JAMA Oncol. 2016 doi: 10.1001/jamaoncol.2015.5699. [DOI] [PMC free article] [PubMed] [Google Scholar]
- Patil M, Pabla N, Huang S, Dong Z. Nek1 phosphorylates Von Hippel-Lindau tumor suppressor to promote its proteasomal degradation and ciliary destabilization. Cell Cycle. 2013;12:166–171. doi: 10.4161/cc.23053. [DOI] [PMC free article] [PubMed] [Google Scholar]
- Plaza-Menacho I, Barnouin K, Barry R, Borg A, Orme M, Chauhan R, Mouilleron S, Martinez-Torres RJ, Meier P, McDonald NQ. RET Functions as a Dual-Specificity Kinase that Requires Allosteric Inputs from Juxtamembrane Elements. Cell Rep. 2016;17:3319–3332. doi: 10.1016/j.celrep.2016.11.061. [DOI] [PMC free article] [PubMed] [Google Scholar]
- Rahman N. Realizing the promise of cancer predisposition genes. Nature. 2014;505:302–308. doi: 10.1038/nature12981. [DOI] [PMC free article] [PubMed] [Google Scholar]
- Reimand J, Wagih O, Bader GD. The mutational landscape of phosphorylation signaling in cancer. Sci Rep. 2013;3:2651. doi: 10.1038/srep02651. [DOI] [PMC free article] [PubMed] [Google Scholar]
- Reimand J, Wagih O, Bader GD. Evolutionary constraint and disease associations of post-translational modification sites in human genomes. PLoS Genet. 2015;11:e1004919. doi: 10.1371/journal.pgen.1004919. [DOI] [PMC free article] [PubMed] [Google Scholar]
- Richards S, Aziz N, Bale S, Bick D, Das S, Gastier-Foster J, Grody WW, Hegde M, Lyon E, Spector E, et al. Standards and guidelines for the interpretation of sequence variants: a joint consensus recommendation of the American College of Medical Genetics and Genomics and the Association for Molecular Pathology. Genetics in Medicine. 2015;17:405–424. doi: 10.1038/gim.2015.30. [DOI] [PMC free article] [PubMed] [Google Scholar]
- Robinson JT, Thorvaldsdottir H, Winckler W, Guttman M, Lander ES, Getz G, Mesirov JP. Integrative genomics viewer. Nat Biotechnol. 2011;29:24–26. doi: 10.1038/nbt.1754. [DOI] [PMC free article] [PubMed] [Google Scholar]
- Ruderfer DM, Hamamsy T, Lek M, Karczewski KJ, Kavanagh D, Samocha KE, Exome Aggregation C. Daly MJ, MacArthur DG, Fromer M, et al. Patterns of genic intolerance of rare copy number variation in 59,898 human exomes. Nat Genet. 2016;48:1107–1111. doi: 10.1038/ng.3638. [DOI] [PMC free article] [PubMed] [Google Scholar]
- Sahasrabudhe R, Lott P, Bohorquez M, Toal T, Estrada AP, Suarez JJ, Brea-Fernandez A, Cameselle-Teijeiro J, Pinto C, Ramos I, et al. Germline Mutations in PALB2, BRCA1, and RAD51C, Which Regulate DNA Recombination Repair, in Patients With Gastric Cancer. Gastroenterology. 2017;152:983–986 e986. doi: 10.1053/j.gastro.2016.12.010. [DOI] [PMC free article] [PubMed] [Google Scholar]
- Schmidt L, Junker K, Weirich G, Glenn G, Choyke P, Lubensky I, Zhuang Z, Jeffers M, Vande Woude G, Neumann H, et al. Two North American families with hereditary papillary renal carcinoma and identical novel mutations in the MET proto-oncogene. Cancer Research. 1998;58:1719–1722. [PubMed] [Google Scholar]
- Solomon S, Das S, Brand R, Whitcomb DC. Inherited pancreatic cancer syndromes. Cancer J. 2012;18:485–491. doi: 10.1097/PPO.0b013e318278c4a6. [DOI] [PMC free article] [PubMed] [Google Scholar]
- Southey MC, Goldgar DE, Winqvist R, Pylkas K, Couch F, Tischkowitz M, Foulkes WD, Dennis J, Michailidou K, van Rensburg EJ, et al. PALB2 CHEK2 and ATM rare variants and cancer risk: data from COGS. J Med Genet. 2016 doi: 10.1136/jmedgenet-2016-103839. [DOI] [PMC free article] [PubMed] [Google Scholar]
- Tibbetts RS, Cortez D, Brumbaugh KM, Scully R, Livingston D, Elledge SJ, Abraham RT. Functional interactions between BRCA1 and the checkpoint kinase ATR during genotoxic stress. Genes & development. 2000;14:2989–3002. doi: 10.1101/gad.851000. [DOI] [PMC free article] [PubMed] [Google Scholar]
- Vogelstein B, Papadopoulos N, Velculescu VE, Zhou S, Diaz La, Kinzler KW. Cancer genome landscapes. Science (New York, NY) 2013;339:1546–1558. doi: 10.1126/science.1235122. [DOI] [PMC free article] [PubMed] [Google Scholar]
- Wagih O, Reimand J, Bader GD. MIMP: predicting the impact of mutations on kinase-substrate phosphorylation. Nat Methods. 2015;12:531–533. doi: 10.1038/nmeth.3396. [DOI] [PubMed] [Google Scholar]
- Ye K, Schulz MH, Long Q, Apweiler R, Ning Z. Pindel: A pattern growth approach to detect break points of large deletions and medium sized insertions from paired-end short reads. Bioinformatics. 2009;25:2865–2871. doi: 10.1093/bioinformatics/btp394. [DOI] [PMC free article] [PubMed] [Google Scholar]
- Ye K, Wang J, Jayasinghe R, Lameijer EW, McMichael JF, Ning J, McLellan MD, Xie M, Cao S, Yellapantula V, et al. Systematic discovery of complex insertions and deletions in human cancers. Nature medicine. 2015:1–10. doi: 10.1038/nm.4002. advance on. [DOI] [PMC free article] [PubMed] [Google Scholar]
- Zhang J, Walsh MF, Wu G, Edmonson MN, Gruber TA, Easton J, Hedges D, Ma X, Zhou X, Yergeau DA, et al. Germline mutations in predisposition genes in pediatric cancer. New England Journal of Medicine. 2015;373:2336–2346. doi: 10.1056/NEJMoa1508054. [DOI] [PMC free article] [PubMed] [Google Scholar]
- Zhou W, Chen T, Chong Z, Rohrdanz MA, Melott JM, Wakefield C, Zeng J, Weinstein JN, Meric-Bernstam F, Mills GB, et al. TransVar: a multilevel variant annotator for precision genomics. Nat Methods. 2015;12:1002–1003. doi: 10.1038/nmeth.3622. [DOI] [PMC free article] [PubMed] [Google Scholar]
Associated Data
This section collects any data citations, data availability statements, or supplementary materials included in this article.
Supplementary Materials
Figure S1. Quality control of samples and germline variants. Related to Figure 1. (A) Coverage distribution for each of the samples used for variant calling. (B) Average coverages of 152 predisposition genes known to harbor rare, pathogenic variants. 10,389 samples were retained after all quality control procedure. (C) Concordance of variant calls with genotype data. Samples with less than 60% concordance were eliminated in the final set of 10,389 samples. (D) Estimated false positive rate of variant calls in each cancer types evaluated through negative selection against impactful mutations. Adjacent normals (instead of blood normals) were predominant for the KIRC and LAML project, presenting special challenges for variant calling; downstream filtering processes ensured the quality of pathogenic variants found in these samples. (E) Number of exonic variants identified in each of the normal sample the across 33 cancer types. Each dot indicates an individual colored by their ancestry as determined by PanCanAtlas AIM working group. Samples with lower than 15,000 exonic variants were filtered out.
Figure S2. Variant classification workflow. Related to Figure 1. (A) The process of going from more than 285 million germline variants in exons to the final set of 1,393 pathogenic/likely pathogenic variants and prioritized VUSs using CharGer. (B) Number of pathogenic and likely pathogenic variants identified in each of the 152 cancer predisposition genes curated using different sources. Each dot represents a gene and the labeled ones are the newly added genes (beyond the 114 from Rahman et al.) having more than 10 variants. (C) Pathogenic or likely pathogenic variants identified in this study compared to the previously reported variants from our 2015 pan-cancer germline study (Lu et al., 2015b). (D) Prioritized VUSs nominated through multiple lines of evidences including case-control frequency, loss of heterozygosity, expression association, and co-localization with recurrent mutations and PTM residues.
Figure S3. Further investigation of two-hit events. Related to Figure 3. (A) Rates of LOH associated with BRCA1/2 germline variants in BRCA, OV and other cancer types. (B) IGV screen shots showing a biallelic event in mutually exclusive sequencing reads in a COAD case carrying a paired MSH p.R248fs germline variant/p.R248* somatic mutation.
Figure S4. Number of truncations associated with bottom 25% gene expression in the carrier across different predisposition genes. Observing truncating variants does not guarantee low gene expression in the carrier. Related to Figure 4.
Figure S5. Germline copy number deletions identified using both whole exome sequencing and SNP-array data. Related to Figure 5. (A) A BRCA1 deletion identified in an OV sample and an NF1 deletions identified in an PCPG sample using both datatypes. (B) Deletions identified in associated cancer-gene pairs showed reduced gene expression in the carrier sample whereas an average deletion in 152 predisposition gene does not show such association.
Figure S6. Cancer-associated germline variants in PTM sites implicate potential mechanistic hypotheses. Related to Figure 6. (A) More than 45% of protein amino acid substitutions in our dataset affect post-translational modification (PTM) sites, significantly more than expected from chance alone. Direct substitutions replace post-translationally modified amino acids with non-modified acids (dark red), and proximal and distal substitutions lie within 1-2 and 3-7 amino acids from closest PTM site (orange and yellow, respectively). (B) The majority of PTM-associated substitutions affect phosphorylation, the largest PTM dataset in our study. Substitutions that affect sites with multiple different types of PTM are also apparent. (C) Genes with germline substitutions in PTM sites include known cancer genes like TP53, BRCA1, RET, VHL, PTEN, and others. Colors represent the impact of variants on PTM sites. (D) Analysis of extended germline variant data from TCGA shows that TP53 carries six germline substitutions in three protein methylation sites that are known to regulate its DNA damage response through altered target gene specificity. (E) MET and ATM substitutions are predicted to induce motif rewiring events that lead to the loss of an existing AKT1 binding site and the introduction of a new binding site for AURKA, respectively. (F) Site-specific interaction network of predicted enzyme-substrate interactions as predicted by the MIMP algorithm.
Figure S7. Variants in familial cases and power to identify predisposition genes in case-control cohorts. Related to Figure 2. (A) Pathogenic variants identified in the 552 cancer cases with known familial history of cancer. Each color indicates the type of familial history recorded in the TCGA clinical data. (B) Power analysis of burden analysis to identify predisposition genes in cohort sizes ranging from 100 to 300k.
Table S1. Evidence and reference used for automated classification of germline variants using CharGer. Related to Figure 1. (A) List of 152 cancer predisposition genes. (B) Depth-of-coverage for 152 gene regions of each sample. (C) Evidence level used in CharGer classification.
Table S2. Predisposition variants. Related to Figure 2. (A) Pathogenic or likely pathogenic germline variants. (B) Prioritized variants of unknown significance (VUSs). (C) Variants of pleiotropic genes and their relation to cancer. (D) Prioritized VUSs nominated by more than one line of evidences.
Table S3. Carrier frequency and enrichment of pathogenic or likely pathogenic variants in 33 cancer types. Related to Figure 2. (A) Frequency of pathogenic and likely pathogenic variants in each of the 33 cancer types. (B) Genes associated with higher enrichment of variants across cancer types. (C) In each cancer, previous TCGA investigation of germline variants and associations reported by other studies and potential novel associations.
Table S4. Two-hit events associated with germline variants. Related to Figure 3. (A) Counts of allele-specific LOHs observed for each gene category. (B) Bi-allelic events coupled with pathogenic or likely pathogenic variants.
Table S5. Expression of gene and gene products in variant carriers of each cancer type. Related to Figure 4. (A) Genes associated with altered expressions in variant carriers using RNA-Seq data. (B) Proteins/phosphoproteins associated with altered expressions in variant carriers using RPPA data.
Table S6. Variants with additional lines of functional evidence. Related to Figure 6 and Figure 7. (A) Variants associated with enrichment in cancer vs. controls. (B) Variants co-localized with pathogenic variants in pediatric cancer or recurrent somatic mutations. (C)Variants validated in additional cancer cases of the MDACC cohort. (D) Variants overlapping or adjacent to PTM sites. (E) Co-clustering germline variants and somatic mutations. (F) Result of functional validation of the RET germline alleles.
Table S7. Genes associated with younger age at onset in variant carriers in each cancer type. Related to Figure 2.
Data Availability Statement
Researchers who are authorized can apply for access to the data through the germline project hosted on the ISB cancer genome cloud (ISB-CGC). Detailed procedure can be found on the ISB-CGC website: http://isb-cancer-genomics-cloud.readthedocs.io/en/latest/sections/webapp/Gaining-Access-To-Contolled-Access-Data.html. Resource for familiarizing with related cloud computational tools are documented in the github page: https://github.com/ding-lab/PanCanAtlasGermline. Intermediate files used in this study are listed here: https://docs.google.com/document/d/1ymdfAnRR4o4-20bwHI3vPaRPRuoqtqc0pNUVYO2oiPc/edit?usp=sharing. All final results published in this study used the germline variant call data from release1.1. All de-identified pathogenic or likely pathogenic variants and prioritized VUSs used in this study, along with their attributes, can be found in Table S2.