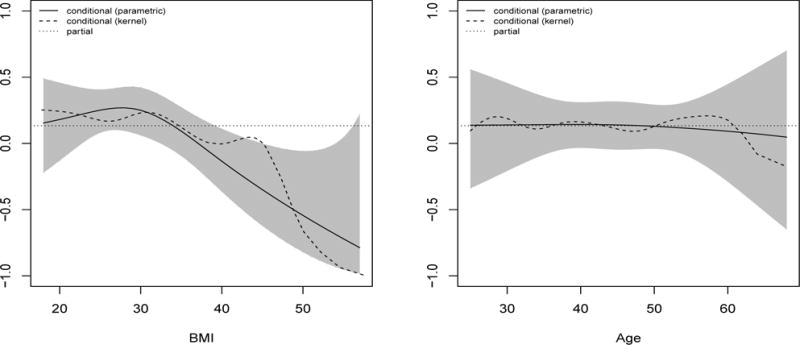
Figure 3.

Partial Spearman’s rank correlations between leptin and sCD14 conditional on BMI (left panel) and age (right panel). The solid curve (and shaded region) represent estimates (and pointwise 95% confidence intervals) using a parametric estimation procedure. Specifically, the parametric estimate fit separate ordinary least squares models to the product of the residuals and the square of each set of residuals, including BMI in the models using natural splines with 2 degrees of freedom. The dashed curve represents estimates using a Gaussian kernel smoother, using Silverman’s rule of thumb to select the bandwidth (h = 2.7).
