Abstract
Statistical parametric maps formed via voxel-wise mass-univariate tests, such as the general linear model, are commonly used to test hypotheses about regionally specific effects in neuroimaging cross-sectional studies where each subject is represented by a single image. Despite being informative, these techniques remain limited as they ignore multivariate relationships in the data. Most importantly, the commonly employed local Gaussian smoothing, which is important for accounting for registration errors and making the data follow Gaussian distributions, is usually chosen in an ad hoc fashion. Thus, it is often suboptimal for the task of detecting group differences and correlations with non-imaging variables. Information mapping techniques, such as searchlight, which use pattern classifiers to exploit multivariate information and obtain more powerful statistical maps, have become increasingly popular in recent years. However, existing methods may lead to important interpretation errors in practice (i.e., misidentifying a cluster as informative, or failing to detect truly informative voxels), while often being computationally expensive. To address these issues, we introduce a novel efficient multivariate statistical framework for cross-sectional studies, termed MIDAS, seeking highly sensitive and specific voxel-wise brain maps, while leveraging the power of regional discriminant analysis. In MIDAS, locally linear discriminative learning is applied to estimate the pattern that best discriminates between two groups, or predicts a variable of interest. This pattern is equivalent to local filtering by an optimal kernel whose coefficients are the weights of the linear discriminant. By composing information from all neighborhoods that contain a given voxel, MIDAS produces a statistic that collectively reflects the contribution of the voxel to the regional classifiers as well as the discriminative power of the classifiers. Critically, MIDAS efficiently assesses the statistical significance of the derived statistic by analytically approximating its null distribution without the need for computationally expensive permutation tests. The proposed framework was extensively validated using simulated atrophy in structural magnetic resonance imaging (MRI) and further tested using data from a task-based functional MRI study as well as a structural MRI study of cognitive performance. The performance of the proposed framework was evaluated against standard voxel-wise general linear models and other information mapping methods. The experimental results showed that MIDAS achieves relatively higher sensitivity and specificity in detecting group differences. Together, our results demonstrate the potential of the proposed approach to efficiently map effects of interest in both structural and functional data.
Keywords: Statistical mapping, Permutation testing, Brain mapping, Multivariate statistics
Introduction
Voxel-wise statistical mapping is a widely used technique in neuroimaging within cross-sectional studies. Its overarching goal is to generate maps that represent structural or functional patterns associated with either group differences or with non-imaging variables. This is typically performed by spatially aligning imaging measurements from a set of images, smoothing them using a fixed-size Gaussian kernel, and comparing them using mass-univariate voxel-wise statistical tests. Depending on the type of imaging features, these techniques may fall under the category of voxel-based morphometry (VBM) (Wright et al., 1995; Goldszal et al., 1998; Ashburner and Friston, 2000; Davatzikos et al., 2001; Job et al., 2002, 2005; Kubicki et al., 2002; Shen and Davatzikos, 2003; Bernasconi et al., 2004; Giuliani et al., 2005; Casanova et al., 2007; Meda et al., 2008), deformation-based morphometry (DBM) (Ashburner et al., 1998; Chung et al., 2001, 2003), or tensor-based morphometry (TBM) (Thompson et al., 2000; Fox et al., 2001; Studholme et al., 2004; Lepore et al., 2006; Chiang et al., 2007; Hua et al., 2008). These methods do not require a priori definition of regions of interest and have the advantage of examining the brain as a whole. As a consequence, they offer an automated, data-driven, and unbiased way to assess brain structure and function comprehensively.
One major limitation of mass-univariate techniques is that they ignore multivariate relations in the data. Additionally, the commonly applied local smoothing may obscure the effects of interest. Smoothing the data is necessary to ensure that the assumptions underlying the theory of Gaussian random fields are met, and to account for registration errors. Perhaps most importantly, smoothing is used to amplify the signal and reduce the noise before performing statistical analyses and can lead to a dramatic increase in sensitivity to detecting effects of interest. However, smoothing is typically not adapted to the scale and shape of the signal of interest (e.g., activation, atrophy, neuropathology), which is necessary to achieve high sensitivity and specificity in group comparisons or regressions with non-imaging variables. If the smoothing kernel is too small, noise and limited pooling of regional signal can seriously reduce the statistical power of the ensuing statistical maps. Conversely, if the kernel is too large, the spatial specificity of the maps is reduced, leading to false conclusions about the origin of the effect of interest. Additionally, a kernel that is too large may also decrease the statistical power for detecting effects of interest by smearing them out through the introduction of information from regions that display no effect of interest. As a consequence, selecting the appropriate kernel size is a challenging task (Jones et al., 2005; Zhang et al., 2008). In practice, this is performed in an empirical, or ad hoc fashion.
Towards addressing these limitations, information-based brain mapping techniques have become increasingly popular in recent years. These techniques use pattern classifiers to harness the rich multivariate information present in the interactions across many voxels to obtain more powerful statistical maps. These approaches were popularized by the introduction of the searchlight methods (Kriegeskorte et al., 2006; Pereira and Botvinick, 2011; Allefeld and Haynes, 2014). Searchlight commonly applies local discriminative classifiers and creates an information map by assigning each searchlight’s classification accuracy to its center voxel. In some variants of searchlight, Monte-Carlo sampling and combining information across overlapping neighborhoods is used to increase stability (Björnsdotter et al., 2011). Despite its appealing multivariate nature, this strategy does not appropriately encode the importance of each voxel as it effectively ignores its contribution to the discriminative pattern. This may lead to important interpretation errors in practice. Etzel et al. (2013) demonstrated that searchlight methods might fail to detect informative voxels, or could misclassify voxels as informative, unless the searchlight region sufficiently covers, or matches the underlying pattern. Specifically, it is possible for voxels in the searchlight map to be categorized as significant, not because they are informative, but because they are at the center of a searchlight that contains the informative voxels. It is also possible to detect weakly-informative voxels when they are sufficiently numerous.
Towards addressing this limitation, a more refined way to characterize each voxel’s importance was proposed by Zhang and Davatzikos (2011, 2013) in their framework for optimally-discriminative voxel-based analysis (ODVBA). In ODVBA, non-negative discriminative projection was employed regionally to estimate the direction that best discriminates between two groups. Given this direction, the statistic of each voxel was assessed by taking into account the discrimination power of the voxel in terms of the pattern seen in its neighborhood. However, ODVBA was limited only in group-comparison settings, not being able to address regression tasks. More importantly, to obtain a statistical parametric map of group differences, ODVBA requires computationally expensive permutations tests.
To tackle these shortcomings, we propose a novel statistical method for cross-sectional studies, termed MIDAS, which originates from regionally linear multivariate discriminative statistical mapping. Our goal is to efficiently obtain highly specific and sensitive brain maps with applications in structural and functional imaging. MIDAS seeks to increase statistical power by combining the signal from all voxels that constitute the effect of interest. Towards this end, it aims to locally determine the shape and spatial extent of the effect/signal of interest by fitting least squares support vector machines (SVM) to a large number of overlapping neighborhoods, which fully and redundantly cover the brain. In this way, the effect of interest is estimated as the pattern that best discriminates between two groups, or predicts the variable of interest in regression designs. This pattern is equivalent to local filtering by an optimal kernel whose coefficients define the optimally discriminative/predictive pattern. By combining information from all neighborhoods that contain a given voxel, we produce voxel-wise statistics. These statistics are calculated by summing the contributions of each voxel to the estimated local hyperplanes and normalizing them by the sum of the respective SVM margins. In other words, informative voxels are defined as ones that contribute significantly to the discriminative direction of SVMs, which in turn, discriminate between two groups, or predict a variable of interest with a margin as large as possible. Critically, motivated by recent advances in deriving statistical significance maps for SVM classification (Gaonkar and Davatzikos, 2013; Gaonkar et al., 2015), we derive an analytical approximation of the null distribution of the estimated statistics. This allows us to effectively estimate voxel-wise p-value maps at a dramatic speed-up compared to permutation tests.
We validated the proposed framework against mass univariate techniques, as well as multivariate pattern analysis methods including searchlight, ODVBA, and SVM-based statistical significance maps. We created simulated data by introducing synthetic atrophy to structural brain scans of healthy subjects to quantitatively evaluate the performance of the method. Quantitative evaluations were performed by assessing the sensitivity and specificity of the statistical significance maps in relation to the ground-truth regions. Moreover, we used data from a task-based functional magnetic resonance imaging study to test MIDAS. This dataset consisted of brain activation maps of subjects who took part in a forced choice deception experiment, where the groups were defined by truth-telling versus lying tasks (Davatzikos et al., 2005; Langleben et al., 2005). Due to the absence of ground-truth, the methods were quantitatively analyzed by measuring split sample reproducibility. Our experimental results indicate that the proposed method outperforms the commonly used univariate and multivariate algorithms in terms of sensitivity and specificity, as well as reproducibility. Lastly, the ability of MIDAS to handle regression settings was demonstrated using a structural magnetic resonance imaging study of cognitive performance of mild cognitive impairment subjects (Mohs, 1983; van de Pol et al., 2007). In this setting, MIDAS was also able to yield highly sensitive maps compared to other state of the art methods.
The remainder of this paper is organized as follows. In Section 2, we detail the proposed approach. In Section 3, we first experimentally validate MIDAS using simulated data and then apply MIDAS to data from functional and structural neuroimaging studies. We discuss the results in Section 4, while Section 6 concludes the paper with our final remarks.
Method
Overview
Multivariate inference using discriminative adaptive smoothing (MIDAS) is a group analysis and regression framework that integrates a large number of regional discriminant, or regression, pattern analyses to obtain a voxel-wise statistical map analogous to those obtained via the general linear model (see Fig. 1). MIDAS scans the imaging volume using a sufficiently large set of overlapping neighborhoods (Fig. 1 I), and performs regional discriminative analysis that yields weight vectors (denoted by w) (Fig. 1 II). The statistic for a particular voxel is computed by summing the weights corresponding to the voxel in all of the neighborhoods it resides in, and normalizing by the sum of the discriminative power of the respective neighborhoods (Fig. 1 III). Finally, the p-value corresponding to the voxel statistic is analytically obtained by approximating permutation tests (Fig. 1 IV).
Fig. 1.

Overview of MIDAS: I) Neighborhoods are uniformly sampled such that the brain volume is sufficiently covered; II) Local discriminative analysis is performed on neighborhoods yielding weight vectors w; III) A voxel-wise statistic is computed using the weight vectors; and IV) statistical significance is assessed through analytically approximating the null distribution of the voxel-wise statistic.
Least squares support vector machine
MIDAS is based on the least squares support vector machine (LS-SVM) (Suykens and Vandewalle, 1999) to perform local discriminative analysis. LS-SVM is an ideal base learning method for the MIDAS framework as it can readily handle both classification and regression problems while admitting a closed form solution. Let X ∈ Rn×d denote the matrix that contains d-dimensional imaging features from n independent subjects arranged row-wise. Likewise, let y ∈ Rn denote the vector that stores the clinical variables of the corresponding n subjects. LS-SVM aims to relate the imaging features X with clinical variables y via a weight vector w and a bias term b by optimizing the following objective:
Subject to
| (1) |
This formulation describes a generalized fitting setting where the predictors captured in X can be used to predict the responses y. The responses y can be either binary, yielding a group difference setting or continuous, yielding a regression setting. Here, w is a d-dimensional vector that contains the weights given to each of the d features for the fitting task, while ε is an n-dimensional vector providing slack for errors. Furthermore, c is a hyper-parameter than controls the closeness of fit. The weight vector w can be solved in closed form by satisfying the Karesh-Kunh-Tucker (KKT) conditions, leading to a solution of the form:
| (2) |
where the solution for the C matrix is given in Appendix A. Note that this is a linear solution in the y vector. Being able to express the solution vector in a closed linear form is important because it allows us to also express the null distribution of w analytically and without the need for costly random permutations of the clinical variables y.
Interpretability of weights through activations
Haufe et al. (2014) have cautioned against directly using discriminative model weights for interpretation in neuroimaging. This is because underlying noise patterns may skew the discriminative directions away from the true effect. Importantly, Haufe et al. (2014) showed that it is possible to proportionally recover the interpretable underlying effect, also known as the activation, a, by rotating the estimated linear discriminative model w (i.e., Xw = y). This is achieved by left multiplying it with the covariance matrix of the data:
| (3) |
The covariance matrix can be estimated either empirically, or by using shrinkage estimators (Ledoit and Wolf, 2003).
In the case of LS-SVM, the multivariate discriminative pattern is estimated as w = Cy. Therefore, one can obtain the activation a through the following rotation:
| (4) |
One of the important advantages of activations a over discriminative weights w is that activations allow the capture of multiple informative correlated features whereas the discriminative weights w may only act on a subset of these features. Note that utilizing activations over weights does not completely circumvent the issues of multicollinearity in features (Mumford et al., 2015). However, covariance matrix multiplication does redistribute the signal captured in weights to correlated features. Furthermore, the sign of activations a are in parity with their correlation with the responses y. This allows the summation of corresponding activations across multiple learners without cancellation, an issue that is present with summing discriminative weights.
Hereafter, the activation a and its corresponding parametric matrix M (M = Cov(X)C) along with the weight vector w and its corresponding parametric matrix C will be used to construct the MIDAS statistic.
MIDAS statistic
For all voxels in one volume, we estimate multiple multivariate discriminative patterns wp and their corresponding activations ap by applying the LS-SVM to the different neighborhoods (indexed by p) that contain it. Thus, for the ith voxel, we obtain a set of values and corresponding to the coefficient values of the weight vectors and the activations at the respective location, as well as a set of squared decision margins . Our goal is to summarize these values by a single measure that represents the effect of interest (e.g., group difference) at that spatial location, which will be used for statistical analysis.
We expect voxels that reflect effects of interest to have high absolute values of activations with the sign of the activation in correspondence with the direction of effect. The contribution of the ith voxel to the local activation at the pth neighborhood is given by . Taking into account that a voxel belongs to multiple neighborhoods, its total activation contribution is given by the sum of the respective activations across these neighborhoods:
| (5) |
The above quantity should be high when a voxel is well localized in an area of significant effects of interest (e.g., group difference), as it would contribute significantly to the activation patterns of multiple neighborhoods that contain it.
From a multivariate discriminatve sense, we expect voxels to take low weight coefficient values in uninformative neighborhoods. However, it is possible that some voxels take high absolute weight coefficient values due to overfitting. In such cases though, the decision margin of the neighborhood will be small, suggesting poor predictive power. As a consequence, the predictive power of the learner provides us with a measure of reliability. If we denote the half squared margin for the LS-SVM applied to the pth neighborhood by then the sum of the inverse predictive power of all learners, in which voxel i participates, is given by:
| (6) |
In designing the MIDAS statistic, we opt to emphasize contributions of voxels that are part of highly reliable machine learners, while limiting the importance of the ones that participate in regional learners of poor predictive power. Thus, we compute the per voxel statistic by modulating the total contribution of each voxel to the estimated local activation patterns with the total predictive power of the respective machine learners:
| (7) |
The above normalization enables higher scrutiny for voxels in nondiscriminative neighborhoods, while further increasing the statistic of voxels in highly discriminative neighborhoods.
Statistical significance
Permutation tests, or exact tests, are a well known framework for hypothesis testing when the underlying distribution of the statistic of interest is either hard to compute, or unknown (Nichols and Holmes, 2002). Permutation testing has been previously explored to assess the statistical significance of SVM weight vectors (Gaonkar and Davatzikos, 2013; Gaonkar et al., 2015). Specifically, voxel-wise p-values can be obtained by comparing the estimated solution to a null distribution constructed by solving the LS-SVM problem using instances of target clinical variables y shuffled by random permutations. Such permutation procedures are computationally intensive. However, a statistic of the form can be analytically approximated by a normal distribution, resulting in efficient inference strategies (Gaonkar et al., 2015). Using analogous analysis, one can show (see Appendix B) that the MIDAS statistic (Eq. (7)) is a sub-gaussian random variable whose tails can be approximated by a Gaussian distribution:
| (8) |
Parameters selection and implementation
There are two main parameters in MIDAS. The first parameter is the neighborhood radius, r, which controls the size of the local discriminative analysis window. The second parameter is the weight c in the LS-SVM objective (Eq. (2.2)). This parameter controls for the amount of slackness in the constraints of the LS-SVM objective, allowing for cases when the data points X are not linearly separable with respect to the labels y. In other words, c controls the degree to which w fits the data. One particular way to select the c and r parameters is by using the resulting significance maps for feature selection and assessing out of sample predictive performance through nested cross-validation (Olivetti et al., 2010).
One can also set the number of neighborhoods P, which are sampled such that the full brain volume is covered. The MIDAS statistic (Eq. (7)) is self-normalized to have zero mean and unit variance independent of the selection of P. In our experiments, P is selected such that each voxel across the brain is covered at least 20 times for a given neighborhood radius. A practical suggestion for setting P is to assess the reproducibility of the resulting statistical maps over a range of candidate of a number of neighborhoods and choose the minimum value that attains stability.
Note that the topology of the regional neighborhoods need not be spherical nor compact for the resulting statistic to be valid. Thus, neighborhoods that are discontinuous or anisotropic may be deployed in implementation. However, for simplicity, spherical neighborhoods were used in the implementation described within.
Lastly, to ensure that the coverage of the brain is relatively uniform, the MIDAS implementation accounts for the number of times each voxel has been covered to adaptively cover undersampled regions at each iteration.
Experimental validation
Evaluated methods
Towards evaluating the proposed method, we qualitatively and quantitatively compare MIDAS against commonly used brain mapping methods using both simulated and real neuroimaging data.
Voxel-based morphometry (VBM)
(Goldszal et al., 1998; Ashburner and Friston, 2000, 2001; Davatzikos et al., 2001). This has been one of the most widely used and established methods for voxel-based analysis in neuroimaging studies. The method entails segmentation of gray matter (GM) tissue and spatial normalization to a common template. Local intensities of GM maps are modulated by scaling with the amount of contraction. Differences are then detected by comparing modulated GM maps after Gaussian smoothing. Comparisons are performed by applying Student’s t-test in a mass-univariate fashion.
Permutation-based voxel-based morphometry (P-VBM)
(Nichols and Holmes, 2002; Winkler et al., 2014). This is a non-parametric analogue of the VBM method, where the voxel-wise significance is assessed by comparing the test statistic against a null distribution formed by permuting the clinical variables. We performed 2000 permutations in our experiments.
Optimally-discriminative voxel-based analysis (ODVBA)
(Zhang and Davatzikos, 2011, 2013). ODVBA is a technique that aims to determine the optimal spatially adaptive smoothing of images. It uses local non-negative discriminative projection (NDP) to estimate the direction that best discriminates between two groups. The local NDP vectors are then used to derive voxel-wise statistics, whose significance is assessed through permutation tests. The lack of a closed form solution to the NDP problem results in a significant computational burden.
Searchlight
(Kriegeskorte et al., 2006; Pereira and Botvinick, 2011). Searchlight aims to pull signal from all voxels in a spatial region through multivariate analysis. Specifically, a local classifier is applied to the neighborhood surrounding each voxel in a k-fold cross-validation (CV) setting. In the following experiments, linear SVM is used as the base learner for searchlight analysis. Each voxel is characterized by the cross-validated classification accuracy. Statistical significance is assessed by permuting the group memberships and recalculating the k-fold CV accuracy for the null distribution.
SVM-based statistical significance testing (P-SVM)
(Cuingnet et al., 2011; Gaonkar and Davatzikos, 2013; Gaonkar et al., 2015). SVM classification is performed to estimate the optimal hyperplane that separates two classes using all voxels as features and the group memberships as labels. The importance of the hyperplane coefficients is assessed through an analytic approximation of permutation testing. This method is very similar to MIDAS in its use of SVM weight vectors to assign significance to voxel-wise differences. However, the key difference is that MIDAS attempts to find regionally optimal filters, while P-SVM takes into account the whole volume. Furthermore, P-SVM utilizes a hard margin variant of LS-SVM, which may lead to overfitting and false positive regions in high-dimensional settings.
Experiments using simulated data
We first validated the proposed method using synthetic data. Specifically, we used a structural magnetic resonance imaging (sMRI) data set consisting of 1.5 T T1-weighted MRI volumetric scans of 200 healthy control subjects. MRI scans were first pre-processed using previously validated and published techniques (Goldszal et al., 1998). The pre-processing pipeline includes: (1) skull-stripping (Doshi et al., 2013); (1) N3 bias correction (Sled et al., 1998); (1) tissue segmentation into gray matter (GM), white matter, cerebrospinal fluid, and ventricles (Li et al., 2014); (1) deformable mapping (Ou et al., 2011) to a standardized template space (Kabani et al., 1998); (1) calculation of regional volumetric maps called RAVENS maps (Davatzikos et al., 2001); (1) normalization of the resulting maps by the individual intracranial volume; and (1) resampling to 2 mm3. After pre-processing, the samples were split into equally sized groups, and group differences were induced by simulating atrophy within a predefined regional mask (Fig. 2). Atrophy was introduced as a multiplicative reduction to the existing tissue volume to preserve the underlying covariance structure of the brain anatomy.
Fig. 2.
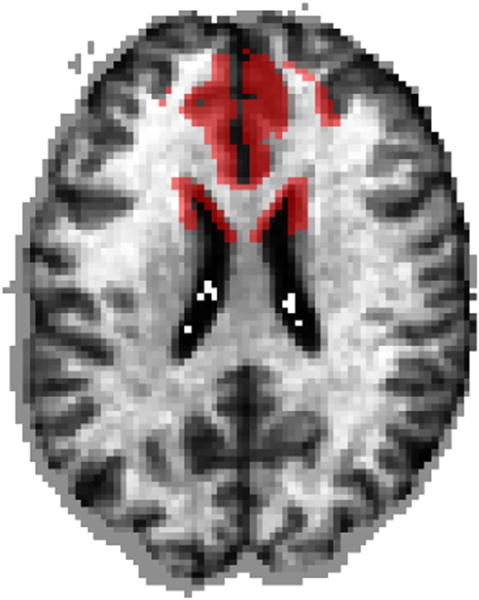
The frontal lobe regions that were subjected to simulated atrophy in the validation experiments is denoted by the red mask.
This synthetic setting allows for quantitative evaluation of the sensitivity and specificity of the proposed method in detecting the introduced atrophy. Moreover, it allows for quantitative comparisons against the methods above. In evaluating all methods, we simulated several scenarios that are commonly encountered in neuroimaging studies. First, we examined the robustness of the methods in detecting a fixed level of simulated atrophy under varying parameter settings. Next, we assessed the sensitivity of the methods by analyzing their ability to detect decreasing levels of simulated atrophy at a fixed parameter setting. Similarly, we tested the effectiveness of the methods in detecting differently shaped and sized atrophy patterns. Next, we evaluated how the sample size affects the performance of the methods. Lastly, we assessed the false positive rate of these methods.
Analytical vs. Experimental Estimation of p-values
MIDAS makes use of an efficient, analytic approximation to estimate p-values (Eq. (8)). To assess the validity of the approximation, we compared the analytically approximated p-values of the MIDAS statistic to the ones that were empirically estimated through non-parametric testing based on 2000 permutations (see Fig. 3 Left). One can visually appraise the high alignment between the two estimations. Few inconsistencies were observed, which may be due to an insufficient number of permutations. This is further supported by the decreasing mean squared error of the analytically approximated p-values compared to the empirically estimated ones with increasing number of permutations (Fig. 3 Right).
Fig. 3.
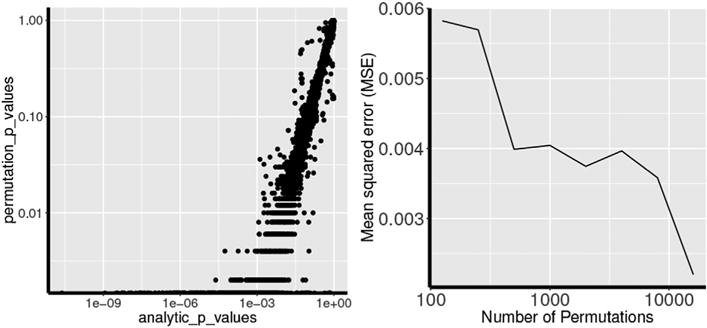
Left: Log-log scale plot of the distribution of analytic-vs. permutation-based estimation of MIDAS p-values. Right: Mean squared error of p-value estimation as a function of increasing number of permutations.
Robustness to parameter variation
In this experiment, we introduced 35% atrophy in the data, and evaluated how the performance of each method changes when varying its key parameters. For VBM, P-VBM, and P-SVM the full-width half maximum (FWHM) of the Gaussian smoothing kernel for the input images was varied from 4 mm to 10 mm, at 2 mm intervals. For Searchlight, the searchlight radius was ranged from 2 voxels (4 mm) to 5 voxels (10 mm). For ODVBA and MIDAS, the neighborhood radius r was varied from 8 voxels (16 mm) to 20 voxels (40 mm). For MIDAS, the c parameter was varied from 10−1 to 100. The performance was assessed by thresholding detections at false discovery rate (FDR) (Benjamini and Hochberg, 1995) level q < 0.05, and then calculating the True Positive Rate (TPR) and the False Positive Rate (FPR).
Quantitative results for all methods are shown in Fig. 4. The TPR and FPR, as well as the entire receiver operating curve (ROC) for all methods, are reported. MIDAS produced the fewest false positives for almost all parameter configurations. At the same time, MIDAS was able to obtain high TPR. Methods that depend on Gaussian smoothing, such as VBM, P-VBM, and P-SVM, were able to obtain high TPR at the cost of high FPR. Similarly, Searchlight was not able to attain high TPR without conceding high FPR. Converging conclusions can be drawn by visually inspecting the ROC curve. MIDAS achieved the highest area under the curve, followed by ODVBA. ODVBA and MIDAS are similar in spirit as they both perform local discriminative learning to tease out local signal patterns. However, MIDAS, on top of attaining a slightly higher TPR, is computationally more efficient than ODVBA. MIDAS makes use of efficient analytical approximations resulting in a computational time that is three magnitudes faster than that of ODVBA, which is based on computationally expensive permutation tests.
Fig. 4.
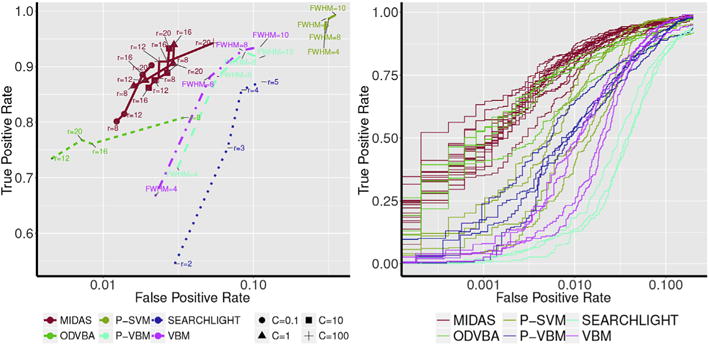
Left: Estimated FPR (x-axis) and TPR (y-axis) for all methods and parameters using data with 35% simulated atrophy. Detected regions were estimated by thresholding significance maps at FDR level q < 0.05. Right: Receiver operating curves for all methods at all considered parameter combinations. Results for different methods are color-coded as follows: MIDAS, red; VBM, magenta; P-VBM, blue; ODVBA, green; Searchlight, cyan; and P-SVM, yellow. Results were obtained by varying method parameters. For MIDAS, different values for neighborhood radius r and loss penalty c (indicated by different markers) were examined. For VBM, P-VBM, and P-SVM different levels of Gaussian smoothing were investigated. For ODVBA and searchlight, increasing neighborhood radii were tested. The proposed method maintained on average higher sensitivity and specificity than all other methods. Moreover, MIDAS exhibited relatively stable performance independent of the employed parameters. ODVBA showed similar specificity to MIDAS, but at the cost of relatively lower sensitivity and significantly increased computational time.
The regions that were detected as significant for all methods and parameter configurations are shown in Fig. 5. In agreement with the quantitative results, we note that VBM, P-VBM, were able to decrease the number of false negatives (shown in white) with increasing smoothing, albeit at the cost of increasing the number of false positives (shown in orange). A similar trend was observed in the case of Searchlight when increasing the neighborhood radius. P-SVM detects the effect of interest for all parameters, but produces false positives. ODVBA, on the contrary, did not produce false positives, but the number of false negatives depended on the size of the local neighborhood. MIDAS produced few false positives, while also achieving few false negatives. Importantly, the results were stable across all parameter settings.
Fig. 5.
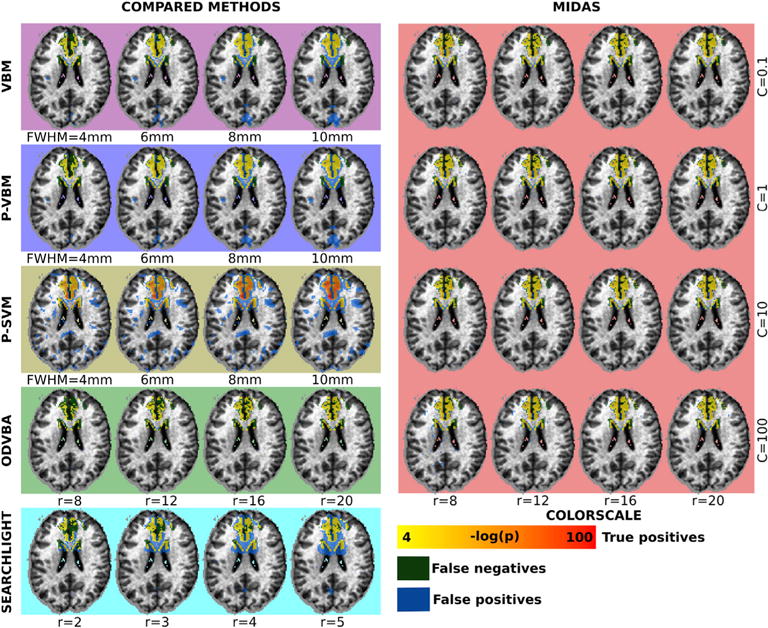
Detection results obtained by all methods using the dataset with 35% simulated atrophy. Regions were estimated by thresholding significance maps at FDR level of q < 0.05. The resulting masks were compared to the ground-truth: true positives for all methods are color-coded by yellow to red gradient, false positives are denoted by blue voxels, while false negatives are denoted by green voxels. Results by varying the Gaussian smoothing kernel size (in the case of VBM, P-VBM, P-SVM), the neighborhood radius size (in the case of ODVBA and Searchlight), as well as the neighborhood radius and c parameter (in the case of MIDAS), are shown.
Sensitivity to the size of the simulated effect
To further evaluate the capability of the compared methods to detect the simulated atrophy, we created additional datasets by varying the simulated atrophy in the frontal lobe mask (Fig. 2) from 15% to 35%. Detected regions were first determined by thresholding significance maps at FDR level q < 0.05, and then compared to the ground-truth. As previously, we evaluated the performance of the methods by calculating TPR and FPR, as well as measuring the area under the receiver operating characteristic curve (AUC). For each method, the parameters that yielded the highest TPR for the 35% simulated atrophy experiment were used. Specifically, for VBM, P-VBM, and P-SVM, the FWHM of the Gaussian smoothing kernel for the input images was set to 8 mm. The Searchlight radius was also fixed to 8 mm radius. The neighborhood radius of ODVBA and MIDAS was set to 16 mm, while the c parameter of MIDAS was set to the default value of 1.
As expected given the choice of parameters, all methods achieved high TPR, while increasing the degree of simulated atrophy resulted in increased TPR (see Fig. 6). MIDAS was able to reveal the true signal for varying levels of atrophy, and at a TPR comparable to VBM and P-VBM. Importantly, MIDAS was able to attain lower FPR than both VBM and P-VBM for all atrophy levels. Only ODVBA was able to attain slightly lower FPR than MIDAS for some atrophy levels, but that was achieved at the cost of much lower TPR. The above differences were also reflected in the AUC measurements. Increased atrophy resulted in increased AUC values for all methods, with VBM, P-VBM, and Searchlight converging in lower values than MIDAS and ODVBA. MIDAS and ODVBA achieved similar best performance for high levels of atrophy, while MIDAS retained high-quality performance for low levels of atrophy too.
Fig. 6.

Performance as a function of the degree of simulated atrophy. Performance is quantified by estimating TPR (left) and FPR (center) at FDR level q < 0.05, as well as measuring the area under the receiver operating characteristic curve (AUC; right). Results for different methods are color-coded as follows: MIDAS, red; VBM, magenta; P-VBM, blue; ODVBA, green; Searchlight, cyan; and P-SVM, yellow. For each method, the parameters that yielded the highest TPR for the 35% simulated atrophy experiment were used. As a consequence, most methods achieved high TPR, with increased TPR being observed for higher degrees of atrophy. The methods differed with respect to the FPR they achieved. MIDAS attained lower FPR than all other methods, except for ODVBA, which also exhibited the lowest TPR.
The regions that were detected as significant for all methods and degrees of atrophy are shown in Fig. 7. In agreement with the quantitative results, we note that VBM, P-VBM, P-SVM, and Searchlight were able to identify increased portions of the underlying signal for increased degrees of simulated atrophy. However, they also resulted in an increasing number of false positives. ODVBA and MIDAS, on the contrary, were able to able to recover increasing portions of the simulated signal, while introducing less false positives.
Fig. 7.
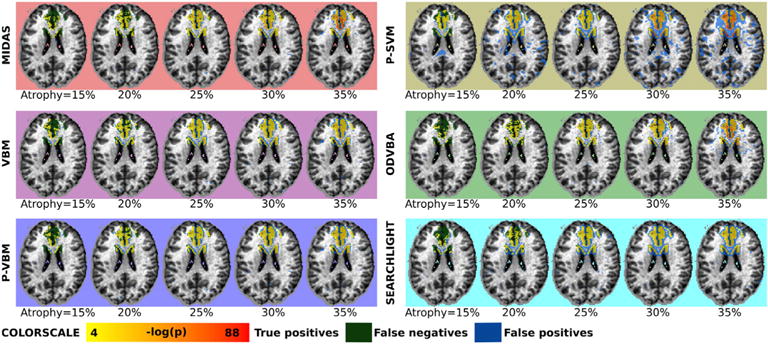
Regions detected by all methods for different degrees of introduced atrophy. Regions were estimated by thresholding significance maps at FDR level of q < 0.05. True positives for all methods are color-coded by yellow to red gradient, false positives are denoted by blue voxels, while false negatives are denoted by green voxels.
Sensitivity to the shape of the simulated effect
The goal of this experiment is to investigate how the shape and extent of the underlying pathology influence, in conjunction with the used parameters, the performance of the different methods. Towards this end, the simulated atrophy in the frontal lobe was broken into three sub-regions of different morphology (Fig. 8 A, B, C), and 35% atrophy was introduced successively to each subregion while leaving the rest intact. Moreover, each method was run by using multiple parameters. For VBM, P-VBM, and P-SVM, we varied the FWHM of the Gaussian smoothing kernel from 4 mm to 10 mm, with a step of 2 mm. Similarly, the radius of the searchlight was ranged from 4 mm to 10 mm. The neighborhood radius of ODVBA and MIDAS was ranged from 16 mm to 40 mm. Lastly, the c parameter of MIDAS was set to 1.
Fig. 8.
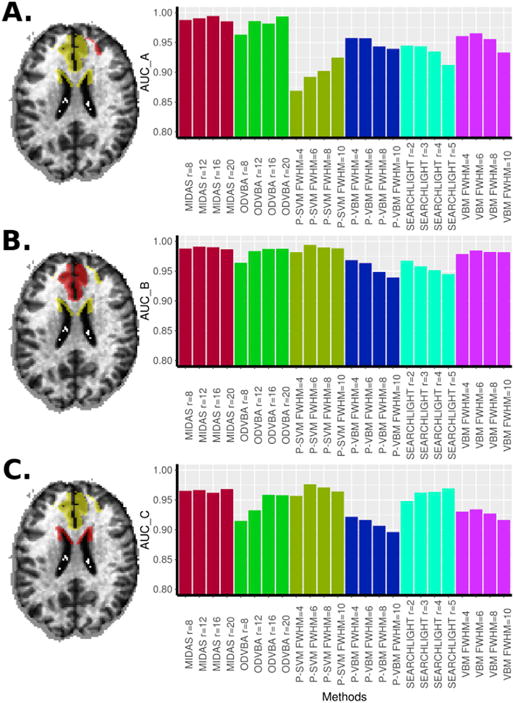
The AUC of compared methods for three simulated effect shapes. The red subregion of the atrophy mask (in yellow) was subjected to 35% atrophy. The resulting AUC of the compared methods under varying smoothing parameters (as in the case of VBM, P-VBM, and P-SVM), or radii (as in the case of MIDAS, ODVBA, and Searchlight), is shown on the right.
The performance of all combinations of methods and parameters was assessed by measuring the AUC, which was calculated by comparing the ground-truth mask and the respective voxel-wise statistics (Fig. 8). We note that different levels of smoothing (as utilized by VBM, P-VBM, and P-SVM) were optimal for detecting different effects. For example, in the case of elongated and more focal simulated effects (Fig. 8A and C), less smoothing was optimal for VBM compared to the case of the larger simulated effect in Fig. 8B. This is because a matched filter is required to better detect the underlying signal. As a consequence, focal patterns require less smoothing than larger ones to yield specific brain maps. Similarly, in the case of Searchlight, different neighborhood sizes, containing sufficient informative voxels, were optimal for detecting different effects. Contrary to the other methods, MIDAS was able to detect effects of different shape and extent with high accuracy regardless of the choice of parameters.
Exploring the effect of the sample size
This experiment aims to study the statistical power of each method as a function of the sample size. Towards this end, we generated multiple datasets by introducing 35% simulated atrophy in the frontal lobe mask (Fig. 2), and varying the sample size from 40 to 400. For every sample size, we applied each method ten times, and estimated the average AUC (Fig. 9).
Fig. 9.
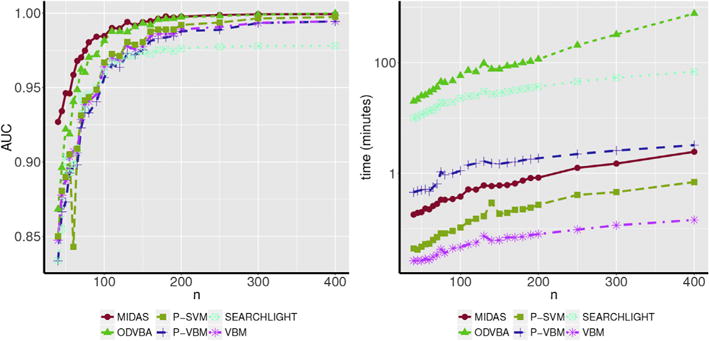
AUC versus sample size (n; left) and runtime versus sample size (n; right). While the AUC of all compared methods increased with sample size, MIDAS was more powerful than the compared methods at all sample sizes. Furthermore, while ODVBA approached the statistical power of MIDAS at larger sample sizes, this was at the cost of being several orders of magnitude more computationally expensive.
Given enough samples, all methods were able to detect the strong simulated signal. With increasing available data, most methods converged to a high AUC value. However, important differences were observed for lower samples sizes. In these cases, MIDAS demonstrated advantageous statistical power in detecting the underlying signal compared to the other methods. Additionally, the comparable statistical power of ODVBA relative to MIDAS is offset by its high computational expense, which is at least two orders of magnitude higher than the run-time of MIDAS.
Evaluating the family-wise error
In this experiment, we evaluated the probability of making one or more false discoveries for each method. Towards this end, we used random subsets of healthy controls subjects without inducing any simulated atrophy. As a consequence, the null hypothesis of no group difference should be true. Group comparisons were performed ten times using each method, and the FPR at p < 0.05 level was computed for each method (Fig. 10 Left).
Fig. 10.
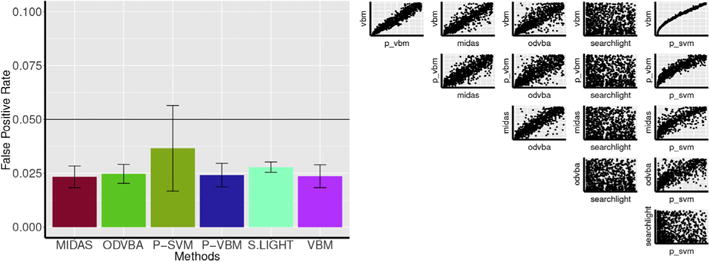
Left: The FPR at p < 0.05 level for all methods is shown. Right: Pairwise comparison of p-values obtained by all methods. Vertical and horizontal axes range from 0 to 1.
As expected, the FPR at p < 0.05 was within 5% for all methods. It should be noted that P-SVM yielded noticeably higher FPR than all other methods. This finding was also observed in experiments discussed in Secs. 3.2.2 and 3.2.3.
To further compare the behavior of the methods in the absence of any signal, p-value scatter plots between the different methods are shown in Fig. 10 Right. One observation is that the p-values of Searchlight were uncorrelated to the p-values of all other methods. Another interesting finding is that the p-values of P-SVM followed a sub-linear relationship with respect to VBM p-values. While higher p-values of P-SVM followed a linear trend with VBM p-values, the lower p-values of VBM were further lowered by P-SVM. This may explain why P-SVM generates a higher number of significant voxels, even in the absence of underlying signal.
Simulated regression case study
To demonstrate the regression ability of MIDAS, we created another validation dataset by continuously varying the simulated atrophy in bilateral temporal lobe regions (Fig. 11) as a function of age in 100 control subjects whose ages ranged from 55 to 90. For the mildest effect simulated, 55-year-olds experienced zero atrophy while 90-year-olds were simulated to have 15% atrophy. In the strongest case simulated, 55-year-olds again experienced zero atrophy whole 90-year-olds experienced 50% atrophy bilaterally in temporal lobe regions. To further render this simulation realistic and to decrease signal to noise ratio, 15% label noise was added in the sense that the exhibited atrophy was randomly modulated to be within 15% of the expected atrophy at the subject age.
Fig. 11.
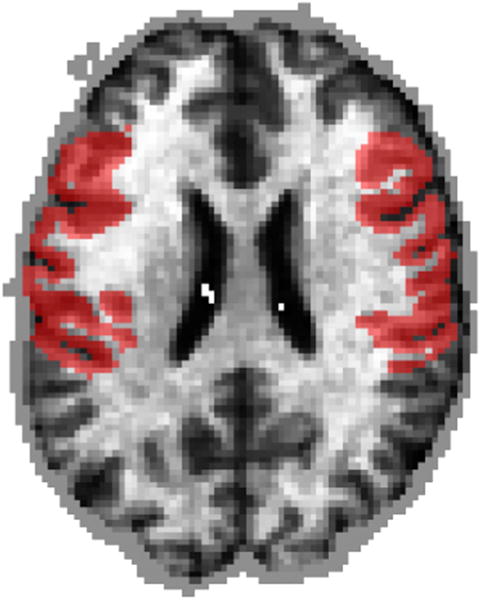
The temporal lobe regions that were subjected to simulated atrophy in the regression validation experiments is denoted by the red mask.
For evaluation, in addition to MIDAS, only VBM and searchlight were suitable for regression cases and were thus tested in this validation study.
Similar to previous evaluations, detected regions were first determined by thresholding significance maps at FDR level q < 0.05, and then compared to the ground-truth. We evaluated the performance of the methods by calculating TPR and FPR, as well as measuring the area under the receiver operating characteristic curve (AUC). For VBM, the FWHM of the Gaussian smoothing kernel for the input images was set to 8 mm. The Searchlight radius was also fixed to 8 mm radius. The neighborhood radius of MIDAS was set to 16 mm, while the c parameter of MIDAS was set to the default value of 1.
The TPR and FPR of MIDAS, VBM, and searchlight in the simulated regression case study are displayed in Fig. 12. MIDAS was able to uncover the underlying atrophy pattern at much weaker level of signal than both VBM and searchlight. As observed in previous sections, all methods exhibited higher TPR at increasing signal strength but with increased levels of false positives. However, the AUC plot demonstrates that the increase in true positives is much greater in magnitude than false positives. In addition, VBM and searchlight exhibited similar levels of true positives. However, searchlight false positives were considerably greater which resulted in lower AUC.
Fig. 12.

Performance as a function of the degree of simulated atrophy in the regression validation case. Performance is quantified by estimating TPR (left) and FPR (center) at FDR level q < 0.05, as well as measuring the area under the receiver operating characteristic curve (AUC; right). Results for different methods are color-coded as follows: MIDAS, red; VBM, magenta; and Searchlight, cyan. Increasing atrophy levels resulted in increases in both TPR and FPR for all methods. However, considering these two measures in conjunction through AUC revealed that MIDAS had the greatest TPR to FPR trade-off of all compared methods.
To visually appraise the results, the regions that were detected as significant for all methods and degrees of atrophy are shown in Fig. 13.
Fig. 13.
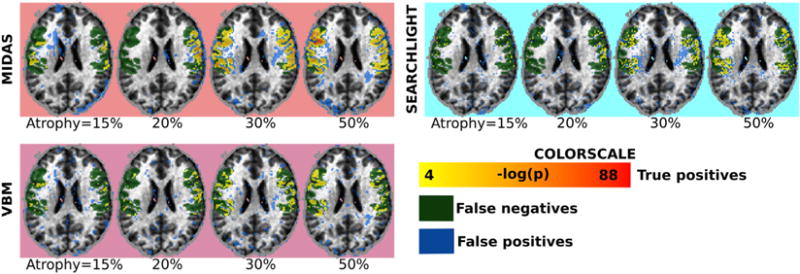
Regions detected by all methods for different degrees of introduced atrophy. Regions were estimated by thresholding significance maps at FDR level of q < 0.05. True positives for all methods are color-coded by yellow to red gradient, false positives are denoted by blue voxels, while false negatives are denoted by green voxels.
Functional neuroimaging data from a lie detection study
We applied MIDAS along with the comparative methods to a dataset comprising functional MRI (fMRI) scans of individuals undertaking lying and truth-telling tasks in a forced choice deception experiment (Langleben et al., 2005). For the study, 52 right-handed males (mean age = 19.36±0.5) were recruited. Functional data were pre-processed to obtain parameter estimate images (PEIs) as described by Davatzikos et al. (2005), who also provided the data.
The estimated PEIs were then given as input to the compared methods to locate the brain regions that were most distinctive between the two tasks. Specifically, two PEIs for each subject were obtained and formed two groups that included 52 PEIs corresponding to truth-telling and 52 PEIs corresponding to lying, disregarding the pairing present in the samples. Although this neglect reduces potential statistical power, this was done to compare all methods on equal footing. The parameters used for MIDAS were c = 1 and r = 16. For ODVBA, r = 16 was used. For Searchlight, r = 3 was used. For VBM, P-VBM, and P-SVM, FWHM = 8 mm was the smoothing kernel for the images. Statistically significant regions at FDR level q < 0.05 for all methods are shown in Fig. 14. We note that Searchlight and VBM approaches detected fewer regions. On the contrary, P-SVM, ODVBA and MIDAS found similar regions to be significantly different between the task-based groups, including cerebellum, insular cortex, cingulate, medial frontal gyrus, and postcentral gyrus. Detected regions align well with previously reported results (Langleben et al., 2005). P-SVM resulted in statistical maps exhibiting the largest spatial extent. However, this may be due to including false positive regions as was observed in the simulation experiments. MIDAS, on the contrary, demonstrated the highest significance in group differences within the identified voxels. Specifically, MIDAS was able to detect highly specific activation in the supramarginal gyrus, which is associated with truth-telling.
Fig. 14.
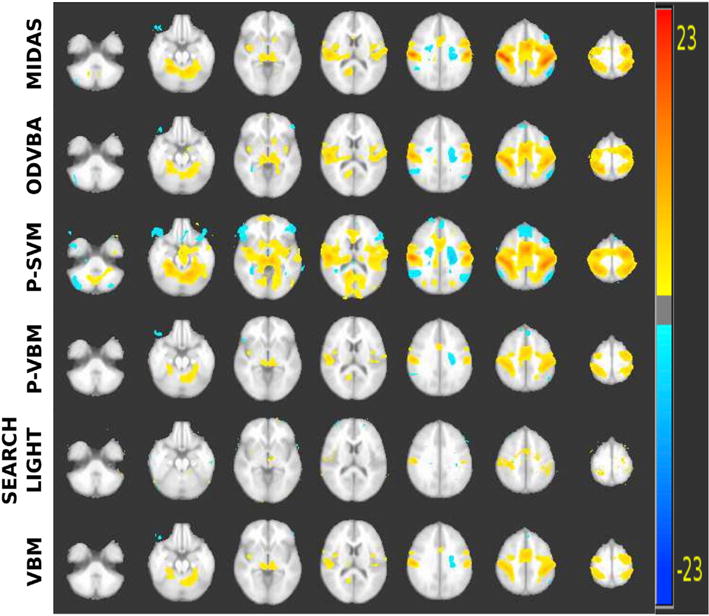
Significant regions detected after FDR correction (q < 0.05) by all methods using the functional MRI lie detection task dataset. The color intensity indicates -log p value. Warmer colors indicate increased activation during truth telling, while colder colors indicate increased activation during lying. The color scale is matched for all methods to facilitate comparisons.
Due to the lack of ground-truth, we further quantitatively evaluated the compared methods in terms of split sample reproducibility. The study sample was randomly divided into halves ten times, and for each split, the compared methods were applied. Reproducibility was calculated in two ways by measuring the Dice coefficient and the adjusted Rand index (ARI) (Hubert and Arabie, 1985) between the significant regions detected at each split after FDR correction (q < 0.05). While Dice coefficient is a common measure for assessing the overlap between sets, ARI provides a complementary view of set similarity that is adjusted for chance. This property of ARI enables a more fair comparison of the set of voxels that pass the significance threshold across sample splits when the regions of significance vary in spatial extent. Although there is no consensus on what is considered to be a good value of Dice coefficient and ARI, a Dice of over 0.50 is considered to be acceptable while ARI of over 0.75 is deemed excellent, 0.40 to 0.75 as fair to good, and below 0.40 as poor (Fleiss et al., 2013).
The average Dice coefficient and adjusted Rand index (ARI) across pairs of sample splits are reported in Fig. 15 for all methods. MIDAS demonstrated the highest average split sample reproducibility at 0.64 ± 0.07 (Dice) and 0.46 ± 0.09 (ARI). The second highest performing method in terms of Dice coefficient was P-SVM with an average Dice of 0.61 ± 0.08. On the other hand, VBM had the second highest ARI at an average of 0.31 ± 0.08. Searchlight had the lowest average split sample reproducibility with an average Dice coefficient of 0.18 ± 0.20 and average ARI of 0.17 ± 0.04.
Fig. 15.
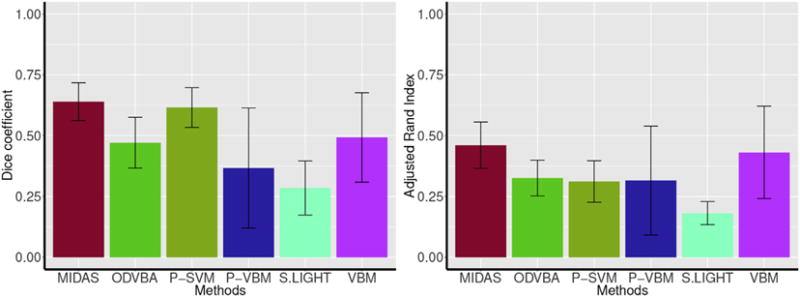
Average split sample reproducibility of the compared methods for the lie detection dataset measured by Dice coefficient and adjusted Rand index. The error bars denote standard deviation. MIDAS demonstrated the highest reproducibility at 0.64 Dice coefficient and 0.46 adjusted Rand index on average. P-SVM had the second highest Dice coefficient at 0.61 on average while VBM had the second highest adjusted Rand index at 0.43 on average. Searchlight achieved the lowest reproducibility with an average Dice coefficient and adjusted Rand index of 0.18 and 0.17, respectively.
Structural neuroimaging data from a cognitive performance study
To observe the regression performance in a clinical dataset, we applied MIDAS, VBM, and searchlight to a structural MRI (sMRI) dataset comprising of 100 mild cognitive impairment subjects from the Alzheimer’s disease neuroinitiative (ADNI) study. The sMRI images were processed using the same steps as described in section 3.2 to yield gray matter volumetric tissue density maps. The continuous score that the imaging features were regressed against was Alzheimer’s Disease Assessment Scale Cognitive Behavior Section (Adas-cog-13) which is a measure of cognitive performance that is widely used in Alzheimer’s disease trials (Mohs, 1983). A higher Adas-cog-13 score indicates a greater level of cognitive dysfunction.
The gray matter tissue density maps, known as RAVENS maps (Davatzikos et al., 2001), were given as input to the compared methods to locate the brain regions that were most associated with cognitive performance as quantified by Adas-cog-13 score. The parameters used for MIDAS were c = 1, r = 16. The searchlight radius was r = 3 while the VBM smoothing kernel was FWHM = 8 mm. Statistically significant regions at FDR level q < 0.05 for all methods are shown in Fig. 16. For maps that are corrected for multiple comparisons, VBM yielded fewer regions than MIDAS while searchlight failed to yield any significant regions. Significance maps that are not corrected for multiple comparisons are shown in Fig. 17 with voxels passing p < 0.05. Similarly, MIDAS yielded regions with more extreme p-values as well as a greater amount of them relative to VBM and searchlight. Importantly, MIDAS was able to accurately associate white matter hyperintensities and medial temporal lobe atrophy with increased Adas-cog-13 scores which is corroborated by larger sample studies in past literature (van de Pol et al., 2007).
Fig. 16.
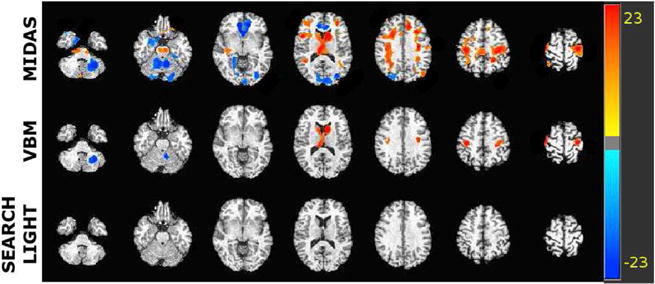
Significant regions detected after FDR correction (q < 0.05) by all methods using the structural MRI mild cognitive impairment dataset. The color intensity indicates -log p value. Warmer colors indicate increased tissue density correlated with Adas-cog-13 score, while colder colors indicate decreased tissue density correlated with Adas-cog-13 score. The color scale is matched for all methods to facilitate comparisons.
Fig. 17.
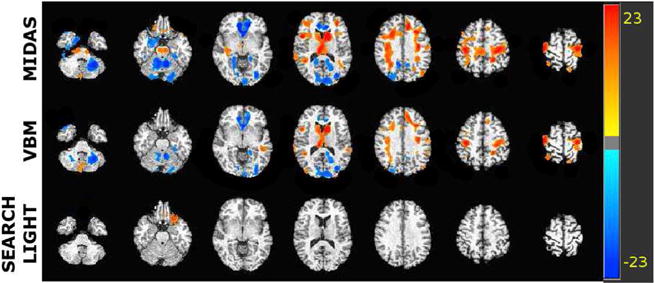
Significant regions uncorrected for multiple comparisons (p < 0.05) by all methods using the structural MRI mild cognitive impairment dataset. The color intensity indicates -log p value. Warmer colors indicate increased tissue density correlated with Adas-cog-13 score, while colder colors indicate decreased tissue density correlated with Adas-cog-13 score. The color scale is matched for all methods to facilitate comparisons.
Discussion
Synopsis
In this paper, we have introduced a novel multivariate pattern analysis method, termed MIDAS, for statistical parametric mapping analysis of images. In the proposed framework, discriminative learning is applied to regional neighborhoods towards estimating the multivariate pattern that best reflects the effect of interest, such as a group difference or regression against a clinical variable. Information from regional discriminants derived from multiple neighborhoods is combined to estimate a statistic for each voxel that is associated with them. Intuitively speaking, this statistic assigns high values to voxels that contribute significantly to highly discriminative learners. Critically, an analytic approximation of the null distribution is employed towards efficiently estimating voxel-wise significance without the need for very costly permutation tests. The proposed framework was extensively validated using simulated data, and tested on real functional MRI data pertaining to lie detection and a structural MRI dataset of mild cognitive impairment. Compared to commonly used brain mapping techniques, the proposed framework demonstrated advantageous performance, underscoring its potential to efficiently map effects of interest in both structural and functional data.
Comparison with voxel-based analysis methods
Commonly applied voxel-based analysis techniques smooth the data spatially using kernels defined in an ad hoc or empirical way, thus imposing a priori assumptions regarding the shape and spatial extent of the effect of interest, which itself might be heterogeneous throughout the brain. Such assumptions may lead to reduced statistical power and spatial specificity of the resulting maps as the applied smoothing is seldom adapted to the scale and shape of the signal of interest. In sharp contrast to them, the main premise of MIDAS is that it optimally detects effects of interest by effectively applying a form of matched filtering. Since the underlying effect to which the matched filter should adapt is not known in advance, regional discriminative analyses are used to combine information from the most informative voxels resulting in a regional optimal filtering. Critically, this filtering does not blur or smear out the derived statistical parametric maps, since those are eventually formed at the voxel resolution by forming a voxel-wise statistic informed by all regional learners that include a particular voxel.
Comparison with multivariate methods
MIDAS is somewhat similar in spirit to Searchlight, ODVBA, and P-SVM. Nonetheless, it significantly deviates from them. First, MIDAS creates the information map by taking into account the contribution of each voxel to the classifiers that include it as well as the classifier’s discriminative power. This is in contrast to Searchlight that assigns each searchlight’s classification accuracy to its center voxel. This difference has two important implications: i) it allows for a more refined characterization of the importance of each voxel, and ii) it increases computational efficiency by relaxing the requirement of running regional classification for every voxel. The only requirement in the case of MIDAS is that the employed neighborhoods should cover sufficiently the whole image volume. By appropriately combining information from all neighborhoods, MIDAS can estimate the per-voxel statistics.
Second, MIDAS and ODVBA share the goal of estimating the optimal spatially adaptive filtering of the data. However, their design and implementation are significantly different. ODVBA is designed to tackle group comparison tasks, and cannot naturally handle regression tasks. Moreover, ODVBA is based on non-negative discriminative projection, which hinders an analytical approximation of the statistical significance map. As a consequence, computationally expensive permutation tests are required for the estimation of voxel-wise p-values. On the contrary, MIDAS is generic and can readily handle both group comparison and regression tasks. Additionally, MIDAS introduces an analytical approximation of the null distribution of the proposed statistic, achieving significant speed-up making it attractive for computational neuroanatomy applications using large neuroimaging data.
P-SVM is also based on an analytical estimation of voxel-wise significance maps. This estimation is founded on the assumption of a high dimensional low sample size setting. MIDAS does not make such an assumption when deriving its analytical approximation model. Interestingly, this model can be understood as a bootstrapping generalization of P-SVM (Gaonkar and Davatzikos, 2013; Gaonkar et al., 2015), endowed with a similar, yet different, null distribution. Theoretically, bootstrapping can be used to stabilize otherwise noisy statistics (Efron and Tibshirani, 1986). Empirically, we showed that MIDAS statistic yields a higher AUC than P-SVM for different degrees of atrophy (Fig. 4) and number of samples (Fig. 9). Lastly, in MIDAS, we further incorporated the correction procedure proposed by Haufe et al. (2014) to utilize interpretable activations rather than weight vectors.
In summary, the proposed framework addresses important limitations of alternative methods. MIDAS makes use of optimal spatially adaptive filtering to detect with improved sensitivity structural, or functional signal of interest. Specifically, MIDAS was found in several experiments to consistently delineate effects of interest while being relatively invariant to the tuning parameters, facilitating its usage and favoring reproducible research. Additionally, it demonstrated increased sensitivity in detecting the signal of interest at various degrees of strength, without introducing false positives. Notably, increased sensitivity was observed for both small and large sample sizes. Moreover, we experimentally found that MIDAS is capable of revealing underlying effects of different shape and spatial extent across multiple parameter settings. The robustness of MIDAS with respect to varying shape and size of regions sought is primarily due to its inherent adaptive nature in estimating the regionally optimal way to filter the data. This optimal filtering does not smear out the underlying signal while allowing MIDAS to truly delineate sharp multivariate patterns rather than peri-voxel patterns mapped through searchlight (Etzel et al., 2013). Critically, using functional MRI data in a split sample setting, we showcased the high robustness of the proposed framework as quantified by the reproducibility of the obtained results. Reproducibility, being orthogonal to the measures of sensitivity and specificity, further assures the reliability and robustness of the proposed method.
Comparison with multivariate feature selection methods
The output of MIDAS is a spatial map reflecting significant group effects or correlations with non-imaging variables. As such, this map can be used to perform feature selection for a subsequent classification, or regression task using a properly nested cross-validation scheme. In that sense, MIDAS bears similarities to multivariate feature selection methods Guyon et al. (2002); Langs et al. (2011); Rasmussen et al. (2012); Ganz et al. (2015); Rondina et al. (2014). These methods are designed to identify a set of appropriate features for making predictions on unseen data. Towards this end, they are often based on elaborate measures whose null distribution is difficult to estimate. Importantly, as these methods are particularly concerned with maximizing the accuracy of the predictions, they may be influenced by confounding variations in the data, rendering the features uninterpretable with respect to the processes under study Haufe et al. (2014). Lastly, they often choose a small set of features, which may not fully reflect the true underlying variability despite their superior prediction performance. On the other hand, MIDAS may not result in improved predictive accuracy, but yields tractable, analytically solvable statistics for interpretable inferences.
Importance of the choice of local learner
The choice of the least squares support vector machine as the base learner for the local discriminative analysis is important for the computational efficiency of the proposed framework. The LS-SVM admits a closed form solution, which is estimated as a linear function of clinical variables. This allows for analytically estimating the solution vector’s null distribution, which in turn enables the analytical estimation of the distribution of the MIDAS statistic. This is in contrast to several variants of the searchlight family of methods, as well as ODVBA, whose base learners cannot be solved in closed form, thereby requiring costly permutation testing procedures.
Importantly, the choice of the LS-SVM adds to the versatility of the proposed framework. The LS-SVM can tackle both classification and regression designs. Moreover, the LS-SVM can be readily modified to accommodate different regularization terms encoding distinct assumption regarding the nature (e.g., smoothness, or spatial extent) of the underlying signal (see 4.7). Critically, this does not impact the closed form nature of the solution, thus maintaining the benefits of rapid analytical approximations of null distributions.
Generalization to different study designs and data types
The proposed framework is designed for cross-sectional studies where each subject provides a single image. However, the framework is general in terms of input imaging modality. In this paper, we demonstrated its applicability to both structural and functional data. However, the underlying statistical model does not make any further assumptions regarding the nature of the input data and can be applied to a very broad family of statistical parametric mapping tasks. Moreover, while our validation setting was based on classification tasks, MIDAS is also applicable to regression tasks. Our formulation does not make any assumption about the domain of clinical variables, which are not constrained to be binary. As a consequence, one may readily apply MIDAS when aiming to capture effects of interest reflected by continuous variables, such as aging or development. This is an important advantage of MIDAS compared to ODVBA, which is designed for binary scenarios.
A note about regularization
MIDAS employs LS-SVM as the base local discriminative learner. In the described formulation, the LS-SVM makes use of the Euclidean norm to enforce the smoothness of the estimated weights. Nonetheless, this choice does not preclude the use of different regularization terms, which could better encode the nature of the imaging data. Such a regularization term is wTΣw, which enforces nearby voxels to carry similar weights (Bernal-Rusiel et al., 2013), potentially improving the quality of the resulting statistical brain maps.
Accounting for covariate effects
A practical feature of the MIDAS framework is that the use of local linear learner admits explicit covariate effect corrections as derived in Haufe et al. (2014) and explained in detail in C. This procedure enables the analysis of datasets with non-uniform distribution of covariates, whose effects would otherwise bias the resulting statistical parametric maps. This property of MIDAS is in stark contrast with ODVBA and searchlight family of methods, which necessitate the prior correction of the covariate effects. The latter may be problematic if the covariates to be corrected are not uniformly distributed with respect to the groups of interest.
Limitations and extensions
MIDAS in its formulation assumes a linear relation between clinical variables and the imaging features where the statistical mapping is to be performed. While this assumption is mainly made to facilitate the use of the analytical estimation of the null distribution for fast computational speed, it is one of the limitations of MIDAS. Contrastingly, searchlight family of methods can admit non-linear learners such as Gaussian kernels for information mapping and may be more sensitive to non-linear relations between the clinical variables and imaging features.
It is possible to generalize MIDAS statistic to handle non-linear kernels such as Gaussian radial basis function (RBF) kernel and non-differentiable regularizations such as ℓ1-norm that induces a sparse prior on model weights. One possible extension of MIDAS is one that utilizes the Gaussian kernel in the local learner formulation. Cotter et al. (2011) have shown that the non-linear decision boundaries using Gaussian kernels can be locally linearly approximated. While these approaches may have advantages in its ability to generalize a wider class of predictive situations, it incurs a high computational price as present in searchlight family of methods since the estimation of null distribution is not as straightforward as in the linear case and requires permutation testing.
One limitation of MIDAS is that in its current formulation it is only applicable to cross-sectional study designs where each subject provides a single image for analysis. However, it is possible to extend MIDAS to allow paired sample study designs as well as longitudinal studies by utilizing difference maps and longitudinal slopes as input features. Specifically, to emulate a paired statistical test, a group of difference images can be contrasted against a group of commensurate number of empty images using the current MIDAS implementation. Furthermore, to emulate a longitudinal study where each subject provides a set of images over the course of time, the slopes and intercepts of subject trajectories can be input to MIDAS to result in corresponding slope and intercept statistical maps. To fully take into account paired and longitudinal study designs requires an alternative loss function in equation (2.2) and is an interesting future direction.
Lastly, another limitation of MIDAS is that it can handle only a single imaging modality in its analysis. A future direction of work is to incorporate multiple kernel methods (Gönen and Alpaydın, 2011) in the base learners of MIDAS to handle multi-modal datasets such as imaging and genetic or MRI and positron emission tomography (PET) imaging.
Software distribution
To enable readers to replicate results presented in this manuscript and perform further experiments of their own, we have distributed the source code through the Mathworks File Exchange central at https://www.mathworks.com/matlabcentral/fileexchange/66411 as well as the supplementary material.
Conclusion
In conclusion, we have shown in this paper that it is possible to efficiently obtain high-quality brain maps by exploiting locally linear discriminative analysis and analytic approximations of permutation tests. We experimentally demonstrated that MIDAS bears important advantages compared to commonly used brain mapping techniques, underlining its potential value in neuroimaging studies.
Supplementary Material
Acknowledgments
This work was partially supported by the National Institutes of Health (grant numbers R01-AG014971 RF1-AG054409 R01-MH112070).
Appendix A. Optimization
The Lagrangian for LS-SVM is:
| (A.1) |
which leads to the following KKT condiditons:
| (A.2) |
These lead to the matrix equation:
| (A.3) |
which yields the solutions for w and b as:
| (A.4) |
Therefore, if C = M−1 then w and b can be recovered by taking into account the respective submatrices of C:
| (A.5) |
which are linear solutions with respect to the clinical variables y. Recall that d is the dimensionality, and n is the sample size of the data matrix X.
Appendix B. Moments calculation
Here, it is assumed that the data X and the clinical variables y remained fixed for a particular analysis. The randomness occurs from applying permutation operations on the clinical variables y. Therefore, the expectation, variance and covariance operators, E(·), Var(·), Cov(·) are with respect to the uniform distribution of permutations on y.
Without loss of generality, it is assumed that the clinical variables are z-scored, such that under random permutation, E(yj) = 0 and Var(yj) = 1. Otherwise, these can be z-scored prior to analysis.
The first moment is approximated, up to the first order term, using the delta method (Casella and Berger, 2002):
| (B.1) |
The second moment is also approximated, up to the first order term, using the delta method:
| (B.2) |
Note that , and .
Also, since , then . Therefore,
| (B.3) |
Taken together, the second moment is estimated as:
| (B.4) |
Appendix C. Multiple clinical variables
The optimal weight vector in LS-SVM is a product of the aforementioned C matrix, which solely depends on the data samples X and the non-imaging variables y (e.g., clinical diagnosis). Therefore, multiple discriminative model weights, W ∈ Rd×r, can be obtained if multiple non-imaging variables, Y ∈ Rn×r (e.g., diagnosis, age, sex, etc.), are used for training:
| (C.1) |
As explored in Haufe et al. (2014), these models can be adjusted for the underlying noise patterns, as well as the interdependent effects between the non-imaging variables, by left and right multiplying the weight vectors W with the data covariance matrix and the inverse label covariance matrix, respectively. This results in activation patterns A, where the effect captured by each weight vector is independent of the underlying noise and possible imbalances in the non-imaging variable distributions:
| (C.2) |
The expectation of the multiple activations is still zero, which results in the corresponding MIDAS statistic for the qth non-imaging variable, to also have an expectation of zero:
| (C.3) |
Using the steps taken to estimate variance yields that for the qth weight vector,
| (C.4) |
where , and Hq is the qth column of H.
Appendix D. Supplementary data
Supplementary data related to this article can be found at https://doi.Org/10.1016/j.neuroimage.2018.02.060.
References
- Allefeld C, Haynes JD. Searchlight-based multi-voxel pattern analysis of fMRI by cross-validated MANOVA. NeuroImage. 2014;89:345–357. doi: 10.1016/j.neuroimage.2013.11.043. [DOI] [PubMed] [Google Scholar]
- Ashburner J, Friston KJ. Voxel-based morphometry-the methods. Neuroimage. 2000;11(6):805–821. doi: 10.1006/nimg.2000.0582. [DOI] [PubMed] [Google Scholar]
- Ashburner J, Friston KJ. Why voxel-based morphometry should be used. NeuroImage. 2001;14(6):1238–1243. doi: 10.1006/nimg.2001.0961. [DOI] [PubMed] [Google Scholar]
- Ashburner J, Hutton C, Frackowiak R, Johnsrude I, Price C, Friston K. Identifying global anatomical differences: deformation-based morphometry. Hum Brain Mapp. 1998 Jan;6:5–6. 348–357. doi: 10.1002/(SICI)1097-0193(1998)6:5/6<348::AID-HBM4>3.0.CO;2-P. [DOI] [PMC free article] [PubMed] [Google Scholar]
- Benjamini Y, Hochberg Y. Controlling the false discovery rate: a practical and powerful approach to multiple testing. J R Stat Soc Ser B Methodol. 1995:289–300. [Google Scholar]
- Bernal-Rusiel JL, Reuter M, Greve DN, Fischl B, Sabuncu MR, Initiative ADN, et al. Spatiotemporal linear mixed effects modeling for the mass-univariate analysis of longitudinal neuroimage data. NeuroImage. 2013;81:358–370. doi: 10.1016/j.neuroimage.2013.05.049. [DOI] [PMC free article] [PubMed] [Google Scholar]
- Bernasconi N, Duchesne S, Janke A, Lerch J, Collins DL, Bernasconi A. Whole-brain voxel-based statistical analysis of gray matter and white matter in temporal lobe epilepsy. NeuroImage. 2004 Oct;23(2):717–723. doi: 10.1016/j.neuroimage.2004.06.015. [DOI] [PubMed] [Google Scholar]
- Björnsdotter M, Rylander K, Wessberg J. A Monte Carlo method for locally multivariate brain mapping. NeuroImage. 2011;56(2):508–516. doi: 10.1016/j.neuroimage.2010.07.044. [DOI] [PubMed] [Google Scholar]
- Casanova R, Srikanth R, Baer A, Laurienti PJ, Burdette JH, Hayasaka S, Flowers L, Wood F, Maldjian JA. Biological parametric mapping: a statistical toolbox for multimodality brain image analysis. Neuroimage. 2007;34(1):137–143. doi: 10.1016/j.neuroimage.2006.09.011. [DOI] [PMC free article] [PubMed] [Google Scholar]
- Casella G, Berger RL. Statistical Inference. Vol. 2. Duxbury Pacific Grove; CA: 2002. [Google Scholar]
- Chiang MC, Reiss AL, Lee AD, Bellugi U, Galaburda AM, Korenberg JR, Mills DL, Toga AW, Thompson PM. 3D pattern of brain abnormalities in Williams syndrome visualized using tensor-based morphometry. NeuroImage. 2007;36(4):1096–1109. doi: 10.1016/j.neuroimage.2007.04.024. [DOI] [PMC free article] [PubMed] [Google Scholar]
- Chung MK, Worsley KJ, Paus T, Cherif C, Collins DL, Giedd JN, Rapoport JL, Evans AC. A unified statistical approach to deformation-based morphometry. NeuroImage. 2001;14(3):595–606. doi: 10.1006/nimg.2001.0862. [DOI] [PubMed] [Google Scholar]
- Chung MK, Worsley KJ, Robbins S, Paus T, Taylor J, Giedd JN, Rapoport JL, Evans AC. Deformation-based surface morphometry applied to gray matter deformation. NeuroImage. 2003;18(2):198–213. doi: 10.1016/s1053-8119(02)00017-4. [DOI] [PubMed] [Google Scholar]
- Cotter A, Keshet J, Srebro N. Explicit Approximations of the Gaussian Kernel. ArXiv Preprint arXiv. 2011;1109:4603. [Google Scholar]
- Cuingnet R, Rosso C, Chupin M, Lehéricy S, Dormont D, Benali H, Samson Y, Colliot O. Spatial regularization of svm for the detection of diffusion alterations associated with stroke outcome. Med image Anal. 2011;15(5):729–737. doi: 10.1016/j.media.2011.05.007. [DOI] [PubMed] [Google Scholar]
- Davatzikos C, Genc A, Xu D, Resnick SM. Voxel-based morphometry using the RAVENS maps: methods and validation using simulated longitudinal atrophy. NeuroImage. 2001;14(6):1361–1369. doi: 10.1006/nimg.2001.0937. [DOI] [PubMed] [Google Scholar]
- Davatzikos C, Ruparel K, Fan Y, Shen D, Acharyya M, Loughead J, Gur R, Langleben DD. Classifying spatial patterns of brain activity with machine learning methods: application to lie detection. Neuroimage. 2005;28(3):663–668. doi: 10.1016/j.neuroimage.2005.08.009. [DOI] [PubMed] [Google Scholar]
- Doshi J, Erus G, Ou Y, Gaonkar B, Davatzikos C. Multi-atlas skull-stripping. Acad Radiol. 2013;20(12):1566–1576. doi: 10.1016/j.acra.2013.09.010. [DOI] [PMC free article] [PubMed] [Google Scholar]
- Efron B, Tibshirani R. Bootstrap methods for standard errors, confidence intervals, and other measures of statistical accuracy. Stat Sci. 1986;1(1):54–75. [Google Scholar]
- Etzel JA, Zacks JM, Braver TS. Searchlight analysis: promise, pitfalls, and potential. Neuroimage. 2013;78:261–269. doi: 10.1016/j.neuroimage.2013.03.041. [DOI] [PMC free article] [PubMed] [Google Scholar]
- Fleiss JL, Levin B, Paik MC. Statistical Methods for Rates and Proportions. John Wiley & Sons; 2013. [Google Scholar]
- Fox NC, Crum WR, Scahill RI, Stevens JM, Jenssen JC, Rossor MN. Imaging of onset and progression of Alzheimer’s disease with voxel-compression mapping of serial magnetic resonance images. Lancet. 2001;358:201–205. doi: 10.1016/S0140-6736(01)05408-3. [DOI] [PubMed] [Google Scholar]
- Ganz M, Greve DN, Fischl B, Konukoglu E, Initiative ADN, et al. Relevant feature set estimation with a knock-out strategy and random forests. NeuroImage. 2015;122:131–148. doi: 10.1016/j.neuroimage.2015.08.006. [DOI] [PMC free article] [PubMed] [Google Scholar]
- Gaonkar B, Davatzikos C. Analytic estimation of statistical significance maps for support vector machine based multi-variate image analysis and classification. Neuroimage. 2013;78:270–283. doi: 10.1016/j.neuroimage.2013.03.066. [DOI] [PMC free article] [PubMed] [Google Scholar]
- Gaonkar B, Shinohara RT, Davatzikos C, Initiative ADN, et al. Interpreting support vector machine models for multivariate group wise analysis in neuroimaging. Med image Anal. 2015;24(1):190–204. doi: 10.1016/j.media.2015.06.008. [DOI] [PMC free article] [PubMed] [Google Scholar]
- Giuliani NR, Calhoun VD, Pearlson GD, Francis A, Buchanan RW. Voxel-based morphometry versus region of interest: a comparison of two methods for analyzing gray matter differences in schizophrenia. Schizophrenia Res. 2005;74:2–3. 135–147. doi: 10.1016/j.schres.2004.08.019. [DOI] [PubMed] [Google Scholar]
- Goldszal AF, Davatzikos C, Pham DL, Yan MX, Bryan RN, Resnick SM. An image-processing system for qualitative and quantitative volumetric analysis of brain images. J Comput Assisted Tomogr. 1998;22(5):827–837. doi: 10.1097/00004728-199809000-00030. [DOI] [PubMed] [Google Scholar]
- Gönen M, Alpaydın E. Multiple kernel learning algorithms. J Mach Learn Res. 2011 Jul;12:2211–2268. [Google Scholar]
- Guyon I, Weston J, Barnhill S, Vapnik V. Gene selection for cancer classification using support vector machines. Mach Learn. 2002;46(1):389–422. [Google Scholar]
- Haufe S, Meinecke F, Görgen K, Dähne S, Haynes JD, Blankertz B, Bießmann F. On the interpretation of weight vectors of linear models in multivariate neuroimaging. Neuroimage. 2014;87:96–110. doi: 10.1016/j.neuroimage.2013.10.067. [DOI] [PubMed] [Google Scholar]
- Hua X, Leow AD, Parikshak N, Lee S, Chiang MC, Toga AW, Jack CR, Weiner MW, Thompson PM. Tensor-based morphometry as a neuroimaging biomarker for Alzheimer’s disease: an MRI study of 676 AD, MCI, and normal subjects. NeuroImage. 2008;43(3):458–469. doi: 10.1016/j.neuroimage.2008.07.013. [DOI] [PMC free article] [PubMed] [Google Scholar]
- Hubert L, Arabie P. Comparing partitions. J Classif. 1985;2(1):193–218. [Google Scholar]
- Job DE, Whalley HC, Johnstone EC, Lawrie SM. Grey matter changes over time in high risk subjects developing schizophrenia. NeuroImage. 2005;25(4):1023–1030. doi: 10.1016/j.neuroimage.2005.01.006. [DOI] [PubMed] [Google Scholar]
- Job DE, Whalley HC, McConnell S, Glabus M, Johnstone EC, Lawrie SM. Structural gray matter differences between first-episode schizophrenics and normal controls using voxel-based morphometry. NeuroImage. 2002;17(2):880–889. [PubMed] [Google Scholar]
- Jones DK, Symms MR, Cercignani M, Howard RJ. The effect of filter size on VBM analyses of DT-MRI data. NeuroImage. 2005;26(2):546–554. doi: 10.1016/j.neuroimage.2005.02.013. [DOI] [PubMed] [Google Scholar]
- Kabani NJ, MacDonald DJ, Holmes CJ, Evans AC. 3D anatomical atlas of the human brain. NeuroImage. 1998;7(4 PART II):S717. [Google Scholar]
- Kriegeskorte N, Goebel R, Bandettini P. Information-based functional brain mapping. Proc Natl Acad Sci U S A. 2006;103(10):3863–3868. doi: 10.1073/pnas.0600244103. [DOI] [PMC free article] [PubMed] [Google Scholar]
- Kubicki M, Shenton ME, Salisbury DF, Hirayasu Y, Kasai K, Kikinis R, Jolesz FA, McCarley RW. Voxel-based morphometric analysis of gray matter in first episode schizophrenia. NeuroImage. 2002;17(4):1711–1719. doi: 10.1006/nimg.2002.1296. [DOI] [PMC free article] [PubMed] [Google Scholar]
- Langleben DD, Loughead JW, Bilker WB, Ruparel K, Childress AR, Busch SI, Gur RC. Telling truth from lie in individual subjects with fast event-related fmri. Hum Brain Mapp. 2005;26(4):262–272. doi: 10.1002/hbm.20191. [DOI] [PMC free article] [PubMed] [Google Scholar]
- Langs G, Menze BH, Lashkari D, Golland P. Detecting stable distributed patterns of brain activation using Gini contrast. NeuroImage. 2011 May;56(2):497–507. doi: 10.1016/j.neuroimage.2010.07.074. [DOI] [PMC free article] [PubMed] [Google Scholar]
- Ledoit O, Wolf M. Improved estimation of the covariance matrix of stock returns with an application to portfolio selection. J Empir finance. 2003;10(5):603–621. [Google Scholar]
- Lepore N, Brun C, Chou YY, Chiang M-C, Dutton RA, Hayashi KM, Lu A, Lopez OL, Aizenstein HJ, Toga AW, Becker JT, Thompson PM. Generalized tensor-based morphometry of HIV/AIDS using multivariate statistics on strain matrices. IEEE Trans. Medial Imaging. 2006;27(1):129–141. doi: 10.1109/TMI.2007.906091. [DOI] [PMC free article] [PubMed] [Google Scholar]
- Li C, Gore JC, Davatzikos C. Multiplicative intrinsic component optimization (mico) for mri bias field estimation and tissue segmentation. Magn Reson imaging. 2014;32(7):913–923. doi: 10.1016/j.mri.2014.03.010. [DOI] [PMC free article] [PubMed] [Google Scholar]
- Meda SA, Giuliani NR, Calhoun VD, Jagannathan K, Schretlen DJ, Pulver A, Cascella N, Keshavan M, Kates W, Buchanan R, Sharma T, Pearlson GD. A large scale (N = 400) investigation of gray matter differences in schizophrenia using optimized voxel-based morphometry. Schizophrenia Res. 2008;101:1–3. 95–105. doi: 10.1016/j.schres.2008.02.007. [DOI] [PMC free article] [PubMed] [Google Scholar]
- Mohs R. The alzheimer’s disease assessment scale: an instrument for assessing treatment efficacy. Psychopharmacol Bull. 1983;2:448–450. [PubMed] [Google Scholar]
- Mumford JA, Poline JB, Poldrack RA. Orthogonalization of regressors in fmri models. PLoS One. 2015;10(4):e0126255. doi: 10.1371/journal.pone.0126255. [DOI] [PMC free article] [PubMed] [Google Scholar]
- Nichols TE, Holmes AP. Nonparametric permutation tests for functional neuroimaging: a primer with examples. Hum Brain Mapp. 2002;15(1):1–25. doi: 10.1002/hbm.1058. [DOI] [PMC free article] [PubMed] [Google Scholar]
- Olivetti E, Mognon A, Greiner S, Avesani P. Brain decoding: biases in error estimation. In: Decoding, Brain, editors. Pattern Recognition Challenges in Neuroimaging (WBD), 2010 First Workshop on. IEEE; 2010. pp. 40–43. [Google Scholar]
- Ou Y, Sotiras A, Paragios N, Davatzikos C. Dramms: deformable registration via attribute matching and mutual-saliency weighting. Med image Anal. 2011;15(4):622–639. doi: 10.1016/j.media.2010.07.002. [DOI] [PMC free article] [PubMed] [Google Scholar]
- Pereira F, Botvinick M. Information mapping with pattern classifiers: a comparative study. Neuroimage. 2011;56(2):476–496. doi: 10.1016/j.neuroimage.2010.05.026. [DOI] [PMC free article] [PubMed] [Google Scholar]
- Rasmussen PM, Hansen LK, Madsen KH, Churchill NW, Strother SC. Model sparsity and brain pattern interpretation of classification models in neuroimaging. Pattern Recognit. 2012;45(6):2085–2100. [Google Scholar]
- Rondina JM, Hahn T, de Oliveira L, Marquand AF, Dresler T, Leitner T, Fallgatter AJ, Shawe-Taylor J, Mourao-Miranda J. Scors?a method based on stability for feature selection and mapping in neuroimaging. IEEE Trans Med imaging. 2014;33(1):85–98. doi: 10.1109/TMI.2013.2281398. [DOI] [PMC free article] [PubMed] [Google Scholar]
- Shen D, Davatzikos C. Very high-resolution morphometry using mass-preserving deformations and HAMMER elastic registration. NeuroImage. 2003;18(1):28–41. doi: 10.1006/nimg.2002.1301. [DOI] [PubMed] [Google Scholar]
- Sled JG, Zijdenbos AP, Evans AC. A nonparametric method for automatic correction of intensity nonuniformity in mri data. Medical Imaging IEEE Trans. 1998;17(1):87–97. doi: 10.1109/42.668698. [DOI] [PubMed] [Google Scholar]
- Studholme C, Cardenas V, Blumenfeld R, Schuff N, Rosen HJ, Miller B, Weiner M. Deformation tensor morphometry of semantic dementia with quantitative validation. NeuroImage. 2004 May;21(4):1387–1398. doi: 10.1016/j.neuroimage.2003.12.009. [DOI] [PubMed] [Google Scholar]
- Suykens JA, Vandewalle J. Least squares support vector machine classifiers. Neural Process Lett. 1999;9(3):293–300. [Google Scholar]
- Thompson PM, Giedd JN, Woods RP, MacDonald D, Evans AC, Toga AW. Growth patterns in the developing brain detected by using continuum mechanical tensor maps. Nature. 2000;404(6774):190–193. doi: 10.1038/35004593. [DOI] [PubMed] [Google Scholar]
- van de Pol LA, Korf ES, van der Flier WM, Brashear HR, Fox NC, Barkhof F, Scheltens P. Magnetic resonance imaging predictors of cognition in mild cognitive impairment. Archives neurology. 2007;64(7):1023–1028. doi: 10.1001/archneur.64.7.1023. [DOI] [PubMed] [Google Scholar]
- Winkler AM, Ridgway GR, Webster MA, Smith SM, Nichols TE. Permutation inference for the general linear model. Neuroimage. 2014;92:381–397. doi: 10.1016/j.neuroimage.2014.01.060. [DOI] [PMC free article] [PubMed] [Google Scholar]
- Wright I, McGuire P, Poline JB, Travere J, Murray R, Frith C, Frackowiak R, Friston K. A voxel-based method for the statistical analysis of gray and white matter density applied to schizophrenia. NeuroImage. 1995 Dec;2(4):244–252. doi: 10.1006/nimg.1995.1032. [DOI] [PubMed] [Google Scholar]
- Zhang T, Davatzikos C. Odvba: optimally-discriminative voxel-based analysis. IEEE Trans Med imaging. 2011;30(8):1441–1454. doi: 10.1109/TMI.2011.2114362. [DOI] [PMC free article] [PubMed] [Google Scholar]
- Zhang T, Davatzikos C. Optimally-discriminative voxel-based morphometry significantly increases the ability to detect group differences in schizophrenia, mild cognitive impairment, and alzheimer’s disease. Neuroimage. 2013;79:94–110. doi: 10.1016/j.neuroimage.2013.04.063. [DOI] [PMC free article] [PubMed] [Google Scholar]
- Zhang Y, Zou P, Mulhern RK, Butler RW, Laningham FH, Ogg RJ. Brain structural abnormalities in survivors of pediatric posterior fossa brain tumors: a voxel-based morphometry study using free-form deformation. NeuroImage. 2008;42(1):218–229. doi: 10.1016/j.neuroimage.2008.04.181. [DOI] [PMC free article] [PubMed] [Google Scholar]
Associated Data
This section collects any data citations, data availability statements, or supplementary materials included in this article.


