Abstract
Introduction
Hemorrhagic shock leads to systemic oxygen deficit (hypoxaemia) that results in systemic inflammatory response syndrome (SIRS), a recognised cause of late mortality in this case. The aim of this study was to analyse the impact of fluid resuscitation, using two Ringer solutions, on the microcirculation changes that take place during experimentally induced haemorrhagic shock.
Material and methods
A model of the rat cremaster muscle was used to assess microcirculation in vivo. The experimental groups (n = 10 each) included: control (CTRL); shock (HSG); Ringer’s acetate (RAG); and Ringer’s lactate (RLG). Microhaemodynamic parameters were measured during the experiment.
Results
A statistically significantly higher level of leukocytes, both those attached to the endothelium and those located in the extravascular space (p < 0.05), was reported in the lactate Ringer (LR) group compared with the AR group. There were significant differences in the activity of A3 arterioles compared with A1 and A2 arterioles. Ringer’s lactate solution seemed to the inflammation response during fluid resuscitation from haemorrhagic shock. A3 arterioles are likely to play a role as a pre-capillary sphincter in the skeletal muscle.
Conclusions
The present study revealed that fluid resuscitation with Ringer’s lactate solution exacerbates inflammation in the skeletal muscle. It is worth noting that Ringer’s acetate solution reduces local inflammation and could therefore be recommended as the “first line” crystalloid of the fluid resuscitation during haemorrhagic shock.
Keywords: haemorrhagic shock, fluid resuscitation, Ringer’s lactate solution, rat
Introduction
Hemorrhagicshock leads to systemic oxygen deficit (hypoxaemia) that results in systemic inflammatory response syndrome (SIRS), a recognised cause of late mortality in this case [1, 2]. Though hypoxia results in primary tissue damage caused by cellular energy depletion, the treatment of shock also brings about many adverse effects. Reperfusion and reoxygenation contribute to tissue damage through the chaotic formation of reactive oxygen species, release of proinflammatory mediators (TNF, interleukins, leukotrienes) and the activation of circulating leukocytes (PMN) [3–5]. Therapy of shock aims to restore an sufficient oxygen supply, adequate to the needs of tissue metabolism and the protection of endothelium against ischaemia and reperfusion injury [6, 7]. This goal can be achieved through the implementation of fluid therapy. However, the type of fluid used in the initial phase of resuscitation may also be important [8–10]. Lactate and acetate Ringer solutions are commonly used intravenous crystalloids. According to the available data, lactated Ringer’s solution reduces the risk of hyperchloraemic acidosis and mortality after massive and uncontrolled bleeding as compared to 0.9% sodium chloride solution [11–13]. However, studies investigating fluid therapy in experimentally induced haemorrhagic shock showed that transfusion of Ringer’s lactate solution increased activation of circulating leukocytes (PMN)a [14–16]. To the best of our knowledge there are no reports of Ringer’s acetate solution having similar properties.
The aim of the study was to analyse the impact of fluid resuscitation, using two different Ringer solutions (lactate vs. acetate), on the changes that take place in the haemodynamics of the microcirculation of a free muscle flap in vivo during experimentally induced haemorrhagic shock.
Material and methods
This study was approved by the Animal Research Committee of the Cleveland Clinic Foundation (Cleveland, Ohio, USA). All animals used in this study received humane care in compliance with the Guide for the Care and Use of Laboratory Animals published by the National Institute of Health. The Cleveland Clinic Foundation’s Animal Care facility is accredited by the American Association for the Accreditation of Laboratory Animal Care (AAALAC). Animals used in the experimental design were caged in pairs and had free access to food and water 3 h before experiments. Animals were kept in cages at room temperature of 22°C in the day/night cycle.
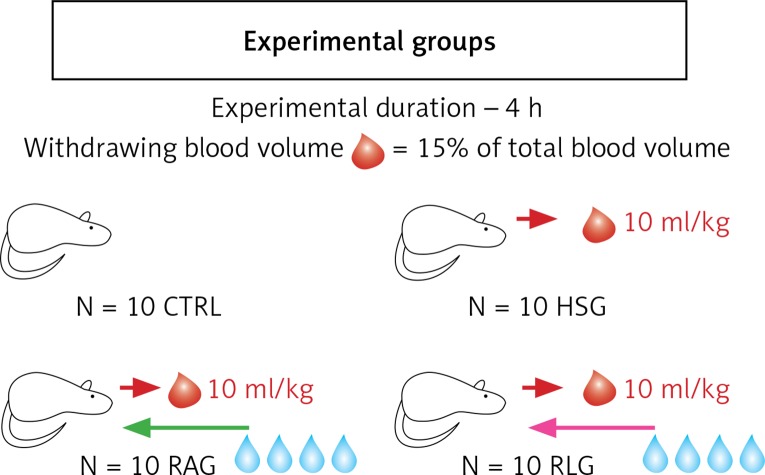
This study included 40 male inbred Lewis rats weighing 100 to 150 g. Animals were randomized to the following four groups of 10 each (Figure 1):
Figure 1.
Diagram showing four experimental groups (CTRL, HSG, RAG, RLG) of 10 animals each. Red arrows show collected blood volume of 10 ml/kg during induction of haemorrhagic shock. The green arrow shows the Ringer’s acetate solution infusion to RAG group animals in a volume of 40 ml/kg, during resuscitation of haemorrhagic shock. Pink arrow shows in analogy to the previous group, infusion of Ringer’s lactate solution in RLG in a volume of 40 ml/kg (description in text)
Control group (CTRL) – only baseline measurements of macro and micro haemodynamics were assessed during 4 h;
Haemorrhagic shock group (HSG) – haemorrhagic shock was induced, but fluid therapy was not delivered;
Ringer’s acetate solution group (RAG) – haemorrhagic shock was induced, followed by fluid resuscitation using Ringer’s acetate solution;
Ringer’s lactate solution group (RLG) – haemorrhagic shock was induced followed by fluid resuscitation using Ringer’s lactate solution.
For induction of anaesthesia administered intraperitoneally a single dose of a solution of 60 mg/kg ketamine, 6 mg/kg xylazine and 1 mg/kg acepromazine was given. Then, continuous infusion was administered into the femoral vein, respectively: 10 mg/kg/h of ketamine, 2 mg/kg/h of xylazine, and 0.33 mg/kg/h of acepromazine [17–25].
Before the cremaster muscle flap was dissected, the left femoral vein, and left femoral artery were isolated and catheterized. The cannulated femoral artery was used to measure MAP and for blood sampling during the induction of haemorrhagic shock, while the cannulated femoral vein was used to measure CVP, and the injection of anaesthetics and Ringer’s solutions.
The denervated cremaster muscle was dissected according to the available references and established procedures in our Microsurgery Laboratory at Cleveland Clinic [26–35].
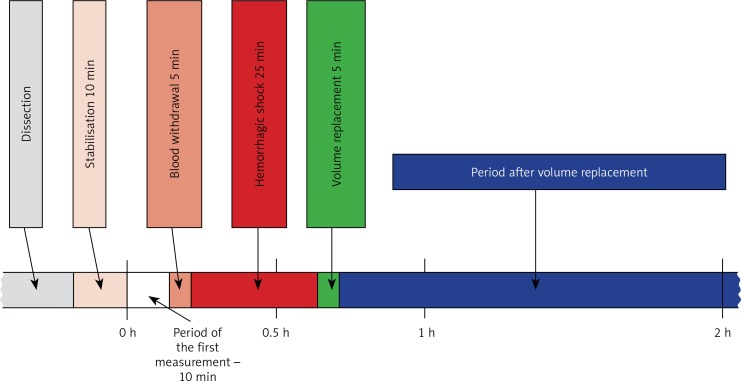
Shock was induced (only in groups HSG, RAG, RLG) by withdrawing 15% of the total calculated circulating blood volume (10 ml/kg), which correlated with a decrease in mean arterial pressure (MAP) from 80 mm Hg to ≤ 50 mm Hg. Blood was collected over a 5-minute period. The predetermined level of MAP was maintained for 25 min (groups RAG and RLG) (Figure 2).
Figure 2.
Illustration of the experimental protocol # ARC 08343, approved by the Institutional Animal Care and Use Committee, Cleveland Clinic, USA
The administration of 40 ml/kg of Ringer’s solutions was done during a 5-minute period.
All surgical procedures, as well as cannulation of major vessels, were carried out using an operating microscope (Zeiss OPM6-SD, Zeiss, Germany).
Direct assessment of in vivo measured parameters
The initial measurement was performed 30 min after completion of surgical procedures to determine the baseline values, measured for each experimental group. For HSG, RAG and RLG, the second measurement was performed 15 min after induction of shock (0.5 h from the first measurement). In the case of the RAG and RLG, a third measurement was performed 15 min after fluid resuscitation (1 h after the first measurement). Subsequent measurements were performed at 1-hour intervals. Total time of haemodynamic recordings was 4 h.
Red blood cell velocity
Measurements of red blood cell (RBC) velocities were recorded using an optical Doppler velocimeter (Texas A&M University, Galveston, TX). The video camera was attached to the intravital microscope, which transferred the signal from the vessels to the velocimeter.
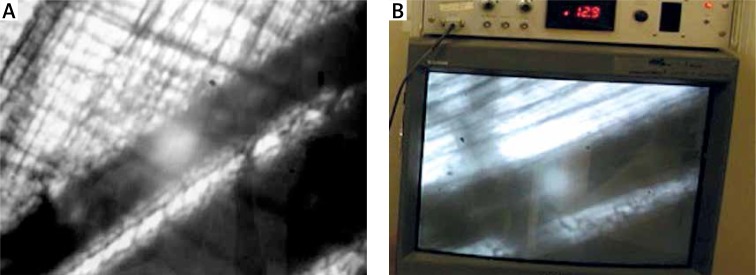
Video scans included the major first-order arteriole (A1), two selected second-order arterioles (A2), and two selected third-order arterioles (A3). The RBC velocity values were shown in millimetres per second on the display screen of the velocimeter (Figures 3 A, B).
Figure 3.
A – Measurement of red blood cell velocity. On the picture are visualized capillaries running in the vicinity of two blood vessels (arterial and venous). Examined arterial vessel was marked using an optical pointer (white point). Visibly on the monitor, pulsed flow (characteristic for the artery) was accompanied by an oscillating acoustic effect of high frequency. B – Monitor connected to the Optical Doppler Velocimeter device. The red blood cell velocity (RBC) measurements of the arterioles were displayed on the monitor of the measuring device (Optical Doppler velocimeter, Texas A & M University, Glaveston, TX) in mm/s
Vascular diameters
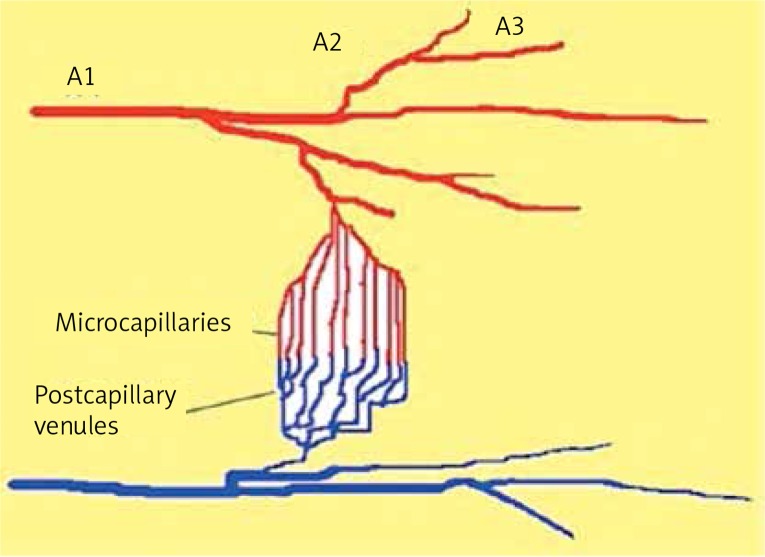
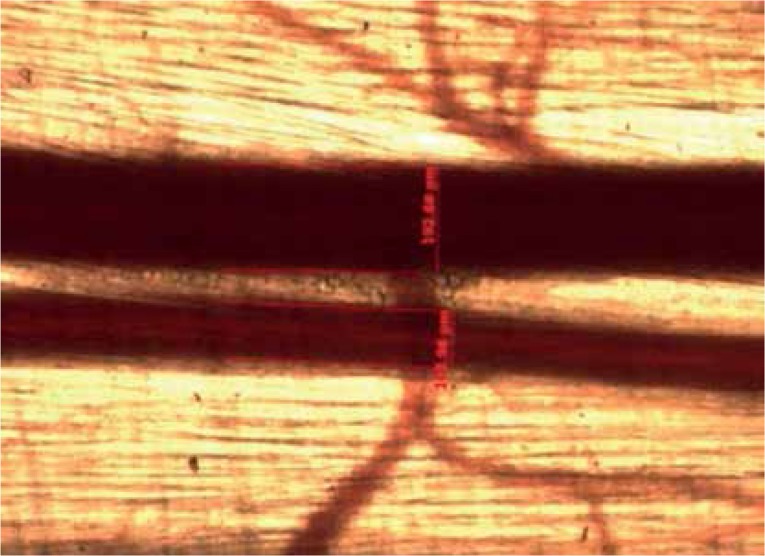
In each step, the diameter measurements of arterioles were taken in the same segmental branch order using a video image measurement and marking system (Carl Zeiss Axiocam MR and Axio Vision software Rel.4.6, Carl Zeiss, Goettigen, Germany). The diameter measurements included A1, A2, and A3, as well as post-capillary venules (Figures 4, 5).
Figure 4.
Diagram showing the areas of cremaster muscle microcirculation which were analysed in the experimental study. A1, A2, A3 arterioles – vessel diameters, and red blood cell velocity of the arterioles were measured; capillaries – the number of perfused capillary vessels were studied in the power field of view (FCP); post-capillary venule-neutrophil-endothelial interactions and vascular permeability (PI) were measured (description in text)
Figure 5.
Measurements of blood vessel diameters. Blood vessels of cremaster muscle appear on the Axiocam MR measurement system screen: venous (V1) (measurements were not analysed in the experiment), and arterial (A1). Results of blood vessel measurements were presented on the screen in a numerical value in μm
Functional capillary perfusion
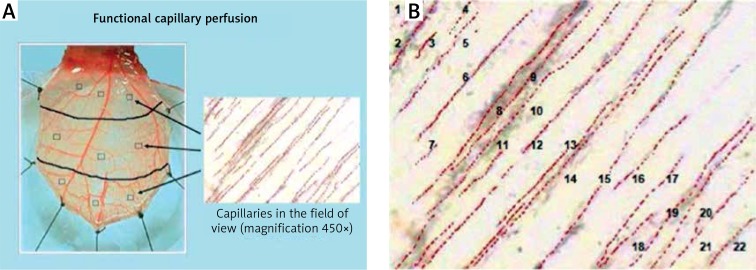
The number of capillaries with clear flow within the lumen was counted at 3 visual fields within each of the proximal, middle and distal region adjacent to the randomly selected post-capillary venule and represented the number of capillaries per high power field (c/hpf). The numbers were averaged over the total of 9 fields for the cremaster muscle at each scheduled observation time. During the first measurements, a map was drawn of the selected regions, so the measurements were carried out within the same regions in each step of the experiment. The average number of capillaries per area served as a parameter of functional capillary perfusion (FCP) (Figures 6 A, B).
Figure 6.
A – Measurement of FCP. The number of capillaries with undisturbed flow within the lumen was counted in the selected fields of the muscle; the three fields in proximal, middle and distal parts of the muscle adjacent to randomly selected post‑capillary venules were chosen. B – In this field of view, 22 perfused capillaries are identified. Erythrocytes are visible in the lumen of the capillary vessels subjected to flow
Leukocyte endothelial interactions
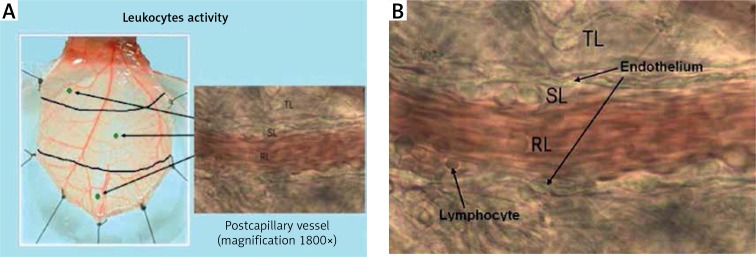
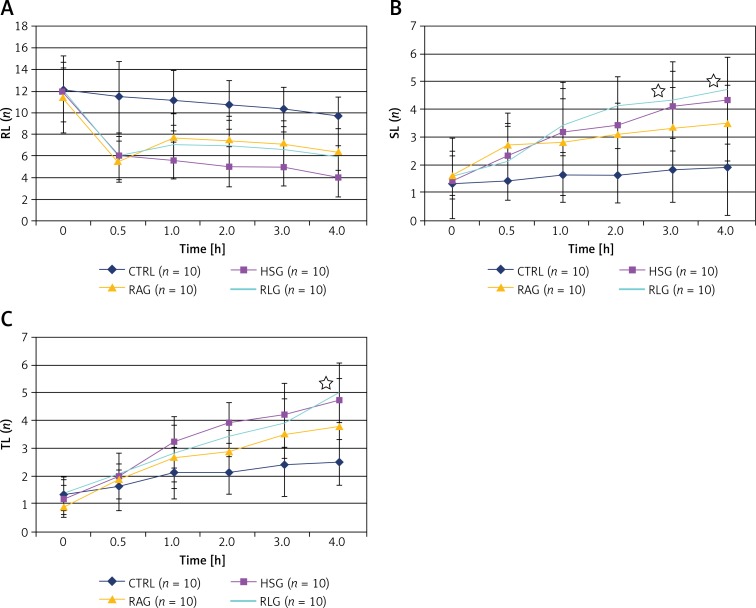
Leukocyte behaviour was evaluated in randomly selected post-capillary venules in the proximal, middle, and distal regions of the cremaster flap. The number of leukocytes flowing freely through the vessel (rolling leukocytes – RL), attached to the vascular endothelium for longer than 20 s (sticking leukocytes – SL), and located in the extravascular space (transmigrating leukocytes – TL) was recorded during an interval of 2 min/region using a manual counter. The same vessel was assessed for each evaluation according to the map that outlined the selected regions (Figures 7 A, B).
Figure 7.
A – Evaluation of leukocyte activation. The behaviour of the leukocytes was assessed in one randomly selected post‑capillary venule in each of the proximal, middle and distal region of the cremaster muscle. B – Assessment of leukocytes’ presence in the post‑capillary venule (magnification 1800×). In the course of the experimental design measurements of the leukocytes were taken including: the number of leukocytes moving freely through the vessel (RL), the number of leukocytes attached to the vascular endothelium for more than 20 s (SL), and the number of leukocytes located in the extravascular space (TL)
Endothelial permeability
After selection of the post-capillary venule with diameter ranging between 20 μm and 35 μm, fluorescein isothiocyanate-conjugated (FITC) albumin (0.2 ml per 100 g body weight) was injected into the femoral vein. Observations were made using a Zeiss 20T fluorescence microscope. FITC-albumin was stimulated with an incident-light illumination system with a 460 to 490-nm blue light band excitation filter from a mercury arc lamp (Mercury Power Supply, model 1200; OptiQuip, New York, NY). The closed-circuit video recording system consisted of an AxioCam MRm camera (AxioCam MRm; Zeiss, Germany).
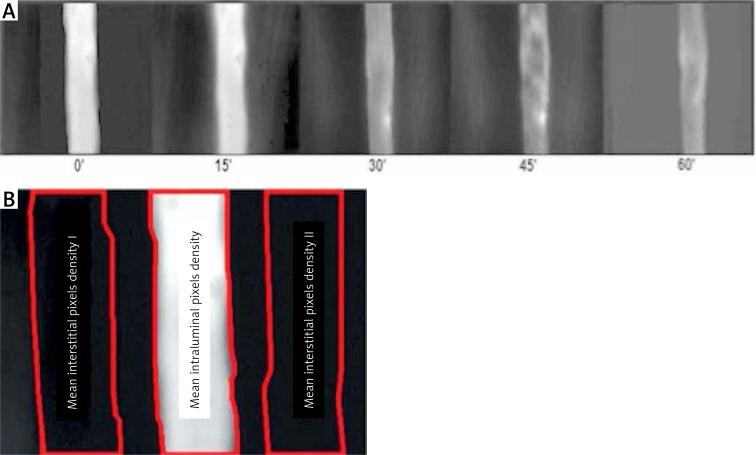
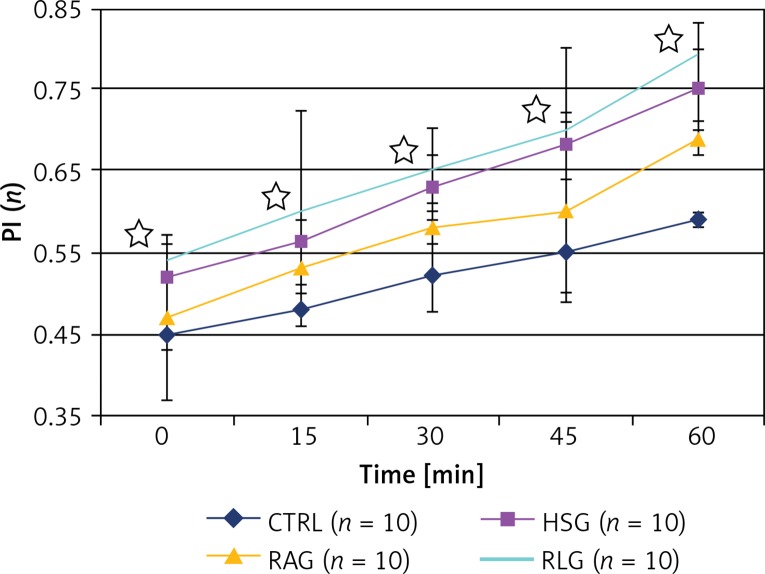
The injected FITC-albumin appears as a white column against a black background in the venule. Fluorescent dye leaks appear as white streaks outside the vessel lumen. The live images of permeability were captured by the computer, and then analysed with Image PRO-Plus software (version 2.1; Media Cybernetics, Silver Spring, MD). The venule lumen was first outlined, and was considered as the intravascular space (IVS). Next, lines were drawn outside the vessel lumen and along the vessel length on both sites, and were labelled and assessed as the interstitial spaces (ISS). The optical density of the average ISS was divided by the IVS density to calculate the permeability index (PI) (Figures 8 A, B).
Figure 8.
A – Fluorescence microscopy. FITC-albumin molecules are visible in the post‑capillary vessel lumen as the white column. Transition of FITC-labelled albumin from the lumen into the extravascular space is visible as white streaks on both sides of the post‑capillary venule lumen. Images were taken at 15-minute intervals at the 5th h of the experiment. 0’ – photo taken immediately after injection of FITC-albumin, 15’, 30’, 60’ – pictures taken respectively at 15, 30, 45, and 60 min after injection of FITC-labelled albumin. B – Images of post‑capillary venules collected during the fluorescence microscopy were analysed using Image Pro-Plus software. The area of bright vessel’s part was outlined and then analysed as the intravascular space (IVS). On both sides of the post‑capillary venule similar in size and shaped areas of the extravascular space (ISS) were outlined. Average optical density of the analysed areas was calculated, and then the ISS to IVS ratio was calculated as the endothelial permeability index (PI)
Tissue oxygenation
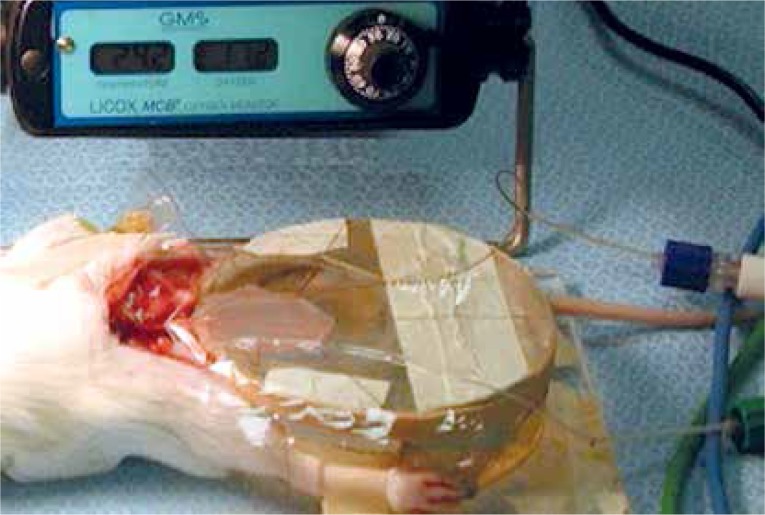
Tissue oxygenation (PtiO2, mm Hg) was measured using an oxygen microprobe catheter (diameter, 0.8 mm; length, 330 mm; pO2-sensitive area, 10 mm2) (Licox, Integra, NJ). The oxygen microprobe was placed underneath the dissected flap and completely covered by Saran wrap. The flaps were continuously measured throughout the observations (Figure 9).
Figure 9.
Measurement of tissue oxygenation. Figure shows the dissected rat cremaster muscle, spread on the plexiglass chamber. The oxygen micro sensor Licox measuring device (Integra, NJ) was placed underneath the muscle
Body temperature
The core body temperature (T) was measured using a thermocouple thermometer (model 819; TEGAM, USA) placed in the oesophagus, and maintained at 36.5 ±0.5°C using a heat lamp.
Blood sampling parameters
Samples from each animal in HSG, RAG and RLG groups were collected during the induction of shock (time point 0.5 h) and 5 h later in all experimental groups (CTRL, HSG, RAG, RLG). The following parameters were assessed: haemoglobin (Hb, g/l), haematocrit (Ht, %), oxygen pressure (PaO2, mm Hg), carbon dioxide pressure (PaCO2, mm Hg), pH, plasma lactate (Lac, mmol/l).
Euthanasia procedure
After completion of microcirculatory measurements, animals were euthanized with injection of pentobarbital (Nembutal) 100 mg/kg into the femoral vein.
Statistical analysis
The mean values and standard deviations of the parameters under consideration were calculated. Owing to the fact that the required conditions for the use of the parametric Student’s t-test (normal and equal variance distributions) were not met in many cases, the samples were compared by applying the Mann-Whitney nonparametric rank-sum test. The level of significance p = 0.05 was accepted as reliable to verify the hypotheses. The calculations were performed using the software package Statistica 5.1, produced by StatSoft.
Results
Haemodynamic parameters
The baseline MAP of animals in the groups studied was similar, ranging between 80.7 and 81.3 mm Hg, with no statistically significant differences between groups (p > 0.05).
Animals of HSG, RAG and RLG groups, undergoing haemorrhagic shock induction, presented a significant reduction in MAP under 50 mm Hg, with no statistically significant differences between these groups (p > 0.05). After fluid resuscitation, the level of MAP within RAG and RLG groups rapidly reached values significantly exceeding baseline values (118.5 and 120.9 mm Hg respectively), but during the next 3 h MAP quoted for RAG and RLG groups declined to mean values of 59.9 and 58.9 mm Hg respectively. These former values were significantly higher compared with HSG (40.5 mm Hg, p < 0.05).
Red blood cell velocity
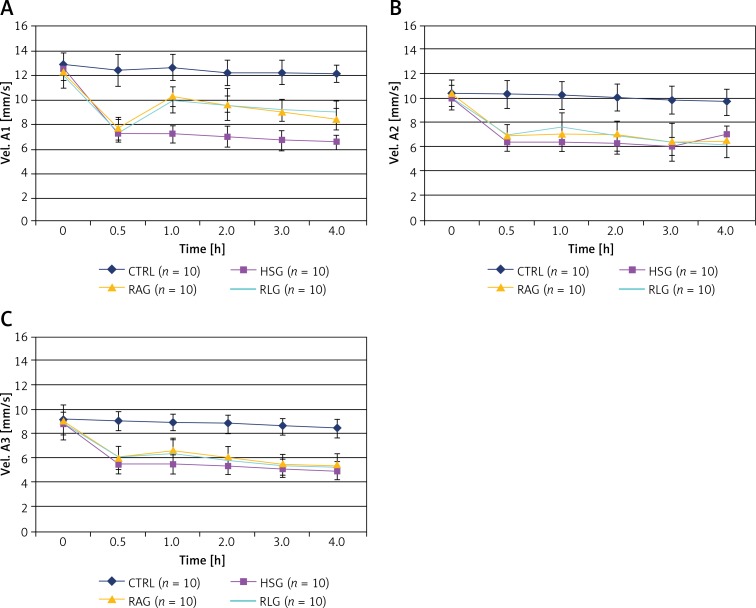
Red blood cell velocities in all arteries (A1, A2, A3) measured for RAG and RLG groups were significantly higher in comparison with HSG (p < 0.001), but also significantly lower when compared to CTRL (p < 0.001). There were no statistically significant differences between RAG and RLG groups during the 4 h of the experiment (Figures 10 A–C, Tables I A–C).
Figure 10.
A – Comparison of measurements of red blood cell velocity in A1 (Vel A1) arterioles within the studied experimental groups (CTRL, HSG, RAG, RLG). B – Comparison of measurements of red blood cell velocity in A2 (Vel A2) arterioles within the studied experimental groups (CTRL, HSG, RAG, RLG). C – Comparison of measurements of red blood cell velocity in A3 (Vel A3) arterioles within the studied experimental groups (CTRL, HSG, RAG, RLG)
Table I.
A–C. Comparison of red blood cell (RBC) velocity values over 4 hours recordings within the A1, A2, and A3 arterioles of the creamster muscle
| A | |||||||||||
|---|---|---|---|---|---|---|---|---|---|---|---|
| Measurement | Mean ± SD | P-values | |||||||||
| Time[h] | CTRL | HSG | RAG | RLG | CTRL vs. HSG | CTRL vs. RAG | CTRL vs. RLG | HS vs. RAG | HS vs. RLG | RAG vs. RLG | |
| Vel. A1 [mm/s] |
0 | 12.91 ±0.99 | 12.38 ±0.78 | 12.22 ±0.60 | 11.95 ±0.90 | 0.08 | 0.06 | 0.08 | 0.97 | 0.12 | 0.17 |
| 0.5 | 12.45 ±1.29 | 7.30 ±0.66 | 7.68 ±0.92 | 7.53 ±0.89 | < 0.0001 | < 0.0001 | < 0.0001 | 0.31 | 0.39 | 0.39 | |
| 1 | 12.66 ±1.06 | 7.22 ±0.66 | 10.28 ±0.80 | 10.03 ±1.05 | < 0.0001 | < 0.0001 | < 0.0001 | < 0.0001 | < 0.0001 | 0.74 | |
| 2 | 12.26 ±1.05 | 7.02 ±0.86 | 9.65 ±1.31 | 9.70 ±0.69 | < 0.0001 | < 0.0002 | < 0.0001 | < 0.0008 | < 0.0001 | 0.74 | |
| 3 | 12.28 ±0.97 | 6.71 ±0.78 | 9.06 ±0.93 | 9.19 ±0.87 | < 0.0001 | < 0.0001 | < 0.0001 | < 0.0002 | < 0.0001 | 0.79 | |
| 4 | 12.17 ±0.70 | 6.56 ±0.61 | 8.44 ±0.90 | 9.08 ±0.78 | < 0.0001 | < 0.0001 | < 0.0001 | < 0.0001 | < 0.0001 | 0.14 | |
| B | |||||||||||
| Measurement | Mean ± SD | P-values | |||||||||
|
Time
[h] |
CTRL | HSG | RAG | RLG | CTRL vs. HSG | CTRL vs. RAG | CTRL vs. RLG | HS vs. RAG | HS vs. RLG | RAG vs. RLG | |
| Vel. A2 [mm/s] |
0 | 10.37 ±1.07 |
9.97 ±0.98 |
10.40 ±0.62 |
10.00 ±1.03 |
0.20 | 0.87 | 0.17 | 0.08 | 0.88 | 0.07 |
| 0.5 | 10.25 ±1.17 | 6.30 ±0.75 | 6.94 ±0.64 | 6.90 ±0.92 | < 0.0001 | < 0.0001 | < 0.0001 | 0.008 | < 0.03 | 0.87 | |
| 1 | 10.17 ±1.16 | 6.30 ±0.77 | 7.05 ±0.60 | 7.50 ±1.26 | < 0.0001 | < 0.0001 | < 0.0001 | < 0.0009 | 0.001 | < 0.03 | |
| 2 | 10.00 ±1.12 | 6.11 ±0.76 | 7.01 ±0.45 | 6.80 ±1.25 |
< 0.0001 | < 0.0001 | < 0.0001 | < 0.002 | 0.10 | 0.03 | |
| 3 | 9.81±1.17 | 5.97 ±0.74 | 6.44 ±0.48 | 6.30 ±1.56 |
< 0.0001 | < 0.0001 | < 0.0001 | 0.001 | 0.19 | 0.78 | |
| 4 | 9.63 ±1.11 | 6.91 ±0.76 | 6.30 ±0.48 | 6.00 ±0.96 | < 0.0001 | < 0.0001 | < 0.0001 | 0.054 | 0.83 | 0.07 | |
| C | |||||||||||
| Measurement | Mean ± SD | P-values | |||||||||
|
Time
[h] |
CTRL | HSG | RAG | RLG | CTRL vs. HSG | CTRL vs. RAG | CTRL vs. RLG | HS vs. RAG | HS vs. RLG | RAG vs. RLG | |
| Vel. A3 [mm/s] |
0 | 9.16 ±1.07 | 8.87 ±1.19 | 9.13 ±1.21 | 8.65 ±1.11 | 0.67 | 0.25 | 0.06 | 0.24 | 0.08 | 0.09 |
| 0.5 | 9.05 ±1.10 |
5.46 ±0.75 | 6.08 ±0.82 | 6.00 ±1.00 | < 0.0001 | < 0.0001 | < 0.0001 | 0.08 | 0.07 | 0.82 | |
| 1 | 8.94 ±1.19 | 5.44 ±0.66 | 6.60 ±0.93 | 6.40 ±1.24 | < 0.0001 | < 0.0001 | < 0.0001 | 0.003 | < 0.02 | 0.73 | |
| 2 | 8.83 ±0.99 | 5.32 ±0.73 | 6.00 ±0.90 | 5.81 ±1.14 | < 0.0001 | < 0.0001 | < 0.0001 | < 0.004 | 0.13 | 0.43 | |
| 3 | 8.62 ±0.96 | 5.16 ±0.67 | 5.40 ±0.89 | 5.30 ±0.98 | < 0.0001 | < 0.0001 | < 0.0001 | 0.42 | 0.87 | 0.55 | |
| 4 | 8.43 ±0.92 | 4.96 ±0.76 | 5.30 ±1.08 | 5.00 ±1.02 | < 0.0001 | < 0.0001 | < 0.0001 | 0.22 | 0.94 | 0.32 | |
Statistically significant differences (p < 0.05) between the groups are shown in grey.
Vessel diameters
After blood withdrawal, HSG, RAG and RLG groups had a statistically significant reduction in arteriolar diameter of A1 and A2, compared with the control group (p < 0.001). There were no statistically significant differences in A1 diameter values between HSG, RAG and RLG groups (p > 0.05).
However, significantly higher values of A2 diameter were found when RAG values were compared with the HSG group during the 2nd h of the experiment (p < 0.002). No significant differences were found in changes of A2 diameter values between RAG and RLG, or between RLG and HSG, during the entire experimental period (p > 0.05).
No significant differences were found in the values of A3 diameters among the experimental groups throughout most of the duration of the experiment (p > 0.05). The exception was a significantly greater A3 diameter in the CTRL group compared with the HSG group at 30 min, and a significantly greater A3 diameter in the RLG group in comparison with the HSG group during the 3rd h of the experiment.
Blood flow
Blood flow (Q) was calculated from the average values of red blood cell velocity (RBC velocity) and vascular diameter (DIAM), using the following formula: Q = RBC velocity × (DIAM/2)²) × 3.14159 [28, 35].
The results are presented in Tables II A–C and Figures 11 A–C.
Table II.
A–C. Comparison of blood flow QA1, QA2 and QA3 values, calculated for the respective A1, A2 and A3 arterioles
| A | ||||||||||||
|---|---|---|---|---|---|---|---|---|---|---|---|---|
| Measurement | Mean ± SD | P-values | ||||||||||
| Time[h] | CTRL | HSG | RAG | RLG | CTRL vs. HSG | CTRL vs. RAG | CTRL vs. RLG | HS G vs. RAG | HS G vs. RLG | RAG vs. RLG | ||
| Q A1 [× 10–12 m3/s] |
0 | 428 ±2 8.1 |
393 ±27.5 |
424 ±26.9 |
410 ±28.9 | 0.96 | 0.41 | 0.51 | 0.32 | 0.41 | 0.78 | |
| 0.5 | 405 ±27.6 |
124 ±31.0 |
129 ±31.4 |
136 ±32.6 | < 0.001 | 0.002 | < 0.001 | 0.18 | 0.26 | 0.72 | ||
| 1 | 408 ±27.0 |
112 ±31.4 |
215 ±29.4 | 202 ±30.9 | < 0.001 | < 0.001 | < 0.001 | 0.004 | 0.005 | 0.98 | ||
| 2 | 389 ±25.9 |
102 ±29.2 |
168 ±32.8 | 160 ±32.6 | < 0.001 | < 0.001 | < 0.001 | 0.024 | 0.011 | 0.87 | ||
| 3 | 390 ±26.0 |
95 ±32.1 |
158 ±33.3 | 153 ±30.5 | < 0.001 | < 0.001 | < 0.001 | 0.012 | 0.011 | 0.80 | ||
| 4 | 376 ±26.0 |
91 ±33.2 |
138 ±33.8 | 137 ±34.3 | < 0.001 | < 0.001 | < 0.001 | 0.011 | 0.024 | 0.57 | ||
| B | ||||||||||||
| Measurement | Mean ± SD | P-values | ||||||||||
|
Time
[h] |
CTRL | HSG | RAG | RLG | CTRL vs. HSG | CTRL vs. RAG | CTRL vs. RLG | HS G vs. RAG | HS G vs. RLG | RAG vs. RLG | ||
| Q A2 [× 10–12 m3/s] |
0 | 223 ±16.4 |
247 ±17.5 |
241 ±18.4 | 224 ±19.6 | 0.045 | 0.063 | 0.31 | 0.77 | 0.40 | 0.35 | |
| 0.5 | 215 ±19.4 |
79 ±16.2 |
86 ±17.7 | 92 ±17.6 | < 0.001 | < 0.001 | < 0.001 | 0.71 | 0.38 | 0.30 | ||
| 1 | 213 ±20.3 |
73 ±18.4 | 103 ±19.5 |
103 ±20.6 | < 0.001 | < 0.001 | < 0.001 | 0.003 | 0.032 | 0.33 | ||
| 2 | 203 ±19.1 |
64 ±17.2 | 94 ±20.2 | 86 ±20.5 | < 0.001 | < 0.001 | < 0.001 | 0.005 | 0.030 | 0.45 | ||
| 3 | 199 ±19.1 |
63 ±17.2 |
84 ±19.3 |
77 ±20.7 | < 0.001 | < 0.001 | < 0.001 | 0.005 | 0.027 | 0.45 | ||
| 4 | 190 ±20.0 | 60 ±16.2 | 79 ±21.5 | 70 ±20.0 | < 0.001 | < 0.001 | < 0.001 | 0.004 | 0.024 | 0.44 | ||
| C | ||||||||||||
| Measurement | Mean ± SD | P-values | ||||||||||
|
Time
[h] |
CTRL | HSG | RAG | RLG | CTRL vs. HSG | CTRL vs. RAG | CTRL vs. RLG | HS G vs. RAG | HS G vs. RLG | RAG vs. RLG | ||
| Q A3 [× 10–12 m3/s] |
0 | 88 ±8.01 | 88 ±7.67 | 95 ±11.4 | 92 ±10.7 | 0.91 | 0.40 | 0.54 | 0.34 | 0.47 | 0.87 | |
| 0.5 | 87 ±7.80 | 46 ±5.96 | 54 ±5.80 | 55 ±6.87 | < 0.001 | 0.010 | 0.001 | 0.29 | 0.80 | 0.53 | ||
| 1 | 85 ±96.66 | 44 ±6.99 | 64 ±9.27 | 64 ±9.74 | < 0.001 | 0.046 | 0.040 | < 0.001 | 0.005 | 0.73 | ||
| 2 | 83 ±7.46 | 43 ±6.98 | 58 ±9.17 | 57 ±9.63 | < 0.001 | 0.035 | 0.038 | 0.002 | 0.007 | 0.80 | ||
| 3 | 80 ±7.39 | 41 ±6.94 | 52 ±9.08 | 51 ±10.5 | < 0.001 | 0.045 | 0.030 | 0.080 | 0.078 | 0.88 | ||
| 4 | 79 ±7.38 | 39 ±7.93 | 50 ±9.16 | 48 ±11.5 | < 0.001 | 0.038 | 0.025 | 0.23 | 0.15 | 0.91 | ||
Statistically significant differences (p < 0.05) between the groups are shown in grey.
Figure 11.
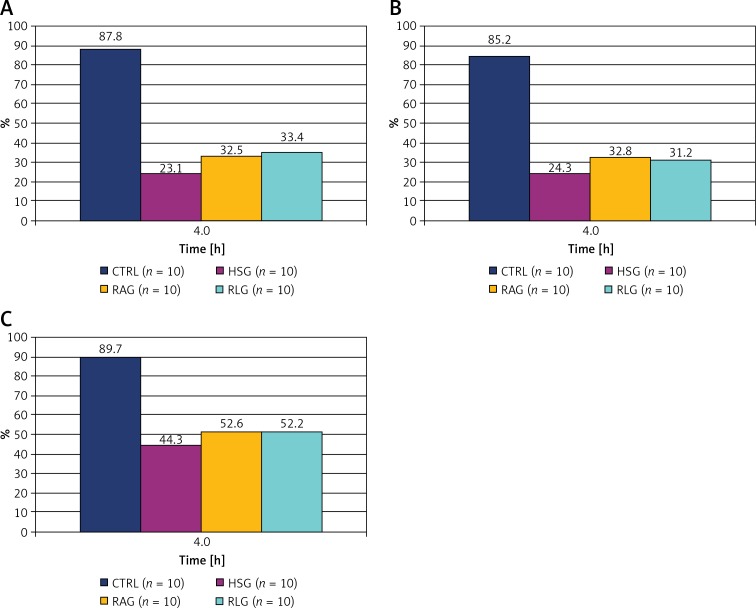
Percentage change in flows value in the fourth hour of the experiment, for A1 arterioles (A), A2 arterioles (B) and A3 arterioles (C) respectively. The 100% values were assumed the baseline flow at the beginning of the experiment (time “0”) within each group
Functional capillary perfusion
Starting at 30 min of the experiment the values of FCP within the CTRL group were significantly higher than values measured in HSG, RAG and RLG groups (p < 0.05).
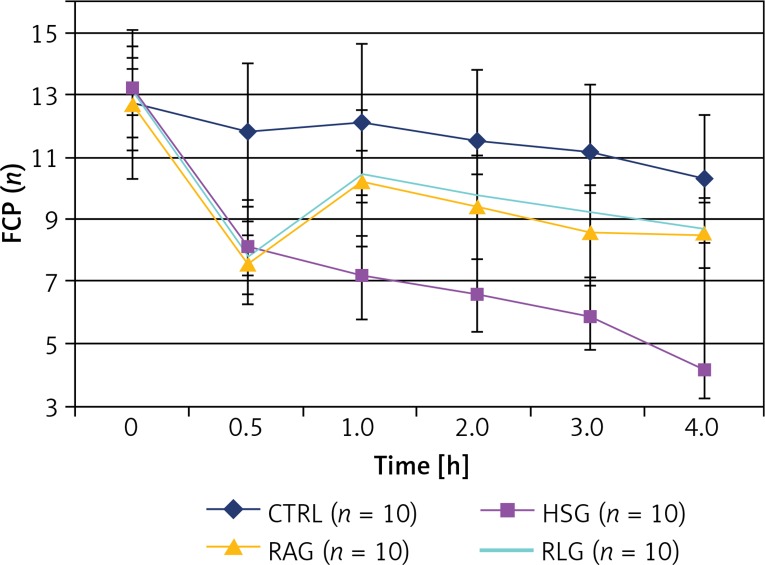
The FCP parameter was significantly higher in the RAG and RLG group compared with the HSG group measured between the 1st and 4th h of the experiment (p ≤ 0.001).
After fluid administration (time 1) in RAG and RLG groups, some capillaries remained open, while in the HSG group their number decreased gradually. In the 4th h of the experiment, in the case of RAG and RLG groups, the FCP values had partially recovered, reaching 66% of the basal value compared to 33% in the HSG group. There was no significant difference between RAG and RLG groups (p > 0.05) (Table III, Figure 12).
Table III.
Comparison the FCP (functional capillary perfusion) values within the studied experimental groups over the period of 4 h measurements of the microcirculation
| Measurement | Mean ± SD | P-values | |||||||||
|---|---|---|---|---|---|---|---|---|---|---|---|
| Time[h] | CTRL | HSG | RAG | RLG | CTRL vs. HSG | CTRL vs. RAG | CTRL vs. RLG | HSG vs. RAG | HSG vs. RLG | RAG vs. RLG | |
| FCP | 0 | 12.70 ±2.36 | 13.10 ±1.45 | 12.70 ±1.49 | 13.10 ±0.74 | 0.85 | 0.68 | 0.74 | 0.53 | 0.85 | 0.35 |
| 0.5 | 11.80 ±2.20 | 8.00 ±1.41 | 7.60 ±1.35 | 7.80 ±0.63 | 0.001 | 0.0003 | 0.0001 | 0.53 | 0.63 | 0.97 | |
| 1 | 12.10 ±2.56 | 7.10 ±1.37 | 10.30 ±2.16 | 10.50 ±0.71 | < 0.0005 | < 0.05 | < 0.02 | 0.001 | < 0.0001 | 0.63 | |
| 2 | 11.50 ±2.27 | 6.50 ±1.18 | 9.40 ±1.65 | 9.80 ±0.63 | 0.0002 | < 0.009 | 0.02 | 0.001 | < 0.0001 | 0.97 | |
| 3 | 11.10 ±2.23 | 5.80 ±1.03 | 8.60 ±1.51 | 9.20 ±0.63 | < 0.0001 | < 0.02 | < 0.03 | 0.0003 | < 0.0001 | 0.31 | |
| 4 | 10.30 ±2.06 | 4.10 ±0.88 | 8.50 ±1.08 | 8.60 ±1.07 | < 0.0001 | < 0.03 | < 0.03 | < 0.0001 | < 0.0001 | 0.91 | |
Statistically significant differences (p < 0.05) between the groups are shown in grey.
Figure 12.
Comparison of the measured FCP (functional capillary perfusion) values within the studied experimental groups (CTRL, HSG, RAG, RLG)
Leukocyte endothelial interactions
There was a decrease in the number of rolling granulocytes (RL) after induction of shock (time 0.5) in HSG, RLG and RAG groups (Table IV A, Figures 13 A). The total number of SL and TL examined in the CTRL group was significantly lower than in the other experimental groups (p < 0.05). In the case of the RAG group, after fluid resuscitation, SL level recorded at the third and 4th h of the experiment, as well as TL level at the fourth hour, was significantly lower compared with RLG and HSG groups (p < 0.05) (Tables IV B, C, Figures 13 B, C). There were no statistically significant differences in SL and TL values between RLG and HSG groups (p > 0.05). In the case of the RAG group, the number of TL recorded during the second and fourth hour of the measurement was significantly lower compared with the HSG group, whereas no similar relationship was observed for the values of SL.
Table IV.
A–C. Comparison of the leukocytes number circulating in the microcirculation of the creamaster musle flap over 4 hours observation period: freely flowing (RL), attached to the endothelium (SL), and present in the extravascular space (TL)
| A | ||||||||||||
|---|---|---|---|---|---|---|---|---|---|---|---|---|
| Measurement | Mean ± SD | P-values | ||||||||||
| Time[h] | CTRL | HSG | RAG | RLG | CTRL vs. HSG | CTRL vs. RAG | CTRL vs. RLG | HSG vs. RAG | HSG vs. RLG | RAG vs. RLG | ||
| RL (n) | 0 | 12.10 ±2.08 | 11.90 ±2.73 | 11.50 ±3.31 | 12.20 ±3.05 | 0.97 | 0.74 | 0.63 | 0.74 | 0.68 | 0.48 | |
| 0.5 | 11.50 ±3.24 | 5.90 ±2.18 | 5.50 ±1.90 | 5.80 ±1.99 | < 0.002 | 0.002 | 0.001 | 0.97 | 0.97 | 0.68 | ||
| 1 | 11.10 ±2.81 | 5.60 ±1.71 | 7.70 ±2.21 | 7.00 ±1.83 | < 0.0005 | < 0.02 | < 0.003 | < 0.05 | 0.12 | 0.85 | ||
| 2 | 10.70 ±2.26 | 5.00 ±1.89 | 7.40 ±2.27 | 7.00 ±2.31 | < 0.0001 | < 0.003 | < 0.003 | < 0.04 | < 0.05 | 0.74 | ||
| 3 | 10.30 ±2.06 | 5.00 ±1.76 | 7.00 ±2.26 | 6.70 ±2.00 | 0.0002 | 0.005 | < 0.003 | < 0.003 | < 0.04 | 0.39 | ||
| 4 | 9.70 ±1.77 | 4.00 ±1.83 | 6.30 ±2.26 | 5.80 ±2.15 | < 0.0001 | < 0.002 | 0.001 | < 0.03 | 0.06 | 0.85 | ||
| B | ||||||||||||
| Measurement | Mean ± SD | P-values | ||||||||||
|
Time
[h] |
CTRL | HSG | RAG | RLG | CTRL vs. HSG | CTRL vs. RAG | CTRL vs. RLG | HSG vs. RAG | HSG vs. RLG | RAG vs. RLG | ||
| SL (n) | 0 | 1.30 ±1.42 | 1.50 ±1.43 | 1.60 ±0.70 | 1.60 ±0.84 | 0.63 | 0.19 | 0.19 | 0.53 | 0.48 | 0.91 | |
| 0.5 | 1.40 ±0.70 | 2.30 ±1.57 | 2.70 ±0.67 | 2.10 ±1.37 | 0.28 | < 0.002 | 0.14 | 0.35 | 1.00 | 0.28 | ||
| 1 | 1.60 ±0.70 | 3.20 ±1.55 | 2.80 ±2.15 | 3.40 ±0.97 | 0.005 | 0.25 | 0.0001 | 0.44 | 0.28 | 0.17 | ||
| 2 | 1.60 ±0.97 | 3.40 ±1.71 | 3.10 ±1.10 | 4.10 ±1.06 | 0.009 | < 0.004 | 0.0002 | 0.58 | 0.31 | 0.07 | ||
| 3 | 1.80 ±1.14 | 4.10 ±1.60 | 3.30 ±1.49 | 4.30 ±1.06 | < 0.004 | < 0.03 | 0.0003 | 0.22 | 0.91 | < 0.05 | ||
| 4 | 1.90 ±1.73 | 4.30 ±1.57 | 3.50 ±1.35 | 4.70 ±1.16 | < 0.007 | 0.052 | 0.005 | 0.19 | 0.74 | 0.009 | ||
| C | ||||||||||||
| Measurement | Mean ± SD | P-values | ||||||||||
|
Time
[h] |
CTRL | HSG | RAG | RLG | CTRL vs. HSG | CTRL vs. RAG | CTRL vs. RLG | HSG vs. RAG | HSG vs. RLG | RAG vs. RLG | ||
| TL (n) | 0 | 1.30 ±0.67 | 1.10 ±0.57 | 0.90 ±0.32 | 1.30 ±0.67 | 0.53 | 0.19 | 0.79 | 0.53 | 0.74 | 0.31 | |
| 0.5 | 1.60 ±0.70 | 2.00 ±0.82 | 1.90 ±0.32 | 2.10 ±0.32 | 0.48 | 0.43 | 0.16 | 0.97 | 0.53 | 0.48 | ||
| 1 | 2.10 ±0.74 | 3.20 ±0.92 | 2.70 ±1.16 | 2.80 ±1.03 | 0.009 | 0.31 | 0.19 | 0.35 | 0.39 | 0.85 | ||
| 2 | 2.10 ±0.99 | 3.90 ±0.74 | 2.90 ±0.74 | 3.40 ±0.70 | < 0.0005 | 0.06 | 0.002 | < 0.02 | 0.14 | 0.22 | ||
| 3 | 2.40 ±0.97 | 4.20 ±1.14 | 3.50 ±0.85 | 3.90 ±0.88 | 0.002 | < 0.02 | 0.005 | 0.14 | 0.79 | 0.22 | ||
| 4 | 2.50 ±0.97 | 4.70 ±0.82 | 3.80 ±0.79 | 5.00 ±1.05 | 0.0002 | 0.009 | 0.0001 | < 0.03 | 0.58 | 0.009 | ||
Statistically significant differences (p < 0.05) between the groups are shown in grey.
Figure 13.
A – Comparison of measurements of freely flowing leukocytes (RL, rolling leukocytes) within the studied experimental groups (CTRL, HSG, RAG, RLG). B – Comparison of measurements of the number of leukocytes attached to the endothelium (SL, sticking leukocytes) within the studied experimental groups (CTRL, HSG, RAG, RLG). Statistically significant differences in the amount of SL between RLG and RAG groups are indicated with stars. C – Comparison of measurements of the number of leukocytes in the extravascular space (TL, transmigrated leukocytes) within the studied experimental groups (CTRL, HSG, RAG, RLG). Statistically significant difference in the amount of SL between RAG and RLG groups is indicated with a star
Endothelial permeability
Permeability index values were significantly higher in HSG, RAG and RLG groups, compared with the CTRL group (p < 0.05). The largest PI was observed in the RLG group, which was statistically significantly higher compared with CTRL, HSG and RAG groups (p ≤ 0.01) (Table V, Figure 14).
Table V.
Comparison of measurements of vascular permeability index (PI) in postcapillary vessels within studied experimental groups (CTRL, HSG, RAG, RLG)
| Measurement | Mean ± SD | P-values | |||||||||
|---|---|---|---|---|---|---|---|---|---|---|---|
| Time[min] | CTRL | HSG | RAG | RLG | CTRL vs. HSG | CTRL vs. RAG | CTRL vs. RLG | HSG vs. RAG | HSG vs. RLG | RAG vs. RLG | |
| PI | 0 | 0.45 ±0.08 | 0.52 ±0.04 | 0.47 ±0.04 | 0.54 ±0.03 | < 0.03 | 0.16 | 0.01 | 0.009 | 0.09 | 0.001 |
| 15 | 0.48 ±0.02 | 0.56 ±0.03 | 0.53 ±0.02 | 0.60 ±0.02 | < 0.0001 | < 0.0001 | < 0.0001 | 0.01 | 0.25 | 0.001 | |
| 30 | 0.52 ±0.04 | 0.63 ±0.04 | 0.58 ±0.03 | 0.65 ±0.05 | < 0.0001 | 0.0007 | < 0.0001 | 0.001 | 0.06 | < 0.003 | |
| 45 | 0.55 ±0.05 | 0.68 ±0.04 | 0.60 ±0.11 | 0.70 ±0.10 | < 0.0001 | 0.14 | 0.0007 | 0.052 | 0.11 | < 0.004 | |
| 60 | 0.59 ±0.01 | 0.75 ±0.05 | 0.69 ±0.02 | 0.79±0.04 | < 0.0001 | < 0.0001 | < 0.0001 | < 0.002 | 0.01 | < 0.0001 | |
Statistically significant differences (p < 0.05) between the groups are shown in grey.
Figure 14.
Comparison of results of permeability index (PI) within the studied experimental groups (CTRL, HSG, RAG, RLG). Statistically significant differences (p < 0.05) in PI values between RAG and RLG groups are indicated with stars
Tissue oxygenation
The PtiO2 values were similar at the beginning of the experiment at similar levels in all experimental groups (time 0) (p > 0.05). Starting from measurements taken at 0.5 h, the PtiO2 level in the CTRL group was statistically significantly higher than in HSG, RAG and RLG groups (p < 0.05). After induction of shock (time 0.5 h), the PtiO2 value measured in RAG and RLG decreased, then not reaching a statistically significantly higher level compared with HSG (p > 0.05).
Parameters of blood sampling
Data of the parameters assessed from arterial blood sampling are summarized in Table VI.
Table VI.
Comparison of parameters identified in the arterial blood gasometry within the studied experimental groups
| Measurement | Mean ± SD | P-values | |||||||||
|---|---|---|---|---|---|---|---|---|---|---|---|
| Time[h] | CTRL | HSG | RAG | RLG | CTRL vs. HSG | CTRL vs. RAG | CTRL vs. RLG | HSG vs. RAG | HSG vs. RLG | RAG vs. RLG | |
| Hb [g/dl] |
0.5 | – | 15.5 ±0.85 | 15.2 ±1.40 | 15.2 ±0.92 | – | – | – | 0.32 | 0.43 | 0.85 |
| 5.0 | 15.2 ±1.14 | 11.6 ±1.06 | 10.0 ±1.05 | 9.9 ±0.97 | < 0.0001 | < 0.0001 | < 0.0001 | < 0.02 | < 0.01 | 0.39 | |
| Ht [%] |
0.5 | – | 45.1 ±0.88 | 45.6 ±0.97 | 45.7 ±1.25 | – | – | – | 0.25 | 0.25 | 0.91 |
| 5.0 | 44.8 ±1.14 | 32.8 ±1.03 | 30.4 ±1.07 | 30.6 ±1.26 | < 0.0001 | < 0.0001 | < 0.0001 | < 0.02 | < 0.05 | < 0.05 | |
| pH | 0.5 | – | 7.34 ±0.01 | 7.35 ±0.01 | 7.36 ±0.06 | – | – | – | 0.60 | 0.58 | 0.12 |
| 5.0 | 7.32 ±0.01 | 7.17 ±0.08 | 7.19 ±0.01 | 7.20 ±0.07 | < 0.0001 | < 0.0001 | < 0.0001 | 0.79 | 0.53 | 0.60 | |
| PaO2 [mm Hg] | 0.5 | – | 132.7 ±3.5 | 132.1 ±2.4 | 133.7 ±3.1 | – | – | – | 0.07 | 0.06 | 0.35 |
| 5.0 | 108.6 ±4.9 | 78.7 ±1.2 | 82.1 ±2.6 | 81.2 ±3.4 | < 0.0001 | < 0.0001 | < 0.0001 | 0.06 | 0.14 | 0.43 | |
| PaCO2 [mm Hg] | 0.5 | – | 45.6 ±2.6 | 45.8 ±2.6 | 45.6 ±3.9 | – | – | – | 0.63 | 0.58 | 0.79 |
| 5.0 | 52.2 ±2.7 | 73.2 ±3.0 | 64.5 ±2.9 | 65.5 ±4.7 | < 0.0001 | < 0.0001 | < 0.0001 | < 0.0001 | < 0.004 | 0.91 | |
| Lac [mmol/l] | 0.5 | – | 0.67 ±0.13 | 0.68 ±0.10 | 0.65 ±0.10 | – | – | – | 0.79 | 0.79 | 1.00 |
| 5.0 | 0.78 ±0.15 | 5.50 ±1.43 | 5.17 ±0.76 | 5.75 ±1.14 | < 0.0001 | < 0.0001 | < 0.0001 | 0.06 | 0.63 | 0,08 | |
Statistically significant differences (p < 0.05) between the groups are shown in grey. Hb – hemoglobin, Ht – hematocrit, PaO2 – partial pressure of oxygen in arterial blood, PaCO2 – partial pressure of carbon dioxide in arterial blood, Lac – lactate level.
Discussion
The experimental model of haemorrhagic shock used in this study was based on previously described experimental models including the original report of Wiggers [36–38]. In this type of model, blood is collected from anesthetized animals in a volume that allows a predetermined level of mean arterial pressure to be obtained and the resultant haemorrhagic shock is then maintained for a fixed time interval [39–59]. In the experiment, the achieved MAP level (≤ 50 mm Hg) was maintained for 25 min. The presented experimental model referred to a clinical situation in which patients manifested no evident features of respiratory failure and therefore did not require mechanical ventilation or passive oxygen therapy. Fluid resuscitation with Ringer’s solutions resulted, as expected, in a short-term increase of mean arterial pressure (MAP) and central venous pressure (CVP) in groups AR and LR. The number of active capillaries per field (functional capillary perfusion – FCP) is a parameter that directly reflects organ perfusion. Our study demonstrated that a decrease in MAP is closely correlated with a reduction in blood flow and FCP after induced haemorrhagic shock. However, following fluid resuscitation and a significant increase in MAP, blood flow level and FCP did not return to pre-haemorrhagic values.
Differences in the activity of the large and small vessels of the microcirculation have been observed in many previous studies [55, 60–64].
An increase in contractility of the large arterioles was accompanied by vasodilatation of the precapillary arterioles in some cases and by a lack of response in others. The present study showed that A3 arterioles may function as a pre-capillary sphincter in the microcirculation of the skeletal muscle [65, 66]. Despite induced haemorrhagic shock (HSG, RAG, RLG) and aggressive fluid therapy (AR, LR), the present experiment revealed no statistically significant differences in the diameters of A3 arterioles in groups CTRL, HSG, RAG and RLG.
Some of the data in the available literature indicate the possible impact of the therapy with Ringer’s lactate solution on induction of inflammation [13, 67–70]. The sparse literature on the use of Ringer’s acetate solution in patients with shock does not suggest any possible similar effects on the immune system. Kveim and Nesbakken showed that the metabolism of acetates proceeds smoothly even in cases of severe haemorrhagicshock [71]. In their clinical studies, Nakayama et al. and Sekiguchiet al. observed a favourable effect of Ringer’s acetate solution on acid-base balance during hepatectomy and cardiac surgery [72, 73].
The evaluation of leukocyte activation, both during induction of haemorrhagic shock and during resuscitation, is an important observation found in our study [74–78]. The present study showed a significantly greater number of SL and TL leukocytes in the examined post-capillary vessels in the group resuscitated with Ringer’s lactate solution when compared to the group resuscitated with Ringer’s acetate. Also the intensity of interaction between PMN and endothelium was found to correlate with an increase in permeability of the postcapillary vessels [79–86]. It has been reported that PI is significantly higher in groups resuscitated with Ringer’s lactate solution when compared to HSG and RAG groups. Generally available Ringer’s solution contains a racemic mixture of lactate consisting of equal proportions of D(–) and L(+) isomers. Experimental studies, both in vitro, i.e. on isolated leukocytes, and in vivo, i.e. on experimental animals, have proved that a D-isomer is responsible for the modulation of the leukocytes’ function, as described above [15, 67, 68, 85–87]. Koustovaet al. indicate that D-lactates trigger PMN by stimulating the expression of genes that activate neutrophils and inhibit the expression of genes responsible for cellular apoptosis [86].
In summary, the results of our study confirm literature reports on haemodynamic changes and leukocyte-endothelial activation following fluid resuscitation after induction of haemorrhagic shock. In our experimental design we applied a cremaster muscle model to assess haemodynamic changes after haemorrhagic shock, since it has unique features allowing for direct in vivo visualization of leukocyte rolling, sticking and transmigration as well as monitoring of peripheral microcirculatory haemodynamics both during shock induction and during fluid resuscitation. These results apply specifically to the rodent model and may differ in different species with different muscle mass and different metabolic activity. However, currently there are no large animal models available where direct in vivo monitoring and visualisation of haemodynamic images would be feasible. To further assess the complexity of fluid resuscitation after haemorrhagic shock, more research testing cytokine, chemokine and bradykinin responses in different species is needed in order to carefully extrapolate these findings to humans.
In conclusion, the present study revealed that fluid resuscitation with Ringer’s lactate solution exacerbates inflammation in the skeletal muscle. It is worth noting that Ringer’s acetate solution reduces local inflammation and could therefore be recommended as the “first line” crystalloid considered for fluid resuscitation during haemorrhagic shock.
Conflict of interest
The authors declare no conflict of interest.
References
- 1.Baue AE. MOF, MODS, and SIRS: what is in a name or an acronym? Shock. 2006;26:438–49. doi: 10.1097/01.shk.0000228172.32587.7a. [DOI] [PubMed] [Google Scholar]
- 2.Deitch EA. Multiple organ failure. Pathophysiology and potential future therapy. Ann Surg. 1992;216:117–34. doi: 10.1097/00000658-199208000-00002. [DOI] [PMC free article] [PubMed] [Google Scholar]
- 3.Jaeschke H, Bautista AP, Spolarics Z, et al. Superoxide generation by neutrophils and Kupffer cells during in vivo reperfusion after hepatic ischemia in rats. J Leukoc Biol. 1992;52:377–82. doi: 10.1002/jlb.52.4.377. [DOI] [PubMed] [Google Scholar]
- 4.Paes-da-Silva F, Gonzalez AP, Tibirica E. Effects of fluid resuscitation on mesenteric microvascular blood flow and lymphatic activity after severe hemorrhagic shock in rats. Shock. 2003;19:55–60. doi: 10.1097/00024382-200301000-00011. [DOI] [PubMed] [Google Scholar]
- 5.Lee CC, Chang IJ, Yen ZS, et al. Effect of different resuscitation fluids on cytokine response in a rat model of hemorrhagic shock. Shock. 2005;24:177–81. doi: 10.1097/01.shk.0000171870.42900.15. [DOI] [PubMed] [Google Scholar]
- 6.Cuthbertson DP. Post-shock metabolic response. Lancet. 1942;1:433–7. [PubMed] [Google Scholar]
- 7.Rivers E, Nguyen B, Havstad S, et al. Early goal-directed therapy in the treatment of severe sepsis and septic shock. N Engl J Med. 2001;345:1368–77. doi: 10.1056/NEJMoa010307. [DOI] [PubMed] [Google Scholar]
- 8.Perel P, Roberts IG. Colloids versus crystalloids for fluid resuscitation in critically ill patients. Cochrane Database Syst Rev. 2007;4:CD000567. doi: 10.1002/14651858.CD000567.pub3. [DOI] [PubMed] [Google Scholar]
- 9.Choi PT, Yip G, Quinonez LG, et al. Crystalloids vs. colloids in fluid resuscitation: a systematic review. Crit Care Med. 1999;27:200–10. doi: 10.1097/00003246-199901000-00053. [DOI] [PubMed] [Google Scholar]
- 10.Dellinger RP, Levy MM, Carlet JM, et al. Surviving Sepsis Campaign: International guidelines for management of severe sepsis and septic shock: 2008. Crit Care Med. 2008;36:296–327. doi: 10.1097/01.CCM.0000298158.12101.41. [DOI] [PubMed] [Google Scholar]
- 11.Langer T, Santini A, Scotti E, et al. Intravenous balanced solutions: from physiology to clinical evidence. Anaesthesiol Intens Therapy. 2015;47:78–88. doi: 10.5603/AIT.a2015.0079. [DOI] [PubMed] [Google Scholar]
- 12.Healey MA, Davis RE, Liu FC, et al. Lactated ringer’s is superior to normal saline in a model of massive hemorrhage and resuscitation. J Trauma. 1998;45:894–9. doi: 10.1097/00005373-199811000-00010. [DOI] [PubMed] [Google Scholar]
- 13.Todd SR, Malinoski D, Muller PJ, et al. Lactated Ringer’s is superior to normal saline in the resuscitation of uncontrolled hemorrhagic shock. J Trauma. 2007;62:636–9. doi: 10.1097/TA.0b013e31802ee521. [DOI] [PubMed] [Google Scholar]
- 14.Ergin B, Kapucu A, Guerci P, Ince C. The role of bicarbonate precursors in balanced fluids during haemorrhagic shock with and without compromised liver function. Br J Anaesth. 2016;117:521–8. doi: 10.1093/bja/aew277. [DOI] [PubMed] [Google Scholar]
- 15.Rhee P, Burris D, Kaufmann C, et al. Lactated Ringer’s solution resuscitation causes neutrophil activation after hemorrhagic shock. J Trauma. 1998;44:313–9. doi: 10.1097/00005373-199802000-00014. [DOI] [PubMed] [Google Scholar]
- 16.Rhee P, Wang D, Ruff P, et al. Human neutrophil activation and increased adhesion by various resuscitation fluids. Crit Care Med. 2000;28:74–8. doi: 10.1097/00003246-200001000-00012. [DOI] [PubMed] [Google Scholar]
- 17.Buitrago S, Martin TE, Tetens-Woodring J, et al. Safety and efficacy of various combinations of injectable anesthetics in BALB/c mice. JAALAS. 2008;47:11–7. [PMC free article] [PubMed] [Google Scholar]
- 18.Harkness JE, Turner PV, VandeWoude S, et al. Harkness and Wagner’s Biology and Medicine of Rabbits and Rodents. 5th. Ames, Iowa: Wiley-Blackwell; 2010. pp. 160–2. [Google Scholar]
- 19.Flecknell P. Laboratory Animal Anaesthesia. 3rd. Elsevier Inc; 2009. pp. 19–78. [Google Scholar]
- 20.He S, Atkinson C, Qiao F, et al. Ketamine-xylazine-acepromazine compared with isoflurane for anesthesia during liver transplantations in rodens. JAALAS. 2010;49:45–51. [PMC free article] [PubMed] [Google Scholar]
- 21.Hobbs BA, Rolhall TG, Sprenkel TL, et al. Comparison of several combinations for anesthesia in rabbits. Am J Vet Res. 1991;52:669–74. [PubMed] [Google Scholar]
- 22.Lipman NS, Marini RP, Erdman SE. A comparison of ketamine/xylazine and ketamine/xylazine/acepromazine anesthesia in the rabbit. Lab Anim Sci. 1990;40:395–8. [PubMed] [Google Scholar]
- 23.Richardson CA, Flecknell PA. Anaesthesia and post-operative analgesia following experimental surgery in laboratory rodens: are we making progress? Altern Labor Animals. 2005;33:119–27. doi: 10.1177/026119290503300207. [DOI] [PubMed] [Google Scholar]
- 24.Stokes EL, Flecknell PA, Richardson CA. Reported analgesic and anaesthetic administration to rodens undergoing experimental surgical procedures. Lab Anim. 2009;43:149–54. doi: 10.1258/la.2008.008020. [DOI] [PubMed] [Google Scholar]
- 25.Taylor BJ, Orr SA, Chapman JL, et al. Beyond-use dating of extemporaneously compounded ketamine, acepromazine, and xylazine: safety, stability, and efficacy over time. JAALAS. 2009;48:718–26. [PMC free article] [PubMed] [Google Scholar]
- 26.Anderson GL, Acland RD, Siemionow M, et al. Vascular isolation of the rat cremaster muscle. Microvasc Res. 1988;36:56–63. doi: 10.1016/0026-2862(88)90038-6. [DOI] [PubMed] [Google Scholar]
- 27.Arslan E, Sierko E, Waters J, et al. Microcirculatory hemodynamics after acute blood loss followed by fresh or banked blood transfusion. Am J Surg. 2005;190:456–62. doi: 10.1016/j.amjsurg.2005.05.041. [DOI] [PubMed] [Google Scholar]
- 28.Banbury J, Siemionow M, Porvasnik S, et al. Muscle flaps’ triphasic microcirculatory response to sympathectomy and denervation. Plastic Reconstruct Surg. 1999;104:730–7. doi: 10.1097/00006534-199909030-00018. [DOI] [PubMed] [Google Scholar]
- 29.Gonzalez AM, Yazici I, Kusza K, et al. Effects of fresh versus banked blood transfusions on microcirculatory hemodynamics and tissue oxygenation in the rat cremaster model. Surgery. 2007;141:630–9. doi: 10.1016/j.surg.2006.09.015. [DOI] [PubMed] [Google Scholar]
- 30.Grant RT. The effects of denervation on skeletal muscle blood vessels (rat cremaster) J Anat. 1966;100:305–16. [PMC free article] [PubMed] [Google Scholar]
- 31.Hester R. The cremaster muscle for microcirculatory studies. In: Knoelle G, editor. The Encyklopedia of the Microvasculature. New York: Elsevier; 2005. pp. 159–63. [Google Scholar]
- 32.Nanhekhan LV, Siemionow M. Microcirculatory hemodynamics of the rat cremaster muscle flap in reduced blood flow states. Ann Plast Surg. 2003;51:182–8. doi: 10.1097/01.SAP.0000058500.56551.09. [DOI] [PubMed] [Google Scholar]
- 33.Siemionow M, Andreasen T, Chick L, et al. Effect of muscle flap denervation on flow hemodynamics: a new model for chronic in vivo studies. Microsurgery. 1994;15:891–4. doi: 10.1002/micr.1920151213. [DOI] [PubMed] [Google Scholar]
- 34.Siemionow M, Nanhekhan LV. Introduction of cremaster muscle chamber technique for long-term intravital microscopy. Ann Plast Surg. 1999;43:161–6. [PubMed] [Google Scholar]
- 35.Siemionow M, Moreira-Gonzalez A. The cremaster muscle as a microvascular research model. In: Knoelle G, editor. The Encyklopedia of the Microvasculature. New York: Elsevier; 2005. pp. 187–94. [Google Scholar]
- 36.Wiggers CJ. The present status of the shock problem. Physiol Rev. 1942;22:74–123. [Google Scholar]
- 37.Wiggers CJ. Physiology of Shock. New York: Commonwealth; 1950. Experimental hemorrhagic shock; pp. 121–32. [Google Scholar]
- 38.Krausz MM. Initial resuscitation of hemorrhagic shock. World J Emerg Surg. 2006;1:14. doi: 10.1186/1749-7922-1-14. [DOI] [PMC free article] [PubMed] [Google Scholar]
- 39.Bahrami S, Zimmermann K, Szelenyi Z, et al. Small-volume fluid resuscitation with hypertonic saline prevents inflammation but not mortality in a rat model of hemorrhagic shock. Shock. 2006;25:283–9. doi: 10.1097/01.shk.0000208808.03148.ea. [DOI] [PubMed] [Google Scholar]
- 40.Boura C, Caron A, Longrois D, et al. Volume expansion with modified hemoglobin solution, colloids, or crystalloid after hemorrhagic shock in rabbits: effects in skeletal muscle oxygen pressure and use versus arterial blood velocity and resistance. Shock. 2003;19:176–82. doi: 10.1097/00024382-200302000-00015. [DOI] [PubMed] [Google Scholar]
- 41.Drucker WR, DeKiewiet JC. Glucose uptake by diaphragms from rats subjected to hemorrhagic shock. Am J Physiol. 1964;206:317–20. doi: 10.1152/ajplegacy.1964.206.2.317. [DOI] [PubMed] [Google Scholar]
- 42.Funk W, Baldinger V. Microcirculatory perfusion during volume therapy: a comparative study using crystalloid or colloid in awake animals. Anesthesiology. 1995;82:975–82. doi: 10.1097/00000542-199504000-00022. [DOI] [PubMed] [Google Scholar]
- 43.Gurfinkel V, Poggetti RS, Fontes B, et al. Hypertonic saline improves tissue oxygenation and reduces systemic and pulmonary inflammatory response caused by hemorrhagic shock. J Trauma. 2003;54:1137–45. doi: 10.1097/01.TA.0000064452.37534.29. [DOI] [PubMed] [Google Scholar]
- 44.Lazarus HM, Hopfenbeck A. Effects of hemorrhagic shock on nuclear DNA. Surgery. 1979;85:297–302. [PubMed] [Google Scholar]
- 45.Mela L, Bacalzo LV, Jr, Miller LD. Defective oxidative metabolism of rat liver mitochondria in hemorrhagic and endotoxin shock. Am J Physiol. 1971;220:571–7. doi: 10.1152/ajplegacy.1971.220.2.571. [DOI] [PubMed] [Google Scholar]
- 46.Molina PE, Bagby GJ, Stahls P. Hemorrhage alters neuroendocrine, hemodynamic, and compartment-specific TNF responses to LPS. Shock. 2001;16:459–65. doi: 10.1097/00024382-200116060-00010. [DOI] [PubMed] [Google Scholar]
- 47.Ozawa K, Ida T, Kamano T, et al. Different response of hepatic energy change and adenine nucleotide concentrations to hemorrhagic shock. Research Exp Med. 1976;169:145–53. doi: 10.1007/BF01851175. [DOI] [PubMed] [Google Scholar]
- 48.Paxian M, Keller SA, Huynh TT, et al. Perflubron emulsion improves hepatic microvascular integrity and mitochondrial redox state after hemorrhagic shock. Shock. 2003;20:449–57. doi: 10.1097/01.shk.0000090601.26659.87. [DOI] [PubMed] [Google Scholar]
- 49.Pearce FJ, Connett RJ, Drucker WR. Phase-related changes in tissue energy reserves during hemorrhagic shock. J Surg Res. 1985;39:390–8. doi: 10.1016/0022-4804(85)90092-7. [DOI] [PubMed] [Google Scholar]
- 50.Peitzman AB, Corbett WA, Shires GT, 3rd, et al. Cellular function in liver and muscle during hemorrhagic shock in primates. Surgery Gynecol Obstet. 1985;161:419–24. [PubMed] [Google Scholar]
- 51.Pelinka LE, Bahrami S, Szalay L, et al. Hemorrhagic shock induces an S 100 B increase associated with shock severity. Shock. 2003;19:422–6. doi: 10.1097/01.shk.0000055345.58165.52. [DOI] [PubMed] [Google Scholar]
- 52.Peterson J, Grande P. Volume expansion of albumin, gelatin, hydroxyethyl starch, saline and erythrocytes after hemorrhage in the rat. Intens Care Med. 2005;31:296–301. doi: 10.1007/s00134-004-2510-3. [DOI] [PubMed] [Google Scholar]
- 53.Phelan H, Stahls P, Hunt J, et al. Impact of alcohol intoxication on hemodynamic, metabolic, and cytokine responses to hemorrhagic shock. J Trauma. 2002;52:675–82. doi: 10.1097/00005373-200204000-00010. [DOI] [PubMed] [Google Scholar]
- 54.Rhodes RS, Depalma RG. Mitochondrial dysfunction of the liver and hypoglycemia inhemorrhagic shock. Surg Gynecol Obstet. 1980;150:347–52. [PubMed] [Google Scholar]
- 55.Sakai H, Hara H, Tsai AG, et al. Changes in resistance vessels during hemorrhagic shock and resuscitation in conscious hamster model. Am J Physiol Heart Circ Physiol. 1999;276:H563–71. doi: 10.1152/ajpheart.1999.276.2.H563. [DOI] [PubMed] [Google Scholar]
- 56.Shah KJ, Chiu WC, Scalea TM, et al. Detrimental effects of rapid fluid resuscitation on hepatocellular function and survival after hemorrhagic shock. Shock. 2002;18:242–7. doi: 10.1097/00024382-200209000-00007. [DOI] [PubMed] [Google Scholar]
- 57.Szebani J, Baranyi L, Savay S, et al. Complement activation during hemorrhagic shock and resuscitation in swine. Shock. 2003;20:347–55. doi: 10.1097/01.shk.0000082444.66379.17. [DOI] [PubMed] [Google Scholar]
- 58.Weil MH, Afifi AA. Experimental and clinical studies on lactate and pyruvate as indicators of the severity of acute circulatory failure (shock) Circulation. 1970;41:989–1001. doi: 10.1161/01.cir.41.6.989. [DOI] [PubMed] [Google Scholar]
- 59.Zhang H, Voglis S, Kim CH, et al. Effects of albumin and Ringer’s lactate on production of lung cytokines and hydrogen peroxide after resuscitated hemorrhage and endotoxemia in rats. Crit Care Med. 2003;31:1515–22. doi: 10.1097/01.CCM.0000065271.23556.FF. [DOI] [PubMed] [Google Scholar]
- 60.Kerger H, Tsai AG, Saltzman DJ, et al. Fluid resuscitation with oxygen versus nonoxygen cariers after 2-h hemorrhagic shock in conscious hamsters. Am J Physiol Heart Circ Physiol. 1997;272:H525–37. doi: 10.1152/ajpheart.1997.272.1.H525. [DOI] [PubMed] [Google Scholar]
- 61.Kerger HD, Saltzman DJ, Menger MD, et al. Systemic and subcutaneous microvascular oxygen tension dissociation during 4-h hemorrhagic shock in conscious hamsters. Am J Physiol Heart Circ Physiol. 1996;270:H827–36. doi: 10.1152/ajpheart.1996.270.3.H827. [DOI] [PubMed] [Google Scholar]
- 62.Sakai H, Takeoka S, Wettstein R, et al. Systemic and microvascular responses to hemorrhagic shock and resuscitation with Hb vesicles. Am J Physiol Heart Circ Physiol. 2002;283:H1191–9. doi: 10.1152/ajpheart.00080.2002. [DOI] [PubMed] [Google Scholar]
- 63.Torres Filho IP, Boegehold MA, Bouskela E, et al. Microcirculatory responses in cat sartorius muscle to hemorrhagic hypotension. Am J Physiol Heart Circ Physiol. 1989;257:H1647–55. doi: 10.1152/ajpheart.1989.257.5.H1647. [DOI] [PubMed] [Google Scholar]
- 64.Zhao KS, Junker D, Delano FA, et al. Microvascular adjustments during irreversible hemorrhagic shock in rat skeletal muscle. Microvasc Res. 1985;30:143–53. doi: 10.1016/0026-2862(85)90046-9. [DOI] [PubMed] [Google Scholar]
- 65.Meinger GA, Mack CA, Fehr KL, et al. Myogenic vasoregulation overrides local metabolic control in resting rat skeletal muscle. Circ Res. 1987;60:861–70. doi: 10.1161/01.res.60.6.861. [DOI] [PubMed] [Google Scholar]
- 66.Kusza K, Nalbantoglu U, Hayes JK, et al. Peripheral microcirculatory hemodynamics in rats under pentobarbital and halothane anesthesia. Anesth Analgesia. 1996;82:S1–515. [Google Scholar]
- 67.Ayuste EC, Chen H, Koustova E, et al. Hepatic and pulmonary apoptosis after hemorrhagic shock in swine can be reduced through modifications of conventional Ringer’s solution. J Trauma. 2006;60:52–63. doi: 10.1097/01.ta.0000200156.05397.0b. [DOI] [PubMed] [Google Scholar]
- 68.Jaskille A, Alam HB, Rhee P, et al. D-lactate increases pulmonary apoptosis by restricting phosphorylation of bad and eNOS in a rat model of hemorrhagic shock. J Trauma. 2004;57:262–9. doi: 10.1097/01.ta.0000133841.95455.73. [DOI] [PubMed] [Google Scholar]
- 69.Jaskille A, Koustova E, Rhee P, et al. Hepatic apoptosis after hemorrhagic shock in rats can be reduced through modifications of conventional Ringer’s solution. J Am Coll Surg. 2006;202:25–35. doi: 10.1016/j.jamcollsurg.2005.08.027. [DOI] [PubMed] [Google Scholar]
- 70.Koustova E, Stanton K, Gushchin V, et al. Effects of lactated Ringer’s solutions on human leukocytes. J Trauma. 2002;52:872–8. doi: 10.1097/00005373-200205000-00009. [DOI] [PubMed] [Google Scholar]
- 71.Kveim M, Nesbakken R. Utilization of exogenous acetate during canine haemorrhagic shock. Scand J Clin Labor Investig. 1979;39:653–8. doi: 10.1080/00365517909108870. [DOI] [PubMed] [Google Scholar]
- 72.Nakayama M, Kawana S, Yamauchi M, et al. Utility of acetated Ringer solution as intraoperative fluids during hepatectomy. Masui. 1995;44:1654–60. [PubMed] [Google Scholar]
- 73.Sekiguchi M, Sunagawa H, Futagami N, et al. Utility of Ringer’s acetate solution as an intraoperative fluid during cardiovascular surgery with cardiopulmonary bypass. Masui. 2000;49:530–4. [PubMed] [Google Scholar]
- 74.Engelhardt B, Vestweber D. The multistep cascade of leukocyte extravasation. In: Knoelle G, editor. The Encyklopedia of Microvasculature. New York: Elsevier; 2005. pp. 303–7. [Google Scholar]
- 75.Harlan JM. Leukocyte-endothelial interactions. Blood. 1985;65:513–25. [PubMed] [Google Scholar]
- 76.Liu X, Peter FW, Barker JH, et al. Leukocyte-endothelium interaction in arterioles after ischemia and reperfusion. J Surg Res. 1999;87:77–84. doi: 10.1006/jsre.1999.5725. [DOI] [PubMed] [Google Scholar]
- 77.Munn LL. Analytical approaches to leukocyte-endothelium interactions. In: Knoelle G, editor. The Encyklopedia of the Microvasculature. New York: Elsevier; 2005. pp. 791–4. [Google Scholar]
- 78.Nakagawa NK, Nogueira RA, Correia CJ, et al. Leukocyte-endothelium interactions after hemorrhagic shock/reperfusion and cecal ligation/puncture: an intravital microscopic study in rat mesentery. Shock. 2006;26:180–6. doi: 10.1097/01.shk.0000223133.10254.82. [DOI] [PubMed] [Google Scholar]
- 79.Bates DO. Regulation of microvascular permeability. In: Knoelle G, editor. The Encyklopedia of the Microvasculature. New York: Elsevier; 2005. pp. 203–7. [Google Scholar]
- 80.Conner W, Gallagher CM, Miner TJ, et al. Neutrophil priming state predicts capillary leak after gut ischemia in rats. J Surg Res. 1999;84:24–30. doi: 10.1006/jsre.1999.5598. [DOI] [PubMed] [Google Scholar]
- 81.Majno G, Palade GE. Studies on inflammation. 1. The effect of histamine and serotonin on vascular permeability: an electron microscopy study. J Biophys Biochem Cytol. 1961;11:571–605. doi: 10.1083/jcb.11.3.571. [DOI] [PMC free article] [PubMed] [Google Scholar]
- 82.Michel CC. Microvascular permeability. In: Knoelle G, editor. The Encyklopedia of the Microvasculature. New York: Elsevier; 2005. pp. 255–60. [Google Scholar]
- 83.Ward PA, Varani J. Mechanisms of neutrophil-mediated killing of endothelial cells. J Leukocyte Biol. 1990;48:97–102. doi: 10.1002/jlb.48.1.97. [DOI] [PubMed] [Google Scholar]
- 84.Zakaria ER, Campbell JE, Peyton JC, et al. Postresuscitation tissue neutrophil infiltration is time-dependent and organ-specific. J Surg Res. 2007;143:119–25. doi: 10.1016/j.jss.2007.04.008. [DOI] [PMC free article] [PubMed] [Google Scholar]
- 85.Deb S, Martin B, Sun L, et al. Resuscitation with lactated Ringer’s solution in rats with hemorrhagic shock induces immediate apoptosis. J Trauma. 1999;46:582–8. doi: 10.1097/00005373-199904000-00005. [DOI] [PubMed] [Google Scholar]
- 86.Koustova E, Rhee P, Hancock T, et al. Ketone and pyruvate Ringer’s solutions decrease pulmonary apoptosis in a rat model of severe hemorrhagic shock and resuscitation. Surgery. 2003;134:267–74. doi: 10.1067/msy.2003.245. [DOI] [PubMed] [Google Scholar]
- 87.Ozcicek A, Ozcicek F, Yildiz G, et al. Neutrophil-to-lymphocyte ratio as a possible indicator of epicardial adipose tissue in patients undergoing hemodialysis. Arch Med Sci. 2017;13:118–23. doi: 10.5114/aoms.2015.50784. [DOI] [PMC free article] [PubMed] [Google Scholar]


