

Abstract
G protein–coupled receptors (GPCRs) are key signaling proteins that regulate nearly every aspect of cell function. Studies of GPCRs have benefited greatly from the development of molecular tools to monitor receptor activation and downstream signaling. Here, we show that mini G proteins are robust probes that can be used in a variety of assay formats to report GPCR activity in living cells. Mini G (mG) proteins are engineered GTPase domains of Gα subunits that were developed for structural studies of active-state GPCRs. Confocal imaging revealed that mG proteins fused to fluorescent proteins were located diffusely in the cytoplasm and translocated to sites of receptor activation at the cell surface and at intracellular organelles. Bioluminescence resonance energy transfer (BRET) assays with mG proteins fused to either a fluorescent protein or luciferase reported agonist, superagonist, and inverse agonist activities. Variants of mG proteins (mGs, mGsi, mGsq, and mG12) corresponding to the four families of Gα subunits displayed appropriate coupling to their cognate GPCRs, allowing quantitative profiling of subtype-specific coupling to individual receptors. BRET between luciferase–mG fusion proteins and fluorescent markers indicated the presence of active GPCRs at the plasma membrane, Golgi apparatus, and endosomes. Complementation assays with fragments of NanoLuc luciferase fused to GPCRs and mG proteins reported constitutive receptor activity and agonist-induced activation with up to 20-fold increases in luminescence. We conclude that mG proteins are versatile tools for studying GPCR activation and coupling specificity in cells and should be useful for discovering and characterizing G protein subtype–biased ligands.
Keywords: G protein–coupled receptor (GPCR), G protein, arrestin, biosensor, molecular pharmacology, BRET, mini G protein, NanoLuc, protein complementation
Introduction
G protein–coupled receptors (GPCRs)5 signal by coupling to heterotrimeric G proteins and arrestins, which in turn activate or inhibit enzymes, kinases and other effector molecules to regulate nearly every aspect of cell function (1). The past 20 years have seen the development of a wide array of genetically-encoded optical sensors and probes to monitor nearly every step of these signaling cascades in living cells (2). An early example of this was the development of arrestin–fluorescent protein conjugates that translocate from the cytosol to the plasma membrane upon activation of cell-surface GPCRs (3). There are now many variants of this basic approach with different reporters and detection modalities, and these relatively simple tools have been used to gain tremendous insight into the functional properties of arrestins and GPCRs. Similar tools have been developed to monitor interactions between GPCRs and G proteins (4, 5), but compared with arrestins, the properties of heterotrimers are less favorable for many applications in cells. Heterotrimeric G proteins are membrane-associated (or tethered) proteins and therefore do not change subcellular location upon binding to GPCRs. This prevents simple visualization of complex formation in imaging experiments and produces background signals when receptor–G protein complexes are detected using resonance energy transfer (e.g. FRET and BRET) (4, 5). Moreover, receptor–G protein complexes in cells are short-lived. Ambient concentrations of guanine nucleotides lead to rapid complex dissociation, thus limiting signals generated by receptor–G protein association.
Here, we report that mini G (mG) proteins (6, 7) are useful G protein surrogates for studies of GPCR activation in cells. Mini G proteins are Gα subunits with several key modifications as follows: 1) a truncated N terminus, which deletes membrane anchors and Gβγ-binding surface; 2) deletion of the α-helical domain; 3) mutations that improve protein stability in vitro; and 4) a mutation in the C-terminal α5 helix that uncouples GPCR binding from nucleotide release, thus stabilizing receptor–mG complexes in the presence of guanine nucleotides (Fig. 1A). Several mG variants also incorporate mutations at the GPCR–G protein interface and thus maintain the receptor-coupling specificity of the following four Gα subunit families: Gs, Gi/o, Gq/11, and G12/13. These modifications enable mini G proteins to report receptor activation in living cells in much the same way as arrestins and conformation-specific nanobodies (8). Therefore, mG proteins will likely become broadly useful tools to study GPCR activation and receptor–G protein-coupling specificity in cells.
Figure 1.
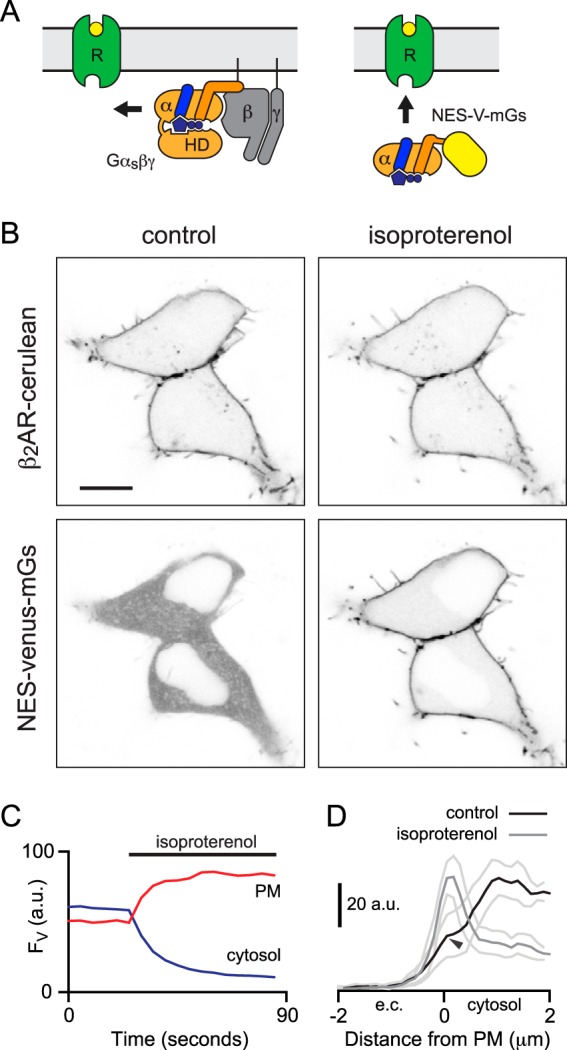
Mini G proteins are recruited to active receptors at the plasma membrane. A, cartoon representation highlighting the differences between G protein heterotrimers, which diffuse within the membrane to engage receptors (left), and mG proteins, which diffuse through the cytosol to engage receptors (right). Mini G proteins lack membrane anchors, N-terminal Gβγ-binding surface, and the α-helical domain (HD). B, confocal images of HEK 293 cells expressing cerulean-tagged β2-adrenergic receptors (β2AR-cerulean; top panels) and NES–venus–mGs (bottom panels). NES–venus–mGs is recruited to the plasma membrane after stimulation with 10 μm isoproterenol. Scale bar, 10 μm. C, venus fluorescence (FV, arbitrary units (a.u.)) at the plasma membrane (PM) and in the cytosol plotted against time for the cells shown in B. D, mean NES–venus–mGs fluorescence (± S.E.) line profiles drawn perpendicular to the plasma membrane from the extracellular (e.c.) space to the cytosol in five cells before and after application of isoproterenol. Weak accumulation of NES–venus–mGs at the plasma membrane is detectable prior to stimulation (black arrowhead).
Results and discussion
Mini G proteins were originally engineered for high-level expression in Escherichia coli, high stability in vitro, and effective coupling to GPCRs. To visualize mG protein expression in mammalian cells, we fused the fluorescent protein venus (9) to the N terminus of several mG proteins and expressed the resulting fusion proteins in HEK 293 cells under the control of a CMV promoter. Confocal microscopy revealed that mG variants shown previously to express well in E. coli (e.g. mGs_393) (6) were located diffusely throughout the cytoplasm and nucleus, whereas mG variants that express poorly in E. coli (e.g. mGq) (7) formed intracellular aggregates. Therefore, for this study we used four mG protein variants that express well in E. coli and HEK cells, specifically mGs_393, mGsi_43 (a chimera of mGs and mGi), mGsq_71 (a chimera of mGs and mGq), and mG12_8 (referred to hereafter as mGs, mGsi, mGsq, and mG12 for simplicity) (7). Because mG proteins in the nucleus are not immediately accessible to receptors at the plasma membrane, we added an N-terminal nuclear export sequence (NES) to second-generation mG fusion proteins, thereby restricting localization to the cytosol (Fig. 1B).
NES–venus–mG proteins bound tightly to agonist-activated GPCRs in intact cells. For example, stimulation of β2-adrenergic receptors fused to the fluorescent protein cerulean (β2AR–cerulean) with a saturating concentration of the agonist isoproterenol resulted in rapid translocation of NES–venus–mGs from the cytosol to the plasma membrane (Fig. 1, B and C). To estimate the stoichiometry of receptor–mG complexes at steady state, we used standardized confocal imaging conditions to measure cerulean and venus fluorescence at the plasma membrane of cells expressing cerulean-β2AR and venus–mGs in the presence of 10 μm isoproterenol. We calibrated these intensity measurements with a standard protein consisting of an extracellular cerulean, a transmembrane domain, and an intracellular venus (C-TM-V). The result indicated an average venus–mGs/cerulean–β2AR stoichiometry of ∼1:1 (mean venus/cerulean = 1.17; 95% confidence interval 0.87–1.47; n = 17). This is likely to be an overestimate due to the presence of residual cytosolic venus–mGs near the plasma membrane. Nevertheless, recruitment of mGs to active β2ARs was clearly efficient, consistent with the formation of relatively stable receptor–mG complexes. In some cells, there was detectable accumulation of mG proteins at the plasma membrane prior to stimulation (Fig. 1D), suggesting that mG proteins could also bind to ligand-free GPCRs (see below).
BRET between GPCRs and mG proteins
BRET is widely used to monitor protein interactions in cells (10) and can also detect protein trafficking or translocation to membrane compartments (11). To demonstrate the utility of mG proteins for BRET experiments, we cotransfected cells with a fixed amount of plasmid DNA encoding β2-adrenergic receptors fused to the Renilla luciferase Rluc8 (β2AR–Rluc8) and increasing amounts of DNA encoding NES–venus–mGs, and we quantified expression of the latter by flow cytometry. In unstimulated cells, there was a shallow monotonic increase in BRET as NES–venus–mGs expression increased, consistent with low- affinity binding of mGs to either β2ARs or the plasma membrane. Stimulation with a saturating concentration of isoproterenol led to a pronounced increase in energy transfer that was proportionally greater when NES–venus–mGs expression was lower (Fig. 2A). BRET in unstimulated cells approaches the BRET observed in agonist-stimulated cells when NES–venus–mGs expression is high. This suggests that the former signal is largely due to specific binding to β2AR–Rluc8 rather than nonspecific membrane binding, as specific and nonspecific signals would be expected to be additive. In the presence of isoproterenol, the BRET signals were nearly maximal when NES–venus–mGs expression was low, again consistent with stable, high-affinity β2AR–mGs complexes under these conditions. However, a shallow increase in BRET efficiency in the presence of agonist could still be discerned as NES–venus–mGs expression increased, consistent with a superimposed (and much smaller) low-affinity binding component (Fig. 2A). The origin of this second component is uncertain, but we speculate that it represents low-affinity binding of NES–venus–mGs to β2AR–Rluc8 receptors that are located in intracellular compartments (e.g. the Golgi apparatus) and therefore do not have access to extracellular isoproterenol.
Figure 2.
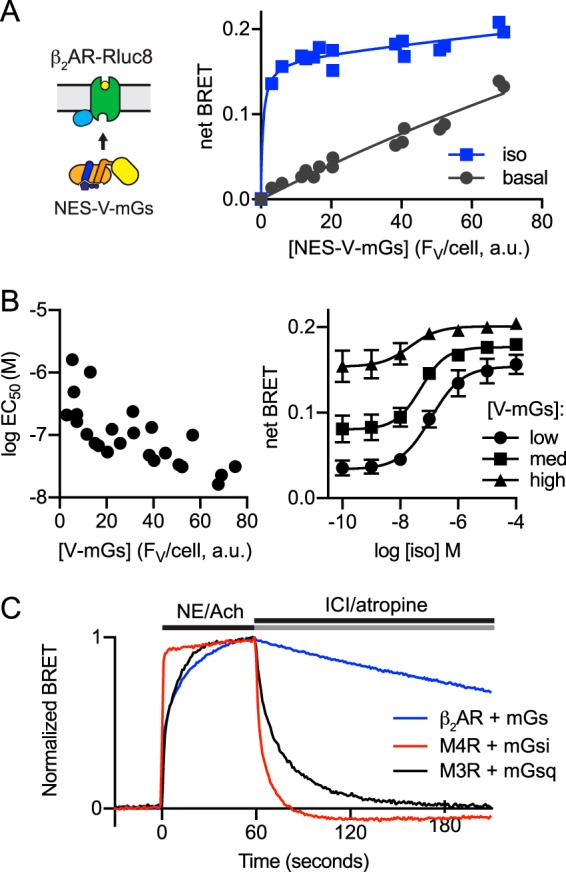
BRET between β2AR–Rluc8 and NES–venus–mGs. A, net BRET is plotted versus mean NES–venus–mGs fluorescence intensity per cell (FV, arbitrary units (a.u.)) for control cells and cells stimulated with 10 μm isoproterenol (iso). Cells were transfected with a constant amount of DNA encoding β2AR–Rluc8, and an increasing amount of DNA encoding NES–venus–mGs. Data are fitted to a two-site–specific binding equation, and data points from three independent experiments are superimposed. B, log EC50 is plotted versus mean NES–venus–mGs fluorescence intensity per cell (FV, arbitrary units) for five independent experiments with five different expression levels each (left). Example concentration-response curves are shown for cells expressing low (EC50 = 116 nm), medium (EC50 = 52 nm), and high (EC50 = 22 nm) levels of NES–venus–mGs (right); mean ± S.E. of three independent experiments. C, normalized BRET is plotted versus time for cells expressing β2AR-, M4R-, and M3R-Rluc8 together with NES–venus–mGs, –mGsi, and –mGsq; acetylcholine (100 μm; Ach), (−)-norepinephrine (10 μm), ICI 118,551 (10 μm), and atropine (10 μm) were added as indicated. Traces are the average of 4–7 experiments.
Mini G proteins functionally mimic the nucleotide-empty, GPCR-bound state of G protein heterotrimers (6), and therefore, mG and agonist binding to GPCRs should be mutually cooperative. Consistent with this expectation, we found that increasing NES–venus–mGs expression led to a 5–10-fold leftward shift (decreased EC50) in isoproterenol versus BRET concentration-response curves (Fig. 2B). As noted above, increasing NES–venus–mGs expression also increased basal BRET signals and decreased the assay's dynamic range. Therefore, interactions between mG proteins and GPCRs are sensitive to mG protein abundance in a manner that is consistent with the allosteric model of GPCR–G protein-coupling (12).
We next tested the reversibility of agonist-induced recruitment of mG proteins by measuring BRET during sequential application of an agonist and an antagonist or inverse agonist. We found that β2AR–Rluc8/NES–venus–mGs complexes were quite stable in the presence of norepinephrine and required more than 15 min to dissociate after addition of the inverse agonist ICI 118,551 (Fig. 2C). This is much slower than dissociation of receptor–heterotrimer complexes in intact cells (2), and it likely reflects stabilization of the orthosteric ligand-binding site by the presence of a surrogate (mG protein) that mimics a nucleotide-empty G protein (13). In contrast, muscarinic acetylcholine M3R–Rluc8/NES–venus–mGsq and M4R–Rluc8/NES–venus–mGsi complexes dissociated much more rapidly after addition of atropine (Fig. 2C), indicating that the stability of agonist–receptor–mG complexes is widely variable.
One practical advantage of assays that directly monitor GPCR–transducer coupling as opposed to downstream signals is their ability to report both ligand potency and efficacy without the potential confounds of spare receptors or assay readouts that are not linearly related to efficacy. We found that BRET between β2AR–Rluc8 and NES–venus–mGs accurately reported the difference in potency of the full agonists (−)-epinephrine and (−)-norepinephrine at this receptor, as well as weak partial agonist activity of ligands that are typically classified as partial agonists (pindolol) or antagonists (alprenolol) (14). Partial agonist activity of alprenolol is somewhat surprising but consistent with a previous report that binding of this ligand to β2AR is promoted by nanobody 80 (Nb80), a G protein surrogate that stabilizes the active state of the receptor (15). Notably, the inverse agonist ICI 118,551 decreased BRET between β2AR–Rluc8 and NES–venus–mGs (Fig. 3A), again supporting the notion that in unstimulated cells this signal at least partly reflects specific binding of NES–venus–mGs to ligand-free β2AR–Rluc8. We also found that iperoxo induced a greater maximum BRET signal between M3R–Rluc8 and NES–venus–mGsq than the native ligand acetylcholine (Fig. 3B). This suggests that the former ligand acts as a superagonist at this receptor, similar to what has been reported for the M2 acetylcholine receptor (16). Taken together, these results suggest that mG proteins report the full range of ligand efficacy at GPCRs.
Figure 3.
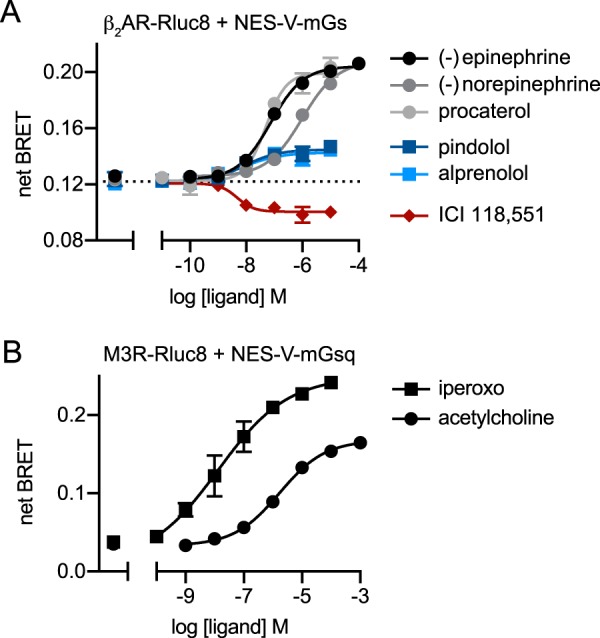
BRET between GPCRs and mG proteins reports the full range of ligand efficacy. Net BRET between β2AR–Rluc8 and NES–venus–mGs (A) and M3R–Rluc8 and NES–venus–mGsq (B) is plotted versus log concentration for the indicated ligands and fitted to a four-parameter logistic equation; mean ± S.E. of four independent experiments. Data points at the far left of these panels represent vehicle controls.
Mini G protein subtypes maintain appropriate coupling specificity
Because there are four families of Gα subunits, it was necessary to develop mG proteins that could be surrogates for heterotrimers from each family. The mutations incorporated into mGs were transferable to some Gα subunits (e.g. G12) but not others (e.g. Gq and Gi1) (7), and therefore mGsq and mGsi chimeras were developed wherein specificity-determining residues in mGs were replaced with residues corresponding to Gq and Gi1. In vitro, these chimeras gain coupling to Gq–coupled and Gi–coupled receptors, respectively, and lose coupling to Gs–coupled receptors (7). To demonstrate the ability of mG protein subtypes to couple to appropriate GPCRs in cell-based assays, we profiled BRET between four NES–venus–mG variants (mGs, mGsi, mGsq, and mG12) expressed at similar levels (53 ± 21, 59 ± 15, 36 ± 14, and 42 ± 16 arbitrary fluorescence units, respectively; mean ± S.D., n = 4) and four receptors that collectively couple to all four G protein subtypes. We found that mG proteins maintained appropriate coupling specificity as defined by the primary transducer annotation in the BPS/IUPHAR Guide to Pharmacology (Fig. 4A) (14). Importantly, mG proteins reported not only known primary coupling interactions (e.g. β2AR and mGs) but also known secondary coupling interactions with either lower potency or maximal response (e.g. β2AR and mGsi). We have observed appropriate subtype-specific coupling of mG proteins to several additional receptors (Fig. 4B), and we have not observed examples of clearly inappropriate coupling, suggesting that the changes made to mGsi and mGsq included key specificity determinants. These results suggest that mG proteins will be useful for quantifying the efficiency of coupling between GPCRs and G protein subtypes.
Figure 4.

Mini G protein subtypes maintain appropriate coupling specificity. A, net BRET to four different NES–venus–mG subtypes is plotted versus log ligand concentration for β2-adrenergic receptors (β2AR–Rluc8), M4 and M3 acetylcholine receptors (M4R-Rluc8 and M3R-Rluc8), and endothelin A receptors (ETA-Rluc8). Ligands are isoproterenol (iso), acetylcholine (Ach), and endothelin-1 (ET-1); mean ± S.E. of 3–4 independent experiments. Data points at the far left of each panel represent vehicle controls. B, heat maps representing normalized maximal BRET (which includes both constitutive and agonist-induced signals, normalized to the best-responding mG protein) for 12 receptors (fused to Rluc8) paired with NES–venus–mG proteins. Heat maps for canonical Gs–, Gi/o–, and Gq–coupled receptors are shown in blue, red, and black, respectively; n = 3–5 independent experiments for each receptor.
Indeed, when we extended this analysis to other receptors, we noticed secondary coupling interactions that were previously unknown or unappreciated. For example, we found that both D1 and D5 dopamine receptors (D1R and D5R) coupled primarily to mGs but also secondarily to mGsi (Fig. 5A). Other closely-related Gs–coupled monoamine receptors (β2AR and β1AR) are known to couple to both Gs and Gi/o heterotrimers, but we found only one previous report of D1R coupling to Gi (17) and no reports of D5R coupling to Gi. To verify D1R and D5R coupling to Gi proteins, we measured BRET between luciferase-tagged receptors and “empty” (nucleotide-free) heterotrimers consisting of Gβγ-venus and either Gαs or Gαi1. To minimize contributions from endogenous Gα subunits, we used HEK cells with CRISPR/Cas9-mediated deletion of Gαs, Gαq/11, and Gα12/13 subunits (18). Minimal BRET signals were generated when only the remaining endogenous Gα subunits were available to form heterotrimers with overexpressed Gβγ-venus (control in Fig. 5B), either with or without coexpression of pertussis toxin S1 subunit to uncouple endogenous Gαi/o subunits. In contrast, substantial agonist-dependent BRET signals were observed when either Gαs or Gαi1 were coexpressed with Gβγ–venus (Fig. 5B). For comparison, we also studied coupling of mG proteins and empty heterotrimers to D2 dopamine receptors, and we found that these receptors, as expected, coupled to both mGsi and Gi1 heterotrimers but not mGs or Gs heterotrimers (Fig. 5A). Although caution is warranted with respect to drawing conclusions based solely on mG proteins, our results suggest that these tools will be useful for studying G protein–coupling specificity. Our results also suggest that Gs–coupled adrenergic and dopamine receptors share the property of dual coupling to Gs and Gi/o heterotrimers, and therefore the possibility that Gi/o heterotrimers mediate some of the actions of D1R and D5R warrants further study.
Figure 5.
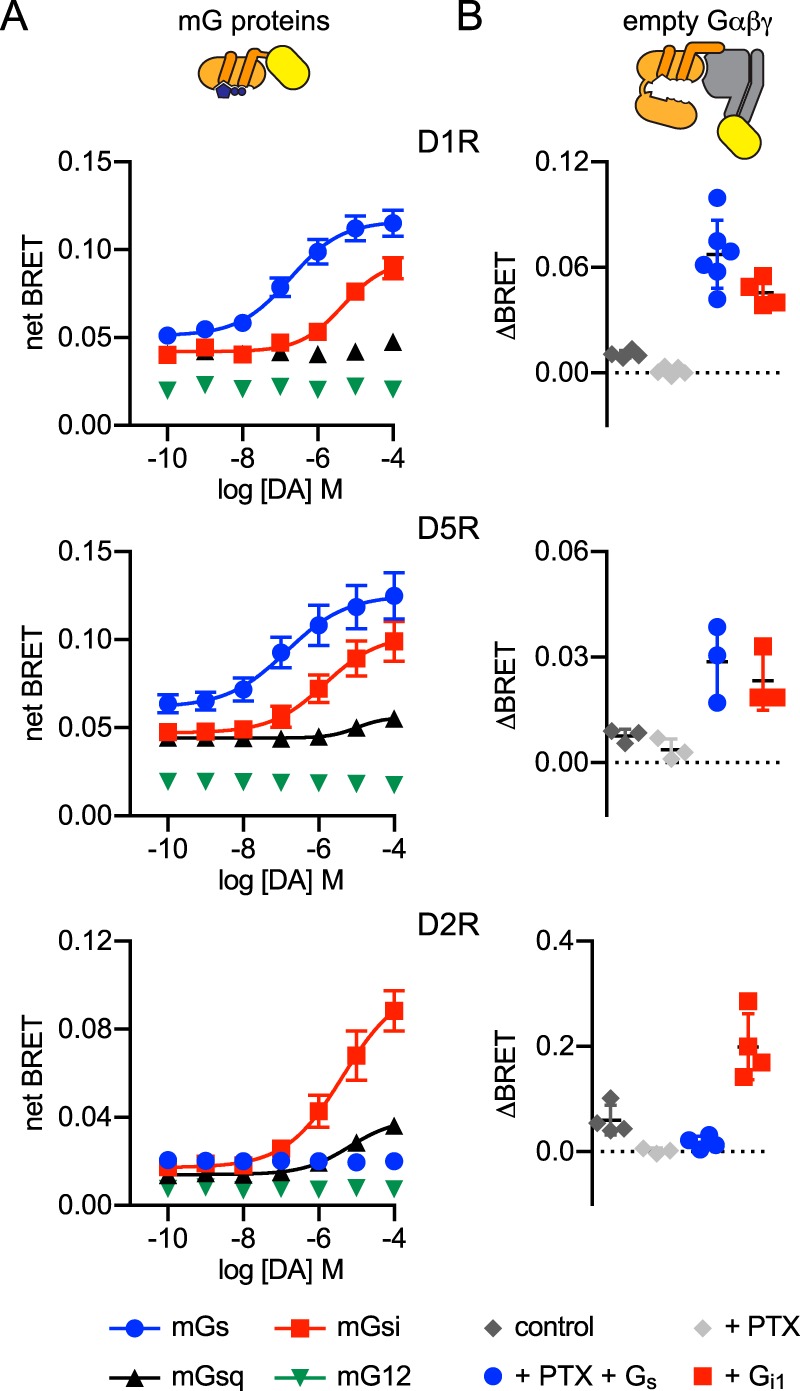
Secondary coupling of Gs–coupled dopamine receptors to mGsi and Gi1 heterotrimers. A, recruitment of mG proteins to dopamine receptors. Net BRET between D1R–, D5R–, or D2R–Nluc and four different NES–venus–mG subtypes in response to dopamine (DA) is shown; mean ± S.E. of 5–7 independent experiments. B, recruitment of empty heterotrimers to dopamine receptors. The difference (ΔBRET) between net BRET observed in the presence of 0.5 mm GDP alone and in the presence of apyrase and dopamine (100 μm) is shown. Cells lacking endogenous Gαs, Gαq, and Gα12 subunits expressed D1R-, D5R-, or D2R-Rluc8 and heterotrimers consisting of Gβγ–venus and the remaining endogenous Gα subunits (control) or overexpressed Gαs or Gαi1. In some experiments cells also expressed the S1 subunit of pertussis toxin (PTX); mean ± S.D. of 3–6 independent experiments.
Mini G proteins bind to active GPCRs in intracellular compartments
Nanobodies raised against active-state GPCRs have been used to detect active receptors in cells, including receptors located in intracellular compartments (8, 19). Not surprisingly, we found that mG proteins could be used in a similar manner to indicate GPCR activation in intracellular compartments. For example, CMV promoter-driven overexpression of cerulean-tagged A1-adenosine receptors (cerulean–A1R) often led to accumulation of this receptor in perinuclear compartments that we presumptively identified as the Golgi apparatus. Stimulation with adenosine recruited NES–venus–mGsi not only to the plasma membrane but also to the Golgi apparatus (Fig. 6A). The onset of NES–venus–mGsi recruitment to the Golgi was delayed by ∼5 s compared with the onset of NES–venus–mGsi recruitment to the plasma membrane (Fig. 6B). To confirm the presence of active A1Rs in the Golgi apparatus, we measured BRET between the luciferase NanoLuc fused to mGsi (NES–Nluc–mGsi) and venus-tagged acceptor molecules directed specifically to either the plasma membrane (venus–kras) or the Golgi apparatus (venus–giantin) (11) in cells expressing unlabeled A1Rs (Fig. 6C). Adenosine produced a concentration-dependent increase in BRET to both membrane markers, although this effect was less potent for recruitment to the Golgi apparatus (Fig. 6C). Taken together, these results suggest that extracellular adenosine has rapid access to the Golgi lumen in HEK 293 cells and that overexpressed A1Rs are functional in this compartment. The former observation is somewhat surprising in light of the hydrophilic character of adenosine (calculated octanol-water partition coefficient = −1.1) and suggests that HEK 293 cells express nucleoside transporters capable of delivering adenosine to the Golgi lumen (19, 20). Using a similar approach, we could also follow the accumulation of active β2ARs in early endosomes after prolonged stimulation with agonist (Fig. 6D) (8).
Figure 6.

Mini G proteins are recruited to active receptors at the Golgi apparatus. A, confocal images of cells expressing cerulean-tagged A1-adenosine receptors (left) and NES–venus–mGsi before (center) and after (right) stimulation with 100 μm adenosine. Some cells retain significant cerulean–A1R in the Golgi apparatus, and stimulation with adenosine recruits NES–venus–mGsi to this compartment (orange arrowheads) as well as to the plasma membrane (red arrowhead). Scale bar, 10 μm. B, mean NES–venus–mGsi fluorescence (FV, arbitrary units; ± S.E.) at the plasma membrane, Golgi apparatus, and in the cytosol plotted against time for nine cells similar to those shown in A. Accumulation of NES–venus–mGsi at the Golgi apparatus was delayed ∼5 s compared with the plasma membrane. C, BRET between NES–NanoLuc–mGsi and either venus-kras (V-kras) at the plasma membrane or venus-giantin (V-giantin) at the Golgi apparatus (GA) in response to stimulation of unlabeled A1Rs; mean ± S.D. of three independent experiments. D, BRET between NES-Nluc-mGs and the early endosome marker venus-rab5 is plotted versus time after stimulation of unlabeled β2AR with 10 μm isoproterenol; mean ± S.E. of four independent experiments.
Mini G proteins support luciferase complementation
For many screening applications, split luciferase reporters are preferred because of their single wavelength output, high signal/background ratio, and high sensitivity. One recently-developed technology is complementation of 11-amino acid (SmBit) and 18-kDa (LgBit) fragments of the engineered luciferase NanoLuc (Nluc) (21). The affinity of SmBit for LgBit is low enough that efficient complementation in cells requires fusion of these fragments to interacting proteins. We explored the possibility of using this system to report the agonist-dependent interaction of mG proteins and GPCRs by fusing LgBit and SmBit fragments to the N terminus of mG proteins and the C terminus of β2AR. Between the two possible orientations, we found that the most efficient complementation took place when LgBit was fused to mG proteins (e.g. LgBit-mGs), and SmBit was fused to the receptor (β2AR–SmBit). In individual experiments, agonist stimulation produced as much as a 20-fold increase in luminescence intensity. As was the case with BRET assays, NanoLuc complementation faithfully reported full agonist, partial agonist, and inverse agonist activity at β2AR-SmBit (Fig. 7A). This strategy was also applicable to LgBit-mGsi, -mGsq, and -mG12, as all of these fusion proteins supported NanoLuc complementation with the promiscuous endothelin-A receptor, ETAR-SmBit (Fig. 7B). These results suggest that mG proteins should serve as useful vehicles for protein complementation assays.
Figure 7.
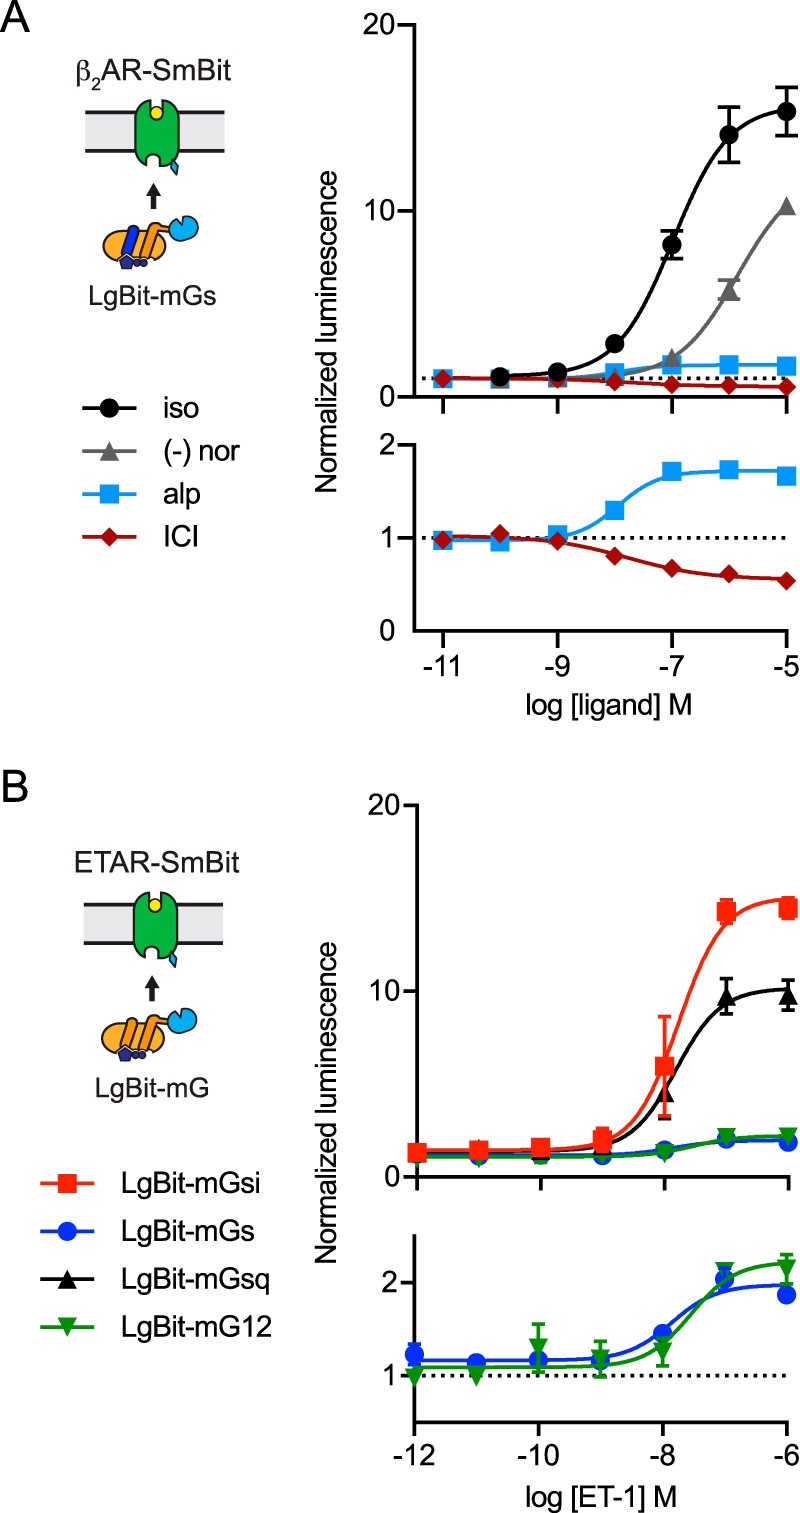
Split luciferase complementation driven by mGs. A, total luminescence (normalized) emitted by cells cotransfected with β2AR-SmBit and LgBit-mGs is plotted versus ligand concentration for isoproterenol (iso), (−)-norepinephrine (nor), alprenolol (alp), and ICI 118,551 (ICI); mean ± S.E. of 4–13 independent experiments. B, total luminescence (normalized) emitted by cells cotransfected with ETAR–SmBit and four different LgBit–mG proteins is plotted versus the concentration of endothelin-1 (ET-1); mean ± S.D. of four independent experiments.
In summary, although mG proteins originated as G protein surrogates for X-ray crystallography, their unique features present many opportunities for applications other than structural biology. In cellular assays, mG proteins should be useful for studying the determinants of receptor–G protein-coupling specificity, biased ligands, and activation of receptors at different subcellular locations. We expect that many additional uses will be found for mG proteins in cells and cell extracts and that mG proteins will prove to be valuable tools for diverse studies of GPCR biology.
Experimental procedures
Plasmid DNA constructs
Human codon-optimized fragments encoding mG sequences (7) were synthesized as gBlocks (Integrated DNA Technologies, Coralville, IA), amplified by PCR, and subcloned into the vector pVenus-C1 using BglII and EcoRI to produce venus–mG constructs. A nuclear export sequence and linker (underlined) (MLQNELALKLAGLDINKTGGSG) was later added to the N terminus of venus by QuikChange (Agilent Technologies, Santa Clara, CA) PCR insertional mutagenesis to produce NES–venus–mG constructs. A similar strategy was used to produce NES–Nluc–mG plasmids using the vector pNluc–C1. LgBit–mG constructs were made by amplifying mG fragments by PCR and subcloning into the vector pBiT1.1-N (Promega Corp., Madison, WI) with XhoI and EcoRI. β2AR–SmBit was made by adding a linker and SmBit (GGSGVTGYRLFEEIL) to the C terminus of the β2AR using QuikChange PCR. Additional GPCR–SmBit constructs were derived from β2AR–SmBit using a BamHI site incorporated into the GGSG linker. Plasmids encoding Gα subunits were obtained from cdna.org (Bloomsburg University, Bloomsburg, PA). A plasmid encoding the S1 subunit of pertussis toxin was kindly provided by Stephen R. Ikeda (NIAAA, National Institutes of Health, Rockville, MD). Plasmids encoding cerulean–TM–venus, venus–kras, venus–rab5, venus–giantin, and Gβγ–venus have been described previously and were used in this study under conditions that are essentially the same as described previously (11, 22–25). Several different GPCR–luciferase constructs were made by appending either Rluc8 or Nluc directly to the receptor C terminus either by QuikChange PCR or by subcloning into pRluc8-N1 or pNluc-N1 vectors. GPCR sequences were obtained either from cdna.org, as a gift from Jonathan Javitch (Columbia University, New York) or as a gift from Bryan Roth (26) (Addgene, PRESTO-Tango kit 1000000068). All plasmid constructs were verified by Sanger sequencing.
Cell culture and transfection
HEK 293 cells (ATCC) were propagated in plastic flasks on 6-well plates and on polylysine-coated glass coverslips according to the supplier's protocol. HEK 293 cells with targeted deletion of GNAS, GNAL, GNAQ, GNA11, GNA12, and GNA13 (ΔGs/ΔGq/ΔG12 cells) were derived and authenticated as described previously (18). Cells were transiently transfected in growth medium using linear polyethyleneimine (Mr 25,000; Polysciences Inc., Warrington, PA) at an nitrogen/phosphate ratio of 20 and were used for experiments 12–48 h later. Up to 3 μg of plasmid DNA was transfected in each well of a 6-well plate.
Confocal imaging
Cells grown on 25-mm round coverslips were transferred to an imaging chamber and washed with DPBS. Drug solutions were added directly to the chamber by pipetting. Confocal images were acquired using a Leica (Wetzlar, Germany) SP8 scanning confocal microscope and a ×63, 1.4 NA objective. Venus was excited with a 488-nm diode laser and detected at 500–650 nm. Cerulean was excited with a 448-nm diode laser and detected at 460–520 nm.
BRET, luminescence, and fluorescence measurements
Cells were washed with DPBS, harvested by trituration, and transferred to opaque black or white 96-well plates containing diluted drug solutions. For assays with nucleotide-free heterotrimers (Fig. 4), cells were washed with permeabilization buffer containing 140 mm KCl, 10 mm NaCl, 1 mm MgCl2, 0.1 mm K-EGTA, 20 mm NaHEPES (pH 7.2), harvested by trituration, and permeabilized in the same buffer containing 10 μg ml−1 high purity digitonin (EMD Millipore, Burlington, MA). Measurements were made from permeabilized cells supplemented either with GDP (0.5 mm) or apyrase (2 units ml−1; Sigma) and agonist. BRET and luminescence measurements were made using a Mithras LB940 photon-counting plate reader (Berthold Technologies GmbH, Bad Wildbad, Germany). Coelenterazine h (5 μm; Nanolight, Pinetop, AZ) or furimazine (Nano-Glo; 1:1000, Promega Corp.) were added to all wells immediately prior to making measurements with Rluc8 and Nluc (or Nluc fragments), respectively. Raw BRET signals were calculated as the emission intensity at 520–545 nm divided by the emission intensity at 475–495 nm. Net BRET was this ratio minus the same ratio measured from cells expressing only the BRET donor. NES–venus–mG fluorescence in Fig. 2 was measured using a Guava 6HT/2L flow cytometer (excitation 488 nm, detection 525/30 nm) and reported as average fluorescence from all positive cells.
Author contributions
Q. W., N. O., and N. A. L. investigation; Q. W., N. O., A. I., R. N., B. C., and C. G. T. writing-review and editing; A. I., R. N., B. C., and C. G. T. resources; A. I., C. G. T., and N. A. L. funding acquisition; N. A. L. supervision; N. A. L. writing-original draft; N. A. L. project administration.
Acknowledgments
We thank Steve Ikeda, Jonathan Javitch, and Bryan Roth for providing plasmid DNA used in this study. We thank Roger Sunahara for permission to use and modify his heterotrimer cartoons.
This work was supported in part by National Institutes of Health Grants GM078319 and GM109879 (to N. A. L.) and Medical Research Council, European Research Council, and Heptares Therapeutics Grants MC_U105197215 and EMPSI 339995 (to C. G. T.). C. G. T. is a shareholder and member of the scientific advisory board of Heptares Therapeutics. The content is solely the responsibility of the authors and does not necessarily represent the official views of the National Institutes of Health.
This article was selected as one of our Editors' Picks.
- GPCR
- G protein–coupled receptor
- BRET
- bioluminescence resonance energy transfer
- mG
- mini G
- NES
- nuclear export sequence
- DPBS
- Dulbecco's phosphate-buffered saline
- Nluc
- NanoLuc
- β2AR
- β2-adrenergic receptor
- D1R
- D1 dopamine receptor
- D5R
- D5 dopamine receptor
- A1R
- A1-adenosine receptor.
References
- 1. Pierce K. L., Premont R. T., and Lefkowitz R. J. (2002) Seven-transmembrane receptors. Nat. Rev. Mol. Cell Biol. 3, 639–650 10.1038/nrm908 [DOI] [PubMed] [Google Scholar]
- 2. Lohse M. J., Nuber S., and Hoffmann C. (2012) Fluorescence/bioluminescence resonance energy transfer techniques to study G-protein-coupled receptor activation and signaling. Pharmacol. Rev. 64, 299–336 10.1124/pr.110.004309 [DOI] [PubMed] [Google Scholar]
- 3. Barak L. S., Ferguson S. S., Zhang J., and Caron M. G. (1997) A β-arrestin/green fluorescent protein biosensor for detecting G protein-coupled receptor activation. J. Biol. Chem. 272, 27497–27500 10.1074/jbc.272.44.27497 [DOI] [PubMed] [Google Scholar]
- 4. Galés C., Rebois R. V., Hogue M., Trieu P., Breit A., Hébert T. E., and Bouvier M. (2005) Real-time monitoring of receptor and G-protein interactions in living cells. Nat. Methods 2, 177–184 10.1038/nmeth743 [DOI] [PubMed] [Google Scholar]
- 5. Hein P., Frank M., Hoffmann C., Lohse M. J., and Bünemann M. (2005) Dynamics of receptor/G protein coupling in living cells. EMBO J. 24, 4106–4114 10.1038/sj.emboj.7600870 [DOI] [PMC free article] [PubMed] [Google Scholar]
- 6. Carpenter B., and Tate C. G. (2016) Engineering a minimal G protein to facilitate crystallisation of G protein-coupled receptors in their active conformation. Protein Eng. Des. Sel. 29, 583–594 [DOI] [PMC free article] [PubMed] [Google Scholar]
- 7. Nehmé R., Carpenter B., Singhal A., Strege A., Edwards P. C., White C. F., Du H., Grisshammer R., and Tate C. G. (2017) Mini-G proteins: novel tools for studying GPCRs in their active conformation. PLoS ONE 12, e0175642 10.1371/journal.pone.0175642 [DOI] [PMC free article] [PubMed] [Google Scholar]
- 8. Irannejad R., Tomshine J. C., Tomshine J. R., Chevalier M., Mahoney J. P., Steyaert J., Rasmussen S. G., Sunahara R. K., El-Samad H., Huang B., and von Zastrow M. (2013) Conformational biosensors reveal GPCR signalling from endosomes. Nature 495, 534–538 10.1038/nature12000 [DOI] [PMC free article] [PubMed] [Google Scholar]
- 9. Nagai T., Ibata K., Park E. S., Kubota M., Mikoshiba K., and Miyawaki A. (2002) A variant of yellow fluorescent protein with fast and efficient maturation for cell-biological applications. Nat. Biotechnol. 20, 87–90 10.1038/nbt0102-87 [DOI] [PubMed] [Google Scholar]
- 10. Pfleger K. D., Seeber R. M., and Eidne K. A. (2006) Bioluminescence resonance energy transfer (BRET) for the real-time detection of protein-protein interactions. Nat. Protoc. 1, 337–345 10.1038/nprot.2006.52 [DOI] [PubMed] [Google Scholar]
- 11. Lan T.-H., Liu Q., Li C., Wu G., and Lambert N. A. (2012) Sensitive and high resolution localization and tracking of membrane proteins in live cells with BRET. Traffic 13, 1450–1456 10.1111/j.1600-0854.2012.01401.x [DOI] [PMC free article] [PubMed] [Google Scholar]
- 12. De Lean A., Stadel J. M., and Lefkowitz R. J. (1980) A ternary complex model explains the agonist-specific binding properties of the adenylate cyclase-coupled β-adrenergic receptor. J. Biol. Chem. 255, 7108–7117 [PubMed] [Google Scholar]
- 13. DeVree B. T., Mahoney J. P., Vélez-Ruiz G. A., Rasmussen S. G., Kuszak A. J., Edwald E., Fung J.-J., Manglik A., Masureel M., Du Y., Matt R. A., Pardon E., Steyaert J., Kobilka B. K., and Sunahara R. K. (2016) Allosteric coupling from G protein to the agonist-binding pocket in GPCRs. Nature 535, 182–186 10.1038/nature18324 [DOI] [PMC free article] [PubMed] [Google Scholar]
- 14. Alexander S. P., Christopoulos A., Davenport A. P., Kelly E., Marrion N. V., Peters J. A., Faccenda E., Harding S. D., Pawson A. J., Sharman J. L., Southan C., Davies J. A., and CGTP Collaborators. (2017) The concise guide to pharmacology 2017/18: G protein-coupled receptors. Br. J. Pharmacol. 174, S17–S129 10.1111/bph.13878 [DOI] [PMC free article] [PubMed] [Google Scholar]
- 15. Staus D. P., Strachan R. T., Manglik A., Pani B., Kahsai A. W., Kim T. H., Wingler L. M., Ahn S., Chatterjee A., Masoudi A., Kruse A. C., Pardon E., Steyaert J., Weis W. I., Prosser R. S., et al. (2016) Allosteric nanobodies reveal the dynamic range and diverse mechanisms of G-protein-coupled receptor activation. Nature 535, 448–452 10.1038/nature18636 [DOI] [PMC free article] [PubMed] [Google Scholar]
- 16. Schrage R., Seemann W. K., Klöckner J., Dallanoce C., Racké K., Kostenis E., De Amici M., Holzgrabe U., and Mohr K. (2013) Agonists with supraphysiological efficacy at the muscarinic M2 ACh receptor. Br. J. Pharmacol. 169, 357–370 10.1111/bph.12003 [DOI] [PMC free article] [PubMed] [Google Scholar]
- 17. Sidhu A., Sullivan M., Kohout T., Balen P., and Fishman P. H. (1991) D1 dopamine receptors can interact with both stimulatory and inhibitory guanine nucleotide binding proteins. J. Neurochem. 57, 1445–1451 10.1111/j.1471-4159.1991.tb08312.x [DOI] [PubMed] [Google Scholar]
- 18. Grundmann M., Merten N., Malfacini D., Inoue A., Preis P., Simon K., Rüttiger N., Ziegler N., Benkel T., Schmitt N. K., Ishida S., Müller I., Reher R., Kawakami K., Inoue A., et al. (2018) Lack of β-arrestin signaling in the absence of active G proteins. Nat. Commun. 9, 341 10.1038/s41467-017-02661-3 [DOI] [PMC free article] [PubMed] [Google Scholar]
- 19. Irannejad R., Pessino V., Mika D., Huang B., Wedegaertner P. B., Conti M., and von Zastrow M. (2017) Functional selectivity of GPCR-directed drug action through location bias. Nat. Chem. Biol. 13, 799–806 10.1038/nchembio.2389 [DOI] [PMC free article] [PubMed] [Google Scholar]
- 20. Young J. D. (2016) The SLC28 (CNT) and SLC29 (ENT) nucleoside transporter families: a 30-year collaborative odyssey. Biochem. Soc. Trans. 44, 869–876 10.1042/BST20160038 [DOI] [PubMed] [Google Scholar]
- 21. Dixon A. S., Schwinn M. K., Hall M. P., Zimmerman K., Otto P., Lubben T. H., Butler B. L., Binkowski B. F., Machleidt T., Kirkland T. A., Wood M. G., Eggers C. T., Encell L. P., and Wood K. V. (2016) NanoLuc complementation reporter optimized for accurate measurement of protein interactions in cells. ACS Chem. Biol. 11, 400–408 10.1021/acschembio.5b00753 [DOI] [PubMed] [Google Scholar]
- 22. Hollins B., Kuravi S., Digby G. J., and Lambert N. A. (2009) The C-terminus of GRK3 indicates rapid dissociation of G protein heterotrimers. Cell. Signal. 21, 1015–1021 10.1016/j.cellsig.2009.02.017 [DOI] [PMC free article] [PubMed] [Google Scholar]
- 23. Martin B. R., and Lambert N. A. (2016) Activated G protein Gαs samples multiple endomembrane compartments. J. Biol. Chem. 291, 20295–20302 10.1074/jbc.M116.729731 [DOI] [PMC free article] [PubMed] [Google Scholar]
- 24. Lan T. H., Kuravi S., and Lambert N. A. (2011) Internalization dissociates β2-adrenergic receptors. PLoS ONE 6, e17361 10.1371/journal.pone.0017361 [DOI] [PMC free article] [PubMed] [Google Scholar]
- 25. Fonseca J. M., and Lambert N. A. (2009) Instability of a class A G protein-coupled receptor oligomer interface. Mol. Pharmacol. 75, 1296–1299 10.1124/mol.108.053876 [DOI] [PMC free article] [PubMed] [Google Scholar]
- 26. Kroeze W. K., Sassano M. F., Huang X.-P., Lansu K., McCorvy J. D., Giguère P. M., Sciaky N., and Roth B. L. (2015) PRESTO-Tango as an open-source resource for interrogation of the druggable human GPCRome. Nat. Struct. Mol. Biol. 22, 362–369 10.1038/nsmb.3014 [DOI] [PMC free article] [PubMed] [Google Scholar]