

Abstract
Purpose
Imaging with [18F]fluorodeoxyglucose (FDG) –positron emission tomography (PET) allows early recognition of a response to agents that target key driver mutations in human cancer. We aimed to determine the metabolic response rate to vemurafenib in patients with advanced BRAF-mutant melanoma.
Patients and Methods
Baseline and day 15 FDG-PET was evaluated in 31 patients with advanced melanoma treated in a phase I study of dose escalation of vemurafenib (PLX06-02), which included four patients treated at subtherapeutic doses and 24 patients treated at 960 mg twice a day, which is the maximum-tolerated dose of vemurafenib.
Results
All 27 patients treated at potentially therapeutic levels had at least a partial metabolic response, and three patients achieved a complete metabolic response. In the 27 patients, there was an 80% ± 3% reduction in the maximum standardized uptake value (SUVmax) of target lesions and an 87% ± 3% decrease in the percentage of injected dose (%ID) in all identified disease sites. There was a positive correlation between %ID in all identified disease and target-lesion SUVmax (r2 = 0.66; P < .001) that indicated a significant homogeneity of the response between lesions in individual patients. Although no relationship was found between the reduction in target lesion SUVmax and best response according to RECIST (Response Evaluation Criteria in Solid Tumors), there was a trend for patients with greater reductions in uptake of FDG to have longer progression-free survival.
Conclusion
FDG-PET is a useful marker of an early biologic response to vemurafenib. Little variability in PET response was found between lesions in individual patients, which suggested minimal intrapatient molecular heterogeneity. FDG-PET is a useful tool for the evaluation of the biologic impact of inhibiting mutant BRAF and may allow for the more effective development of novel agents.
INTRODUCTION
The ability to target mutated oncogenes has been a significant therapeutic advance in oncology. Recent genomic efforts have identified mutations in oncogenic protein kinases, including BRAF, KIT, and RAS family members, in greater than 65% of cases of melanoma.1–4 The inhibition of kinase activity can induce high response rates as shown by the small molecules vemurafenib and imatinib that target mutated BRAF and KIT, respectively.5,6 In the case of vemurafenib, this has led to responses that are both more durable and associated with improved overall survival compared with conventional cytotoxic chemotherapy.7
The inhibition of oncogenic protein kinases with small molecules has led to a range of responses as detected by conventional imaging that do not always correlate with a clinical benefit in terms of the overall survival or progression-free survival (PFS). Indeed, the survival of patients with gastrointestinal stromal tumors treated with imatinib is similar regardless of whether the best response is stable disease or a partial response.8 Similar data exist for EGFR-mutated non–small-cell lung cancer.9–11 In contrast, the inhibition of activity of oncogenic proteins is associated with rapid metabolic responses as determined by functional imaging with FDG-PET that allows early detection of biologic effects of target inhibition that can be of substantial benefit in drug development and may also be predictive of survival.10–12
Preclinical studies have demonstrated that mutated BRAF kinase can activate signaling pathways that affect glucose metabolism including the LKB1-AMP kinase pathway and multiple pathways that regulate the expression of the GLUT1 glucose transporter.13–16 Therefore, we sought to determine whether inhibition of BRAF kinase with vemurafenib would induce rapid FDG-PET responses in patients with BRAF-mutant melanoma and whether this was predictive of the clinical outcome. Strikingly, 100% of patients treated with vemurafenib obtained an FDG-PET response at 15 days, which demonstrated the usefulness of this modality to act as an early marker of biologic response to the inhibition of the BRAF kinase. Importantly, responses showed little interlesional heterogeneity in the metabolic response within individual patients. These findings suggested a homogeneous biology, and primary resistance to vemurafenib in patients with BRAF-mutant melanoma is relatively unlikely to be related to failure to block signaling through this pathway.
PATIENTS AND METHODS
Study Participants and Data Collection
Eligible patients for this study included all patients who participated in a phase I dose escalation of vemurafenib (PLX06-02) who had completed both baseline and day 15 FDG-PET scans that were available for centralized analysis. The 31 eligible patients included 24 of 32 patients who participated in an extension cohort treated at the maximum-tolerated dose of 960 mg twice a day.5 For this cohort, FDG-PET was added to a routine response assessment according to RECIST (Response Evaluation Criteria in Solid Tumors) 1.0.17 The remaining seven eligible patients were from the previous dose-escalation cohort who underwent FDG-PET at the discretion of treating clinicians. These patients included four patients enrolled to receive 80 mg twice per day of the initial formulation with a day 15 area under the curve from 0 to 24 hours (AUC0-24 hours) less than 100 μM · h · (well below the AUC0-24 hours of 400 μM · h predicted to be associated with a response5,18), two patients who received 360 mg twice per day (with day 15 AUC0-24 hours > 600 μM · h), and one patient treated above the maximum-tolerated dose at 1,120 mg twice per day. Patient demographics and clinical characteristics are listed in Table 1, and day 15 AUC0-24 hours μM · h are listed in Table 2.
Table 1.
Patient Demographics and Clinical Characteristics
| Demographic or Characteristic | Vemurafenib ≥ 320 mg Twice a Day |
Subtherapeutic No. of Patients | |
|---|---|---|---|
| No. of Patients | % | ||
| No. of patients | 27 | 4 | |
| Age, years | |||
| Median | 51 | ||
| Range | 30–67 | 49–81 | |
| Sex | |||
| M | 17 | 63 | 4 |
| F | 10 | 37 | 0 |
| ECOG PS | |||
| 0 | 12 | 44 | 1 |
| 1 | 17 | 56 | 3 |
| Stage | |||
| M1a | 5 | 19 | 0 |
| M1b | 3 | 11 | 2 |
| M1c | 19 | 70 | 2 |
| Baseline LDH | |||
| < 1 × ULN | 14 | 56 | NA |
| 1.0-2.0 × ULN | 7 | 28 | NA |
| > 2 × ULN | 4 | 16 | NA |
| No. of previous therapies | |||
| 0 | 6 | 22 | 1 |
| 1 | 9 | 33 | 0 |
| 2 | 3 | 11 | 0 |
| ≥ 3 | 9 | 33 | 3 |
Abbreviations: ECOG PS, Eastern Cooperative Oncology Group performance status; LDH, serum lactate dehydrogenase; NA, not applicable; ULN, upper limit of normal.
Table 2.
Response Assessment by Using FDG-PET and CT Scans
| Parameter | Vemurafenib≥ 320 mg Twice a Day(N = 27) |
Vemurafenib Subtherapeutic (n = 4) |
P | ||
|---|---|---|---|---|---|
| Mean | SEM | Mean | SEM | ||
| Drug exposure day 15, μM/h | 1,683 | 29 | 69 | 8 | .001 |
| Change in SUVmax of target lesions, % | 80 | 3 | 8 | 9 | < .001 |
| Change in percentage of injected dose in target lesions, % | 84 | 3 | 1 | 20 | < .001 |
| Change in percentage of injected dose in whole-body lesions, % | 87 | 3 | 5 | 20 | < .001 |
| Metabolic disease volume, mL | 816 | 274 | 597 | 506 | .66 |
| Range | 7–6,945 | 16–2,113 | |||
| Overall assessment of FDG response | |||||
| Complete metabolic response | |||||
| No. of patients | 3 | 0 | |||
| % | 11 | ||||
| Partial metabolic response | |||||
| No. of patients | 24 | 1 | |||
| % | 89 | ||||
| No response, No. of patients | 0 | 3 | |||
| Best overall response according to RECIST | |||||
| CR | |||||
| No. of patients | 2 | 0 | |||
| % | 7 | ||||
| PR | |||||
| No. of patients | 21 | 1 | |||
| % | 78 | ||||
| SD | |||||
| No. of patients | 3 | 2 | |||
| % | 11 | ||||
| PD | |||||
| No. of patients | 1 | 1 | |||
| % | 4 | ||||
Abbreviations: CR, complete response; CT, computed tomography; FDG, [18F]fluorodeoxyglucose; PD, progressive disease; PET, positron emission tomography; PR, partial response; SD, stable disease; SUVmax, maximum standardized uptake value.
Design
The predefined primary end point of this substudy of the PLX06-02 study was the response rate defined by a 25% reduction in the maximum standardized uptake value (SUVmax) by using European Organisation for Research and Treatment of Cancer criteria.19 It is important to indicate that the development of the 25% cutoff for response was based largely on reproducibility of the determination of SUVmax rather than clinical or biologic criteria and, thus, has limited value in the evaluation of the secondary and exploratory end points of this study. The secondary and exploratory end points were as follows: the relationship between the reduction in SUVmax and time to progression (RECIST 1.0), the relationship between the reduction in the percentage of injected dose (%ID) within the total tumor burden and time to progression, the relationship between the reduction in %ID in target lesions and %ID in all lesions, the relationship between the baseline metabolic tumor volume and time to progression, and the FDG-PET response rate to vemurafenib by using qualitative criteria (no response, partial metabolic response, and complete metabolic response). This study was approved by the institutional review boards/human research ethics committees of all participating institutions.
FDG-PET Scans and Imaging Analyses
FDG-PET scans were performed at baseline (1 to 21 days before commencement of vemurafenib) and day 15 after commencement of vemurafenib. Computed tomography scans were performed at baseline (1 to 21 days before commencement of vemurafenib) and on days 29 and 57 and then every 56 days. FDG-PET scans were performed after patients fasted for at least 6 hours, and plasma glucose levels were determined to document euglycemia. [18F]fluorodeoxyglucose (FDG) was administered intravenously according to weight (0.15 mCi/kg, ranging from 3 to 16 mCi) and images were acquired after a distribution time of approximately 60 minutes. Images were obtained from approximately the base of the skull to midthigh in all patients and also including extremities when clinically relevant. FDG-PET images were corrected for attenuation. DICOM (Digital Imaging and Communications in Medicine) -compliant data from all sites was anonymized and transferred to the central review site for analysis. Analysis was performed by using MARVn software version 2.16 (Peter MacCallum Cancer Centre, East Melbourne, Australia), which provided an automated volume-of-interest analysis on the basis of user-defined search regions and an iterative volume-growing approach on the basis of a user-defined threshold, set to a standardized uptake value of 2.5.20 Parameters evaluated included the SUVmax of uptake to five target lesions, SUVmax for all lesions, %ID in target lesions and all lesions, and metabolic tumor volume. The latter parameter was calculated by multiplying the number of abnormal voxels identified within the volume of interest by the known voxel volume. Conventional responses were assessed by using computed tomography scans, and responses were assessed by using modified RECIST 1.0 criteria as previously reported.5
Statistical Analysis
Analysis was performed by using Prism 5 (Version 5, 2007; GraphPad Software, La Jolla, CA). The t test was used to examine associations between categorical variables. Linear regression analysis was used for correlations of continuous data. PFS was calculated from the date of commencement of vemurafenib to the date of death or first progression as defined by using RECIST 1.017 or until censoring at the date of the last follow-up as of May 27, 2011.Overall survival was calculated from the date of commencement of vemurafenib to death as a result of any cause or until censoring at the date of last follow-up as of May 27, 2011. P ≤ 0.05 was considered significant.
RESULTS
Patient Characteristics
A total of 31 patients had baseline and day 15 FDG-PET scans as part of the phase I clinical trial of vemurafenib (PLX06-02).5 The cohort of patients is summarized in Table 1 and included 27 patients treated at therapeutic doses of vemurafenib ≥ 320 mg twice a day (mean AUC, 1683 ± 29 μmol/L · h) and four patients treated at lower doses who achieved subtherapeutic levels (mean AUC, 69 ± 8 μmol/L · h). Of the 27 patients who received a dose of vemurafenib that was predicted to inhibit BRAF signaling, two patients received 320 mg twice a day, 24 patients received 960 mg twice a day, which is the maximum-tolerated dose of vemurafenib, and one patient received 1120 mg twice a day, which is the maximum delivered dose of vemurafenib in the dose escalation study.5 All patients treated at greater than 320 mg of vemurafenib twice per day had exposure well above 400 μmol/L · h, which is the minimum exposure associated with tumor regression in preclinical models and responses in patients by using conventional imaging (Table 2).18,21 In contrast, four patients treated in the same study with vemurafenib 80 mg twice per day all had exposures less than 100 μmol/L · h, which is the minimum level associated with tumor stability in preclinical studies or the phase I study (Table 2).18,21 All patients evaluated in this study had the V600E mutation in BRAF.
The patient population was typical for patients with advanced melanoma; the median age of patients was 51 years, 63% of patients were men, and 70% of patients had stage M1C melanoma with visceral metastases and/or an increase of LDH. This patient population was highly pretreated with 78% of patients who had previous therapies for advanced melanoma, including 33% of patients with three or more previous therapies.
FDG-PET Response
By using the European Organisation for Research and Treatment of Cancer criteria for partial metabolic response for FDG-PET of a ≥ 25% reduction in SUVmax, 100% of patients treated with ≥ 320 mg of vemurafenib twice per day had a partial or complete metabolic response (Figs 1, 2 and Table 2). We quantified the response by using the following two techniques: first, we used the percentage reduction in SUVmax of up to five predefined target lesions, and second, we used the percentage reduction in the %ID of FDG-PET in both target lesions and all identifiable lesions in the field of view by using PET image-analysis software MARVn.20 The %ID calculation reflected both the metabolic volume and intensity of uptake in the viable tumor mass and, as such, provided a global measure of metabolic activity in the residual viable cell burden by using FDG-PET.
Fig 1.

Examples of [18F]fluorodeoxyglucose response in patients with high metabolic disease volume. (A) Baseline metabolic disease volume of 3,132 mL. (B) Day 15 example of a complete metabolic response. When no voxels in the volume of interest had a standardized uptake value > 2.5, the SUVmax of target lesions was defined as having decreased by 100%.
Fig 2.

(A) [18F]fluorodeoxyglucose–positron emission tomography (FDG-PET) response on day 15 as calculated by using the maximum standardized uptake value (SUVmax). European Organisation for Research and Treatment of Cancer criteria define a partial metabolic response as a 25% reduction in the SUVmax (dashed line). Patients treated at subtherapeutic doses are shown in gold. (B) Best overall response as determined by conventional assessment by using RECIST 1.0 with a partial response being a 30% reduction in tumor diameters (dashed line). Each column represents the same individual patient shown directly above in A.
On average, the SUVmax was reduced by 80% on day 15 of therapy in target lesions. This corresponded to an 84% reduction in the %ID in target lesions. A similar 87% reduction in uptake of FDG was observed when %ID of the entire disease burden was determined. Three patients obtained a complete metabolic response, which was defined as the resolution of FDG uptake within the tumor volume so that it was indistinguishable from the surrounding normal tissue or, in the case of hepatic lesions, had an SUVmax less than 2.5. Three of the four patients in the group treated at the subtherapeutic dose failed to achieve a partial metabolic response, with a single patient who achieved a 29% reduction in the SUVmax in target lesions.
Responses to vemurafenib were obtained independently of the metabolic disease volume with patients who obtained responses despite having up to 6.9 L of metabolically active tumor. One patient achieved a complete metabolic response who had greater than 3.1 L of metabolic disease volume at baseline (Fig 1). Overall, 85% of patients in this cohort had complete or partial responses according to RECIST criteria. The two patients who achieved complete responses according to RECIST criteria had 97% and 96% reductions in %ID of FDG in total body disease at day 15. Only one patient had a best response of progressive disease according to RECIST criteria, which progressed early at 28 days, and this patient had a partial metabolic response at day 15 of 79% with a 65% reduction in the %ID of FDG in total body disease. Overall, there was no relationship between the extent of metabolic response determined by FDG-PET and the best response obtained according to RECIST (Fig 2). Similarly, there was no relationship between the time to response according to RECIST and the metabolic response. We found that 67% of patients who received more than 320 mg of vemurafenib twice per day achieved a partial RECIST response by the second imaging assessment at 56 days. Taken together, these data suggested that, although an FDG-PET response to vemurafenib occurred in all patients with V600E mutated melanoma, which suggest a successful target inhibition, this was not always sufficient to induce responses by using conventional imaging.
Molecular Homogeneity of Response
It was notable that by both a qualitative and quantitative assessment of FDG-PET response, there was little heterogeneity in the degree of response between lesions in an individual patient (Fig 3B). To more formally assess this observation, we compared the percentage reduction in SUVmax in target lesions to the percentage reduction in %ID in total body lesions in the field of view. There was highly significant correlation between these parameters with an r2 of 0.66 (P < .001). Similar results were obtained by comparing the percentage reduction in %ID in target lesions with that in all lesions in the field of view. Collectively, these data suggest minimal interlesional molecular heterogeneity with respect to the effects of BRAF inhibition by using vemurafenib.
Fig 3.
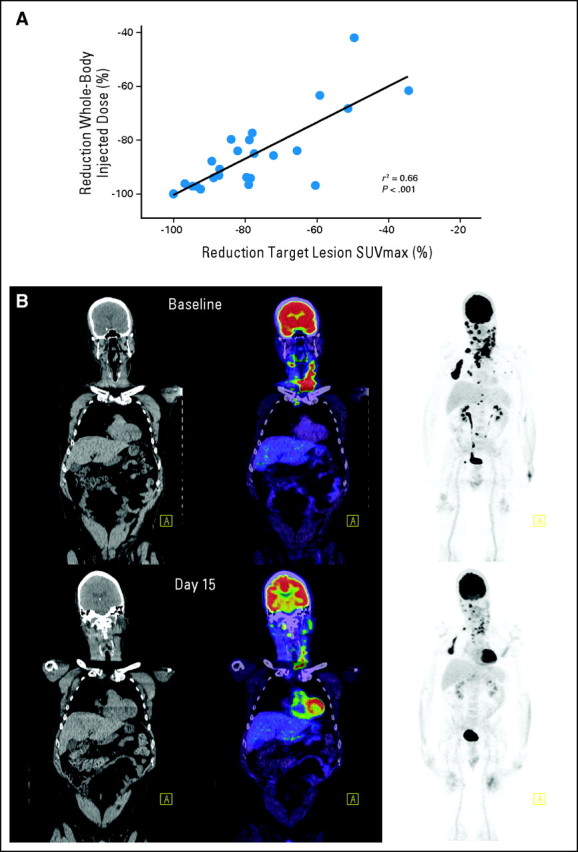
Homogeneity of molecular response. (A) High correlation between the reduction in the maximum standardized uptake value (SUVmax) between target lesions and the percentage of injected dose in all evaluable sites of disease. Similar results were obtained when the percentage of injected dose in target lesions was compared with the percentage of injected dose in whole-body disease (r2 = 0.64; P < .001). (B) Example of homogeneity of interlesional response in a patient with a large number of lesions.
FDG-PET Response and Patient Survival
Although partial metabolic responses were universal in this patient cohort, there was some variation in the degree of response with the reduction in SUVmax varying from 34% to 100%. Therefore, we examined whether there was a relationship between the metabolic response (SUVmax or %ID) at day 15 and the duration of response according to RECIST criteria, PFS, and overall survival. We did not observe any definitive relationship between the FDG-PET response at day 15 and these parameters. However, on the basis of the median reduction in SUVmax of 82%, the median PFS in the group less than this median reduction was 183 days compared with 484 days in patients who achieved a greater than 82% reduction in the SUVmax (Fig 4). The median reduction in SUVmax was chosen as the cutoff prospectively before any analyses were undertaken to avoid the bias of multiple analyses in a limited data set. Examination of the PFS curves revealed no difference in early progression between the two groups; however, intriguingly, there was some separation of the curves after 200 days. Although, by using the Wilcoxon test, hazard ratios between the groups were not significantly different (hazard ratio, 1.84; 95% CI, 0.7 to 4.8), the 95% CI of the ratio of the median PFS between the groups was less than 1 (0.34; 95% CI, 0 to 0.7). This trend for the degree of metabolic response to be predictive of PFS was impressive given the relatively small number of patients evaluated.
Fig 4.

Relationship between reduction in the maximum standardized uptake value (SUVmax) and progression-free survival (PFS). The PFS of patients with greater or less than the median reduction in SUVmax (82%) is shown. The ratio of the median PFS between the two groups was 0.34 (95% CI, 0 to 0.7).
Exploratory analyses were also performed to determine whether patients with low metabolic disease volumes a had longer PFS. Patients with metabolic disease volumes less than the median (313 mL) had a trend for longer PFS (282 days) than did patients with metabolic disease volumes greater than the median (141 days; P = .06; Wilcoxon test) as shown in Appendix Fig A1 (online only).
DISCUSSION
The use of FDG-PET has previously shown early evidence of response and biologic activity after the successful inhibition of the protein kinases KIT in GI stromal tumor (GIST) and EGFR in non–small-cell lung cancer. We observed a similar, dose-dependent reduction in the uptake of FDG in patients with BRAF-V600E–mutant melanoma treated with vemurafenib, which is an agent with specificity for the RAF/MEK/ERK pathway but without direct activity against the PI3K/AKT pathway more usually associated with glucose metabolism. No or minimal responses were observed at subtherapeutic doses of vemurafenib, whereas striking and consistent reductions were observed at doses of vemurafenib ≥ 320 mg twice a day. However, as previously observed in GIST,22 the extent of inhibition of FDG uptake at the maximum-tolerated dose did not predict traditional RECIST responses. We suggest that the inhibition of FDG uptake likely reflects the abrogation of signaling downstream of BRAF, which may be required but not necessarily sufficient to result in a loss of cellular viability that may depend on factors including the ability to use alternative metabolic substrates or the integrity of apoptotic pathways activated in response to substrate restriction. As such, FDG-PET may be a useful tool in the development of drugs that inhibit the BRAF/MEK/ERK pathway to assist in defining whether novel agents are being delivered at the optimal dose and schedule. FDG-PET may also help to understand whether resistance mechanisms relate to failure of signaling abrogation through the candidate pathway or other mechanisms including failure of apoptosis.
Preclinical studies supported clear molecular links between the inhibition of BRAF, downregulation of ERK activity, and effects on glucose metabolism. ERK can directly phosphorylate LKB1, which negatively regulates glucose metabolism through both AMP-kinase and the mTORC1 complex. Moreover, ERK regulates several transcription factors that control the expression of the glucose transporter GLUT1 including CREB, AP-1, and MYC. Therefore FDG uptake as a measure of the functional activity of GLUT1 may provide a biomarker for signaling through the BRAF/MEK/ERK pathway.
As previously detailed, although the inhibition of FDG uptake may be a robust marker of the pathway inhibition of glucose uptake and possibly cell proliferation, a reduction of glucose uptake is not sufficient to induce high levels of cell death that lead to morphologic regression. Instead, other biologic processes in melanoma may determine the timing and extent of tumor regression after the inhibition of BRAF. Candidates would include accompanying genetic events to mutation in BRAF such as the loss of PTEN or mutation or loss of CDKN2A that may influence the reestablishment of cell proliferation that limits the extent of tumor regression. Similarly, the altered expression of molecules that regulate apoptosis or autophagy may influence the extent of response. An additional explanation of the lack of correlation between an FDG-PET response and conventional response may involve metabolic processes in melanoma cells. Melanoma cells may be able to use glucose-independent metabolic pathways to survive or proliferate. In contrast, exploratory analyses suggested that an inhibition of glucose uptake maybe related to longer-term responses. Preclinical data with vemurafenib supported this relationship.23 This observation requires additional evaluation in a larger and independent cohort that will also allow the exploration of patient subsets such as patients with low metabolic disease volumes. However, similar to GIST treated with imatinib or sunitinib, the data raised the hypothesis that the extent of inhibition of oncogene-driven glucose uptake may predict a sustained clinical benefit, and mechanisms that underlie an early versus late benefit from the inhibition of BRAF may be distinct.
The observation that the uptake of FDG is rapidly and homogeneously reduced after the inhibition of BRAF raises the possibility of using FDG-PET to monitor the durability of response and detect early progression. Indeed, tumors can become FDG avid at progression despite continued dosing with vemurafenib (G.A.M. and R.J.H., unpublished data). The performance FDG-PET scans at later time points, such as at 8 to 12 weeks, is worthy of study because tumor metabolism may be a more significant predictor of later outcome by detecting the early reactivation of signaling and FDG uptake. Such an approach might provide an opportunity to identify sites that have developed vemurafenib resistance and, thereby, to discover targets for early intervention in patients destined for subsequent progression.
The high metabolic response rate to inhibition of BRAF by vemurafenib suggested a fundamental relationship between the activation of BRAF and a high level of glucose uptake that are usually associated with a glycolytic phenotype.14 A variety of oncogenic events can induce a glycolytic phenotype characterized by impaired oxidative phosphorylation and high rates of production of lactate through glycolysis. These events include RAS, MYC, loss of PTEN, and activation of PI3 kinase. Activated BRAF has also been associated with the glycolytic phenotype, and our data provided evidence that this also may be the case in human melanoma. These observations suggest that additional studies to investigate the role of altered glucose metabolism in the malignant phenotype of melanoma and response to targeted therapies in melanoma are warranted.
Acknowledgment
We thank Chaitanya Divgi, MD, Johannes Czernin, MD, Martin Allen-Auerbach, MD, Steve Larson, MD, Chaan Ng, MD, Yulia Bronstein, MD, Dominique Delbeke, MD, and their staff for expert performance of FDG-PET scans as part of this study.
Appendix
Fig A1.

Relationship between metabolic disease volume at baseline and progression-free survival (PFS). The PFS of patients with greater or less than the median metabolic volume (313 mL) is shown (P = .06; Wilcoxon test).
Footnotes
See accompanying editorial on page 1581
Supported by Plexxikon and Hoffman-La Roche and in part by Grants No. EOI09_27 from the Victorian Cancer Agency and APP1002655 from the National Health and Medical Research Council and by the Cancer Council of Victoria and the Sir Edward Weary Dunlop Clinical Research Fellowship from the Cancer Council of Victoria.
Presented in part at the 46th Annual Meeting of the American Society of Clinical Oncology, Chicago, IL, June 4-8, 2010.
Authors' disclosures of potential conflicts of interest and author contributions are found at the end of this article.
Clinical trial information can be found for the following: .
AUTHORS' DISCLOSURES OF POTENTIAL CONFLICTS OF INTEREST
Although all authors completed the disclosure declaration, the following author(s) indicated a financial or other interest that is relevant to the subject matter under consideration in this article. Certain relationships marked with a “U” are those for which no compensation was received; those relationships marked with a “C” were compensated. For a detailed description of the disclosure categories, or for more information about ASCO's conflict of interest policy, please refer to the Author Disclosure Declaration and the Disclosures of Potential Conflicts of Interest section in Information for Contributors.
Employment or Leadership Position: Richard J. Lee, Roche (C); Keith Nolop, Plexxikon (C) Consultant or Advisory Role: Grant A. McArthur, GlaxoSmithKline (U), Plexxikon (U), Roche/Genentech (U); Igor Puzanov, Genentech (C); Ravi Amaravadi, Genentech (C); Antoni Ribas, Roche/Genentech (C); Paul Chapman, Roche/Genentech (C); Kevin B. Kim, Roche/Genentech (C); Jeffrey A. Sosman, GlaxoSmithKline (C), Roche/Genentech (C); Keith T. Flaherty, GlaxoSmithKline (C), Roche/Genentech (C) Stock Ownership: Keith Nolop, Plexxikon Honoraria: Paul Chapman, Hoffman-La Roche/Genentech; Kevin B. Kim, Roche/Genentech; Jeffrey A. Sosman, GlaxoSmithKline, Roche/Genentech Research Funding: Grant A. McArthur, Pfizer; Paul Chapman, Hoffman-La Roche/Genentech; Kevin B. Kim, Roche; Jeffrey A. Sosman, Bristol-Myers Squibb, GlaxoSmithKline Expert Testimony: None Other Remuneration: None
AUTHOR CONTRIBUTIONS
Conception and design: Grant A. McArthur, Igor Puzanov, Antoni Ribas, Jeffrey A. Sosman, Richard J. Lee, Keith Nolop, Keith T. Flaherty, Rodney J. Hicks
Administrative support: Igor Puzanov
Provision of study materials or patients: Grant A. McArthur, Igor Puzanov, Antoni Ribas, Kevin B. Kim, Jeffrey A. Sosman, Keith T. Flaherty
Collection and assembly of data: Grant A. McArthur, Igor Puzanov, Ravi Amaravadi, Paul Chapman, Kevin B. Kim, Keith T. Flaherty, Jason Callahan, Rodney J. Hicks
Data analysis and interpretation: Grant A. McArthur, Igor Puzanov, Ravi Amaravadi, Antoni Ribas, Richard J. Lee, Keith Nolop, Keith T. Flaherty, Jason Callahan, Rodney J. Hicks
Manuscript writing: All authors
Final approval of manuscript: All authors
REFERENCES
- 1.Davies H Bignell GR Cox C, etal: Mutations of the BRAF gene in human cancer Nature 417:949–954,2002 [DOI] [PubMed] [Google Scholar]
- 2.Curtin JA Fridlyand J Kageshita T, etal: Distinct sets of genetic alterations in melanoma N Engl J Med 353:2135–2147,2005 [DOI] [PubMed] [Google Scholar]
- 3.Curtin JA Busam K Pinkel D, etal: Somatic activation of KIT in distinct subtypes of melanoma J Clin Oncol 24:4340–4346,2006 [DOI] [PubMed] [Google Scholar]
- 4.Prickett TD Agrawal NS Wei X, etal: Analysis of the tyrosine kinome in melanoma reveals recurrent mutations in ERBB4 Nat Genet 41:1127–1132,2009 [DOI] [PMC free article] [PubMed] [Google Scholar]
- 5.Flaherty KT Puzanov I Kim KB, etal: Inhibition of mutated, activated BRAF in metastatic melanoma N Engl J Med 363:809–819,2010 [DOI] [PMC free article] [PubMed] [Google Scholar]
- 6.Carvajal RD Antonescu CR Wolchok JD, etal: KIT as a therapeutic target in metastatic melanoma JAMA 305:2327–2334,2011 [DOI] [PMC free article] [PubMed] [Google Scholar]
- 7.Chapman PB Hauschild A Robert C, etal: Improved survival with vemurafenib in melanoma with BRAF V600E mutation N Engl J Med 364:2507–2516,2011 [DOI] [PMC free article] [PubMed] [Google Scholar]
- 8.Blanke CD Demetri GD von Mehren M, etal: Long-term results from a randomized phase II trial of standard- versus higher-dose imatinib mesylate for patients with unresectable or metastatic gastrointestinal stromal tumors expressing KIT J Clin Oncol 26:620–625,2008 [DOI] [PubMed] [Google Scholar]
- 9.Su H Bodenstein C Dumont RA, etal: Monitoring tumor glucose utilization by positron emission tomography for the prediction of treatment response to epidermal growth factor receptor kinase inhibitors Clin Cancer Res 12:5659–5667,2006 [DOI] [PubMed] [Google Scholar]
- 10.Mileshkin L Hicks RJ Hughes BG, etal: Changes in 18F-fluorodeoxyglucose and 18F-fluorodeoxythymidine positron emission tomography imaging in patients with non-small cell lung cancer treated with erlotinib Clin Cancer Res 17:3304–3315,2011 [DOI] [PubMed] [Google Scholar]
- 11.Zander T Scheffler M Nogova L, etal: Early prediction of nonprogression in advanced non-small-cell lung cancer treated with erlotinib by using [(18)F]fluorodeoxyglucose and [(18)F]fluorothymidine positron emission tomography J Clin Oncol 29:1701–1708,2011 [DOI] [PubMed] [Google Scholar]
- 12.Stroobants S Goeminne J Seegers M, etal: 18FDG-Positron emission tomography for the early prediction of response in advanced soft tissue sarcoma treated with imatinib mesylate (Glivec) Eur J Cancer 39:2012–2020,2003 [DOI] [PubMed] [Google Scholar]
- 13.Zheng B Jeong JH Asara JM, etal: Oncogenic B-RAF negatively regulates the tumor suppressor LKB1 to promote melanoma cell proliferation Mol Cell 33:237–247,2009 [DOI] [PMC free article] [PubMed] [Google Scholar]
- 14.Vander Heiden MG, Cantley LC, Thompson CB: Understanding the Warburg effect: The metabolic requirements of cell proliferation Science 324:1029–1033,2009 [DOI] [PMC free article] [PubMed] [Google Scholar]
- 15.Osthus RC Shim H Kim S, etal: Deregulation of glucose transporter 1 and glycolytic gene expression by c-Myc J Biol Chem 275:21797–21800,2000 [DOI] [PubMed] [Google Scholar]
- 16.Kao YS, Fong JC: A novel cross-talk between endothelin-1 and cyclic AMP signaling pathways in the regulation of GLUT1 transcription in 3T3-L1 adipocytes Cell Signal 23:901–910,2011 [DOI] [PubMed] [Google Scholar]
- 17.Therasse P Arbuck SG Eisenhauer EA, etal: New guidelines to evaluate the response to treatment in solid tumors J Natl Cancer Inst 92:205–216,2000. European Organization for Research and Treatment of Cancer, National Cancer Institute of the United States, National Cancer Institute of Canada [DOI] [PubMed] [Google Scholar]
- 18.Bollag G Hirth P Tsai J, etal: Clinical efficacy of a RAF inhibitor needs broad target blockade in BRAF-mutant melanoma Nature 467:596–599,2010 [DOI] [PMC free article] [PubMed] [Google Scholar]
- 19.Young H Baum R Cremerius U, etal: Measurement of clinical and subclinical tumour response using [18F]-fluorodeoxyglucose and positron emission tomography: Review and 1999 EORTC recommendations Eur J Cancer 35:1773–1782,1999. European Organization for Research and Treatment of Cancer (EORTC) PET Study Group [DOI] [PubMed] [Google Scholar]
- 20.Everitt S Herschtal A Callahan J, etal: High rates of tumor growth and disease progression detected on serial pretreatment fluorodeoxyglucose-positron emission tomography/computed tomography scans in radical radiotherapy candidates with nonsmall cell lung cancer Cancer 116:5030–5037,2010 [DOI] [PubMed] [Google Scholar]
- 21.Yang H Higgins B Kolinsky K, etal: RG7204 (PLX4032), a selective BRAFV600E inhibitor, displays potent antitumor activity in preclinical melanoma models Cancer Res 70:5518–5527,2010 [DOI] [PubMed] [Google Scholar]
- 22.Choi H Charnsangavej C de Castro Faria S, etal: CT evaluation of the response of gastrointestinal stromal tumors after imatinib mesylate treatment: A quantitative analysis correlated with FDG PET findings AJR Am J Roentgenol 183:1619–1628,2004 [DOI] [PubMed] [Google Scholar]
- 23.Søndergaard JN Nazarian R Wang Q, etal: Differential sensitivity of melanoma cell lines with BRAFV600E mutation to the specific Raf inhibitor PLX4032 J Transl Med 8:39,2010 [DOI] [PMC free article] [PubMed] [Google Scholar]