Abstract
Diagnostic tests are used to identify subjects with and without disease. In a previous article in this series, we examined some attributes of diagnostic tests – sensitivity, specificity, and predictive values. In this second article, we look at likelihood ratios, which are useful for the interpretation of diagnostic test results in everyday clinical practice.
Keywords: Biostatistics, diagnostic tests, likelihood ratios
INTRODUCTION
In a previous article in this series, we discussed some of the properties of diagnostic tests, i.e., sensitivity, specificity, and predictive values of positive and negative tests.[1] As we discussed there, sensitivity and specificity are not directly applicable in clinical practice, since these tell us about the results of the test given that disease is present or absent. In the clinic, we rely more on predictive values to inform us the probability of the presence or absence of the disease of interest, given a positive or negative test result. As discussed in that article, predictive values are highly influenced by the prevalence of disease in the population undergoing the test.
In this second article on diagnostic tests, we look at some other measures of diagnostic tests, which are useful from a clinical viewpoint.
LIKELIHOOD RATIOS
Likelihood ratios compare the probability that someone with the disease has a particular test result as compared to someone without the disease. These are represented as the likelihood ratio for a positive test result (LR+) and the likelihood ratio for a LR−.
LR+ = Probability that a person with the disease tested positive/probability that a person without the disease tested positive.
i.e., LR+ = true positive/false positive
LR− = Probability that a person with the disease tested negative/probability that a person without the disease tested negative.
i.e., LR− = false negative/true negative
Let us revisit the hypothetical example, from our previous article, of performance of D-dimer test for the diagnosis of pulmonary embolism in 100 subjects in a hospital,[1] using pulmonary angiography as the gold standard [Table 1].
Table 1.
Number of subjects in whom pulmonary embolism was detected using perfusion scan (the gold standard) versus the results of the blood test for D-dimer (test whose performance is under evaluation

LR+ for the D-dimer test is the probability of patients with pulmonary embolism having a positive D-dimer test/probability of patients without pulmonary embolism having a positive D-dimer test.
LR+ for the D-dimer test = (7/10)/(13/90) =4.85
This means that someone with pulmonary embolism is 4.85 times more likely to have a positive D-dimer test than someone without pulmonary embolism.
Similarly, LR− for the D-dimer test is the probability of patients with pulmonary embolism having a negative D-dimer test/probability of patients without pulmonary embolism having a negative D-dimer test.
LR− for the D-dimer test = (3/10)/(77/90) =0.35
This means that someone with pulmonary embolism is 0.35 times as likely to have a negative D-dimer test as someone without pulmonary embolism. This can also be interpreted as: A person without pulmonary embolism is about 3 (=1/0.35) times more likely to have a negative D-dimer test than someone with pulmonary embolism.
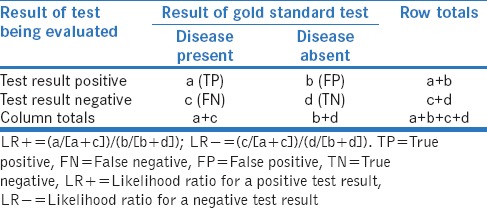
We can look at the above definitions in the context of a generic 2 × 2 contingency table for a diagnostic test [Table 2]. These can also be expressed in terms of sensitivity and specificity, as follows:
Table 2.
A generic 2 × 2 contingency table for assessing the performance of a diagnostic test

LR+ = sensitivity/(1 − specificity)
LR− = (1 − sensitivity)/specificity.
INTERPRETATION OF LIKELIHOOD RATIOS
A likelihood ratio of 1.0 indicates that there is no difference in the probability of the particular test result (positive result for LR+ and negative result for LR−) between those with and without the disease.
A likelihood ratio >1.0 indicates that the particular test result is more likely to occur in those with disease than in those without disease, whereas a likelihood ratio <1.0 indicates that the particular test result is less likely to occur in those with disease than those without disease. As LRs move farther away from the value of 1.0, the strength of their association with the presence or absence of disease increases. Thus, tests with very high LR+ and very low LR− have greater discriminating ability, and tests with LRs >10 or <0.1 are very useful in establishing or excluding a diagnosis.[2]
EFFECT OF CHANGE IN DISEASE PREVALENCE ON LIKELIHOOD RATIOS
As we discussed in our previous article on diagnostic tests, the prevalence of a disease among persons undergoing a particular test may vary depending on the clinical situation. Further, we discussed there that some of the performance characteristics of a diagnostic test vary with the change in disease prevalence among those tested.[1]
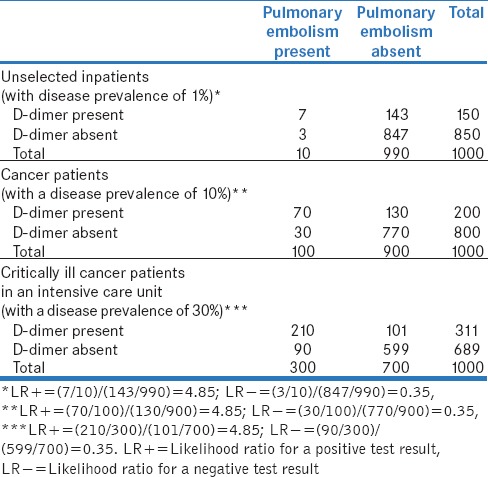
Table 3 shows the effect of change in disease prevalence on LR+ and LR− of a test, provided the latter's underlying characteristics (i.e., sensitivity and specificity) remain unchanged. In the three clinical scenarios included in the table, the prevalence of pulmonary embolism is expected to be different. Let us presume (hypothetically) that these are 1%, 10%, and 30%, respectively. As the calculations in these tables show, despite the change in prevalence of pulmonary embolism, the LR+ is 4.85 and the LR− is 0.35 in each situation, demonstrating that likelihood ratios are not influenced by disease prevalence.
Table 3.
Expected performance of D-dimer test for pulmonary embolism in 1000 inpatients in a hospital in difference situations (with varying disease prevalence rates - hypothetically presumed as 1%, 10%, and 30%, respectively), provided the sensitivity and the specificity of the test remain unchanged (70% and 85.6%, respectively, here)

CLINICAL APPLICATION OF LIKELIHOOD RATIOS
To effectively apply likelihood ratios in clinical practice, one must understand the concept of pretest probability. Pretest probability refers to the probability that a subject has a disease before the result of the diagnostic test is known. This depends on the disease prevalence in that population and on background history, symptoms and signs of a patient.
Knowing the pretest probability of a disease in the index patient and likelihood ratios, it is possible to calculate the posttest probabilities associated with positive and negative test results, using the formula:
Posttest odds = pretest odds × likelihood ratio
It is important to note here that “odds” and “probability” are not the same; however, these can be derived from each other as follows:
Odds = probability/(1 − probability)
Probability = odds/(1 + odds).
Thus, the posttest probability of a particular test result (whether positive or negative) is different in patients with different pretest probabilities, even though LR+ and LR− remain unchanged. For example, let us consider two subjects with breathlessness in whom the diagnosis of pulmonary embolism is being considered: (i) Case A: A 65-year-old cancer patient who is critically ill and has been immobile for the past 4 days, and (ii) Case B: A 25-year-old male who had resumed normal activities almost immediately after a hernia surgery done a week ago. Obviously, the pretest probability for pulmonary embolism is far higher in Case A than in Case B. From our example in Table 3, the prevalence (or pretest probability) of pulmonary embolism in these scenarios would be 30% and 1%, respectively.
The interpretation of a positive D-dimer test will be very different in these two cases. As shown in Table 4, one can calculate the posttest odds, given a positive D-dimer test, to be 2.04 and 0.05, for Case A and Case B, respectively. We can then reconvert these odds into probabilities to obtain the posttest probabilities of pulmonary embolism, which turn out to be 67% and 5%, respectively.
Table 4.
Calculation of posttest probability for two patients with different pretest probabilities of pulmonary embolism

Similarly, a negative D-dimer test in Case A and Case B would mean posttest probability of having pulmonary embolism of 13% and 0.35%, respectively [Table 4].
SIMPLER METHODS TO CALCULATE POSTTEST PROBABILITY
Calculation of posttest probability from pretest probability and likelihood ratio involves several steps. To simplify this, Fagan (as long back as in 1975) created a nomogram, which does not require any calculation and is easy to use.[3,4]
McGee suggested an even simpler method, which provides information on approximate changes in probability for different likelihood ratios for pretest probabilities between 10% and 90%.[5]
LIMITATIONS OF LIKELIHOOD RATIOS
Likelihood ratios are generated using data similar to those used to assess sensitivity and specificity. Therefore, the accuracy of likelihood ratios depends on the quality of the studies from which these values are derived.
The application of likelihood ratios in clinical settings requires an estimate of pretest probability, which is often subjective. Although the pretest probability of a disease may appear to be similar to its prevalence in the population, this is not true. It can vary between different groups of patients, depending on their risk factors and symptoms. For example, in a 65-year-old critically ill cancer patient with calf tenderness or a previous history of deep vein thrombosis, the pretest probability of pulmonary embolism would be much higher than even the 30% referred to in the example above. Each patient presents with his own set of risk factors, symptoms and signs, which inform his likelihood of having the disease of interest. Thus, the estimate of pretest probability of disease has to be individualized and tailored to a patient's condition.
A patient may undergo several diagnostic tests. Even if one knows the likelihood ratio for each of these tests, there is no consensus on how to summate these different likelihood ratios to estimate the posttest probability. For example, let us consider a patient with suspected pulmonary embolism who has undergone two tests, namely bedside echocardiography for right ventricular failure hypothetical LR+ and D-dimer (hypothetical LR+ 4.85), and has tested positive on both. His posttest probability of pulmonary embolism would be higher than that of a person who has undergone only one test with a positive result. However, the best method to calculate the posttest probability of pulmonary embolism – whether to summate these ratios, multiply these or use these sequentially – remains unclear.
Financial support and sponsorship
Nil.
Conflicts of interest
There are no conflicts of interest.
REFERENCES
- 1.Ranganathan P, Aggarwal R. Common pitfalls in statistical analysis: Understanding the properties of diagnostic tests – Part 1. Perspect Clin Res. 2018;9:40–3. doi: 10.4103/picr.PICR_170_17. [DOI] [PMC free article] [PubMed] [Google Scholar]
- 2.Deeks JJ, Altman DG. Diagnostic tests 4: Likelihood ratios. BMJ. 2004;329:168–9. doi: 10.1136/bmj.329.7458.168. [DOI] [PMC free article] [PubMed] [Google Scholar]
- 3.Fagan TJ. Letter: Nomogram for bayes theorem. N Engl J Med. 1975;293:257. doi: 10.1056/NEJM197507312930513. [DOI] [PubMed] [Google Scholar]
- 4.Nomogram for Interpreting Diagnostic Test Results (Likelihood ratio) [Last accessed on 2018 Mar 18]. Available from: https://www.mclibrary.duke.edu/sites/mclibrary.duke.edu/files/public/guides/nomogram.pdf.
- 5.McGee S. Simplifying likelihood ratios. J Gen Intern Med. 2002;17:646–9. doi: 10.1046/j.1525-1497.2002.10750.x. [DOI] [PMC free article] [PubMed] [Google Scholar]


