Abstract
Objectives
We sought to investigate the relationship between air quality and heart failure (HF) incidence and rehospitalisation to elucidate whether there is a threshold in this relationship and whether this relationship differs for HF incidence and rehospitalisation.
Methods
This retrospective observational study was performed in an Australian state-wide setting, where air pollution is mainly associated with wood-burning for winter heating. Data included all 1246 patients with a first-ever HF hospitalisation and their 3011 subsequent all-cause readmissions during 2009–2012. Daily particulate matter <2.5 µm (PM2.5), temperature, relative humidity and influenza infection were recorded. Poisson regression was used, with adjustment for time trend, public and school holiday and day of week.
Results
Tasmania has excellent air quality (median PM2.5=2.9 µg/m3 (IQR: 1.8–6.0)). Greater HF incidences and readmissions occurred in winter than in other seasons (p<0.001). PM2.5 was detrimentally associated with HF incidence (risk ratio (RR)=1.29 (1.15–1.42)) and weakly so with readmission (RR=1.07 (1.02–1.17)), with 1 day time lag. In multivariable analyses, PM2.5 significantly predicted HF incidence (RR=1.12 (1.01–1.24)) but not readmission (RR=0.96 (0.89–1.04)). HF incidence was similarly low when PM <4 µg/m3 and only started to rise when PM2.5≥4 µg/m3. Stratified analyses showed that PM2.5 was associated with readmissions among patients not taking beta-blockers but not among those taking beta-blockers (pinteraction=0.011).
Conclusions
PM2.5 predicted HF incidence, independent of other environmental factors. A possible threshold of PM2.5=4 µg/m3 is far below the daily Australian national standard of 25 µg/m3. Our data suggest that beta-blockers might play a role in preventing adverse association between air pollution and patients with HF.
Keywords: air pollution, environment, heart failure, time series, threshold, wood smoke
Strengths and limitations of this study.
This observational study was performed in Tasmania, one of the world’s cleanest air areas with median PM2.5 level of 2.9 µg/m3. This has given us an opportunity to investigate the association of air pollution with heart failure (HF) within a range of air quality that was much wider than that of other previous studies of its kind.
Our analyses were based on a wide range of environmental factors to determine the independent association of air pollution with HF.
The separation of HF incidence and readmission enabled us to investigate the differences in their associations with air pollution and other environmental factors.
This study is limited by the absence of available data on personal exposure to active and passive smoking, indoor temperature and other air pollutants.
The adverse associations of air pollution on HF might have been underestimated in our study because our analyses were based on acute events associated with short-term exposures and did not take into account the effects of long-term exposure to air pollution.
Introduction
Heart failure (HF) is the leading cause of hospitalisation and rehospitalisation for adults aged over 65 years.1 2 Despite great improvements in medical therapy and management of risk factors for HF, high readmission rates following an index HF admission continue to be a problem worldwide.3–5 In Australia, approximately 30 000 patients are diagnosed with HF each year, and the costs for HF readmissions exceed $1 billion annually.6 Finding and eliminating the triggers of acute cardiac decompensation will reduce the social and economic burden of HF.
The phenomenon of seasonal variations in HF has been well established.7–9 Although the underlying mechanisms are yet to be determined, observed increases in morbidity and mortality in cold weather may be partly due to increased ambient air pollution.10 11 A recent assessment of the global burden of disease ranked particulate matter air pollution as one of the leading causes of death and disability worldwide.12 A recent systematic review and meta-analysis has shown an adverse relationship between increases in ambient particulate matter and HF hospitalisation and death.13 However, it is unknown whether there is a threshold of particulate matter concentration in this relationship and whether this relationship may differ between HF incidence (defined as first-ever hospitalisation due to HF) and all-cause readmission.
Tasmania has excellent air quality in comparison with other parts of Australia. While having very low median level of fine particulate matter (PM2.5 <3 µg/m3) compared with regions with considered good air quality like Colorado, USA (median PM2.5 7.7 µg/m3)13 or bad air quality like Beijing (PM2.5 94±24 µg/m3), there are days in Tasmania with high level of air pollution (PM2.5 of up to 40 µg/m3).14 This very wide range of air quality provides a unique opportunity to investigate if there is a lower threshold for health outcomes associated with air pollution. The main cause of elevations in particulate matter in this setting is biomass smoke from wood heaters during winter and from bushfires and planned burns at other times of the year.15 In this retrospective cohort study, we measured air pollution and other environmental factors including temperature, relative humidity and influenza epidemics and investigated the associations of these factors with HF incidence and readmission. Patients may be exposed to different lifestyles, treatments and medications before and after the diagnosis of HF. By being able to separate HF incidence and readmission, we sought to determine the presence and mechanism of any differences in the relationship of these outcomes with environmental factors.
Methods
Study population
This retrospective cohort study included all 1246 patients (median age 78 years, 51% male) who had their first-ever admission to a public hospital in Hobart and Launceston (Tasmania, Australia) due to HF between July 2009 and July 2012. These patients were identified by their coded diagnoses (International Classification of Diseases, Ninth Revision, Clinical Modification 402.x1, 404.x1, 404.x3, 428.x and 428.xx).
Primary outcomes
The primary outcomes of this study were daily count of HF incidence (defined as first hospitalisation due to HF) and subsequent all-cause readmissions that followed the index admission during the study period. Dates of hospitalisation were obtained from administrative data from the Clinical Informatics and Business Intelligence Unit of the Department of Health and Human Services of Tasmania.
Patient and public involvement
Patients or public were not involved in this study.
Environmental data
The Australian state of Tasmania is an island to the south of the continent, characterised by a colder and wetter climate, and cleaner air quality, than the rest of the Australia. In this southern hemisphere, winter is defined as June–August, spring as September–November, summer as December–February and autumn as March to May.16 Hobart (population 247 461 in 2011) and Launceston (population 137 561 in 2011) are the two largest cities of Tasmania (total population 495 354 in 2011) and provide residence for nearly 80% of the whole state’s population.17 There is only one public hospital in each of Hobart (the Royal Hobart Hospital) and Launceston (the Launceston General Hospital). Air pollution in Hobart and Launceston was estimated by hourly concentrations of particulate matter less than 2.5 µm in diameter (PM2.5) with gravimetric sampling methods.18 Simultaneous monitoring of air quality was previously conducted at multiple sites and showed highly correlated measurements.18 After these findings, a representative site was selected for ongoing monitoring air quality in each city all year. Data on daily temperature and relative humidity were from the Bureau of Meteorology.19 Daily count of positive laboratory tests for influenza in Tasmania was also recorded.
Demographic and clinical data
Additional demographic and clinical data were collected from medical records of the first HF admission.20
Statistical analyses
Cumulative incidence of HF was estimated by taking the ratio of new HF cases to the total population of Hobart and Launceston. We calculated daily concentration of PM2.5 by averaging their hourly measurements from each day, for Hobart and Launceston separately. Daily mean temperature and relative humidity were calculated by averaging maximum and minimum temperature and relative humidity of each day. These measurements were then weighted based on the ratio of population in the two cities to derive an average value to be used in analysis. The rolling sum of positive influenza tests during the last 7 days (including the current day) was calculated, and the 90th percentile cut-off was used to define influenza epidemic. Pearson correlation was used to estimate the strength of the relationships among these environmental factors. Because of the nature of our primary outcomes (count variables), Poisson regression was used to estimate the associations of air pollution and other environmental factors with the primary outcomes of this study. These associations were estimated for the same day (lag0) and up to 5 days before the outcome (lag1 to lag5) and for the previous 3 days moving average (lag1–3). Binary variables were created for weekday and weekend, school holidays and public holidays for adjustment. A smooth function of calendar time (natural cubic splines) with 7 df per year was used to adjust for seasonal patterns and any other time-dependent influences on HF admissions (including long-term trends due to changes in medical practice). Because the relationship of temperature with HF admissions appeared to be linear in our study (as shown in Results section, possibly due to the cool climate nature of Tasmania), we fitted a linear term for temperature in our analysis.
Results
Heart failure
Data on HF hospitalisations are shown in table 1.
Table 1.
Data on heart failure incidence and readmission, and environmental factors in Hobart and Launceston (Australia) in 2009–2012 (1096 days)
| Heart failure hospitalisations | |
| Incidence (counts/day) | 1 (0–2) |
| All-cause readmission (counts/day) | 3 (2–4) |
| Male | 632 (51) |
| Age at index admission (years) | 80 (72–86) |
| NYHA classification before discharge | |
| Class I | 174 (14) |
| Class II | 449 (36) |
| Class III | 424 (34) |
| Class IV | 199 (16) |
| Beta-blocker use | 660 (53) |
| ACEi/ARB use | 909 (73) |
| Diuretic use | 1159 (93) |
| Aldosterone use | 386 (27) |
| Digoxin use | 274 (22) |
| Antiarrhythmic medication use | 100 (8) |
| Environmental factors | |
| Daily air concentration of PM2.5 (µg/m3) | 2.9 (1.8–6.1) |
| Mean daily temperature (°C) | 13.2 (9.9–16.7) |
| Min daily temperature (°C) | 8.2 (4.9–11.7) |
| Max daily temperature (°C) | 18.0 (14.6–22.2) |
| Daily relative humidity (%) | 74 (66–82) |
Data are reported as median (IQR) or n (%).
ACEI, ACE inhibitor; ARB, angiotensin receptor blocker; NYHA, New York Heart Association.
Patients from Hobart and Launceston had very similar socioeconomic status (Index of Relative Socioeconomic Advantage and Disadvantage: 912±105 vs 914±90, p=0.73). Only a small proportion of patients from both cities were from remote/very remote areas (Hobart: 2% and Launceston: 1%).
There were 1246 HF incidences (median: 1 new case/day). The estimated cumulative incidence of HF was 3.2 per 1000 persons over the study period. After the first HF hospitalisation, there were 3011 subsequent all-cause readmissions (with 35% being HF-specific readmissions) during the study period. The majority of patients (70%) were classified as New York Heart Association (NYHA) class II/III. Diuretics were the most commonly used medication, followed by ACE inhibitors (ACEis) or angiotensin receptor blockers (ARBs).
Environmental factors
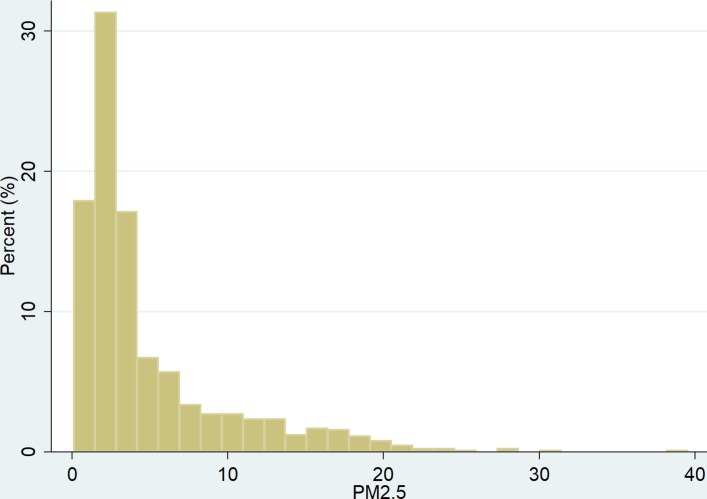
The distribution of PM2.5 is shown in figure 1.
Figure 1.
Distribution of PM2.5.
Median levels of PM2.5, temperature and relative humidity are shown in table 1. The correlations among these measurements, which are moderate at best, are shown in table 2.
Table 2.
Correlations among the environmental factors
| PM2.5 | Temperature | Relative humidity | |
| PM2.5 | 1.00 | ||
| Temperature | −0.38* | 1.00 | |
| Humidity | 0.35* | −0.23* | 1.00 |
*P<0.001.
Seasonal variations of HF
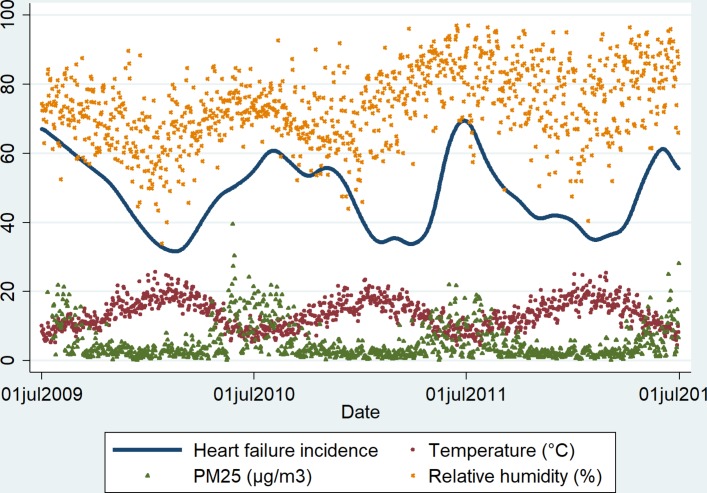
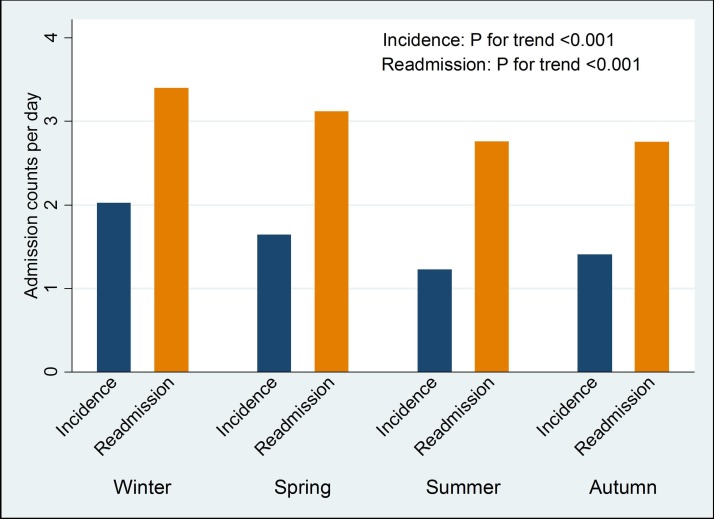
The seasonal variations of HF are illustrated in figure 2. The incidence of new cases of HF peaked during winter months (June–August). This phenomenon also aligned well with the peaks in PM2.5 and relative humidity and with the lowest levels of temperature. Figure 3 further demonstrated this seasonal variation in HF by showing significant trends in HF incidence and readmissions that both peaked during winter and reduced during other seasons.
Figure 2.
Seasonal variations of heart failure and environmental factors.
Figure 3.
Heart failure incidence and readmission by seasons.
Associations with primary outcomes
Table 3 shows univariable associations of air pollution and other environmental factors with HF incidence and all-cause readmission.
Table 3.
Univariable Poisson regression of environmental factors with heart failure incidence and readmissions
| Heart failure incidence | All-cause readmissions | |||
| Risk ratio | P values | Risk ratio | P values | |
| PM2.5 (per 10 µg/m3) | ||||
| Lag0 day | 1.18 (1.08 to 1.32) | <0.001 | 1.01 (0.94 to 1.09) | 0.75 |
| Lag1 day | 1.29 (1.15 to 1.42) | <0.001 | 1.07 (1.00 to 1.14) | 0.06 |
| Lag2 day | 1.24 (1.12 to 1.38) | <0.001 | 1.03 (0.96 to 1.10) | 0.47 |
| Lag3 day | 1.13 (1.01 to 1.26) | 0.005 | 0.98 (0.91 to 1.05) | 0.58 |
| Lag4 day | 1.16 (1.03 to 1.29) | 0.013 | 1.01 (0.94 to 1.08) | 0.85 |
| Lag5 day | 1.17 (1.07 to 1.29) | 0.001 | 1.01 (0.94 to 1.09) | 0.70 |
| Lag1-3 day average | 1.27 (1.14 to 1.44) | <0.001 | 1.02 (0.94 to 1.10) | 0.67 |
| Temperature (per 10°C) | ||||
| Lag0 day | 0.63 (0.56 to 0.70) | <0.001 | 0.83 (0.76 to 0.90) | <0.001 |
| Lag1 day | 0.67 (0.58 to 0.76) | <0.001 | 0.84 (0.77 to 0.91) | <0.001 |
| Lag2 day | 0.64 (0.57 to 0.72) | <0.001 | 0.81 (0.75 to 0.88) | <0.001 |
| Lag3 day | 0.64 (0.56 to 0.73) | <0.001 | 0.82 (0.75 to 0.89) | <0.001 |
| Lag4 day | 0.60 (0.52 to 0.68) | <0.001 | 0.80 (0.74 to 0.87) | <0.001 |
| Lag5 day | 0.64 (0.56 to 0.73) | <0.001 | 0.84 (0.77 to 0.91) | <0.001 |
| Lag1–3 day average | 0.62 (0.54 to 0.71) | <0.001 | 0.81 (0.74 to 0.88) | <0.001 |
| Relative humidity (per 10%) | ||||
| Lag0 day | 1.02 (0.97 to 1.07) | 0.49 | 1.11 (1.07 to 1.14) | <0.001 |
| Lag1 day | 1.01 (0.96 to 1.06) | 0.69 | 1.09 (1.06, 1.13) | <0.001 |
| Lag2 day | 1.03 (0.98 to 1.09) | 0.09 | 1.10 (1.07 to 1.14) | <0.001 |
| Lag3 day | 1.07 (1.02 to 1.12) | 0.005 | 1.14 (1.10 to 1.18) | <0.001 |
| Lag4 day | 1.04 (0.99 to 1.08) | 0.17 | 1.09 (1.06 to 1.13) | <0.001 |
| Lag5 day | 1.04 (1.00 to 1.09) | 0.05 | 1.10 (1.07 to 1.13) | <0.001 |
| Lag1–3 day average | 1.06 (1.01 to 1.13) | 0.064 | 1.17 (1.13 to 1.22) | <0.001 |
| Influenza epidemic (yes vs no) | 1.12 (1.02 to 1.24) | 0.014 | 1.14 (1.01 to 1.29) | 0.003 |
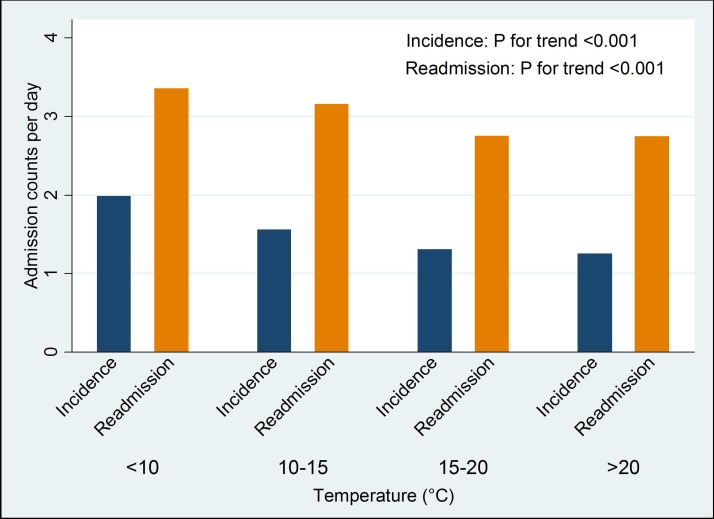
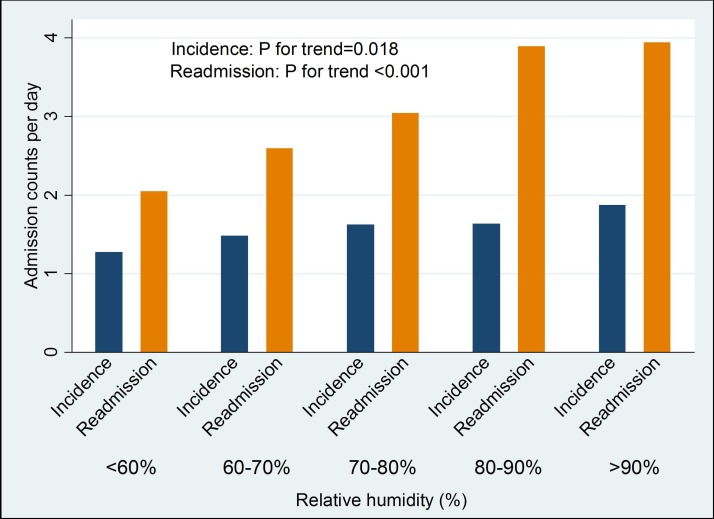
While air pollution was adversely associated with HF incidence, it was not or very weakly associated with readmission. Temperature, relative humidity and influenza epidemic periods, however, were associated with both HF incidence and all-cause readmission. These findings were consistent with those of HF-specific readmissions (online supplementary table 1). It is consistent for all environmental factors (PM2.5, temperature and relative humidity) that their associations with HF incidence were either strongest or second strongest with three lagging days average. This suggests that the environmental effect on HF is through continuous exposure, and for consistency, this three lagging day average (lag1–3) variables will be used for multivariable analysis. The associations between environmental factors and HF are also illustrated in figures 4–6, demonstrating dose–response relationships.
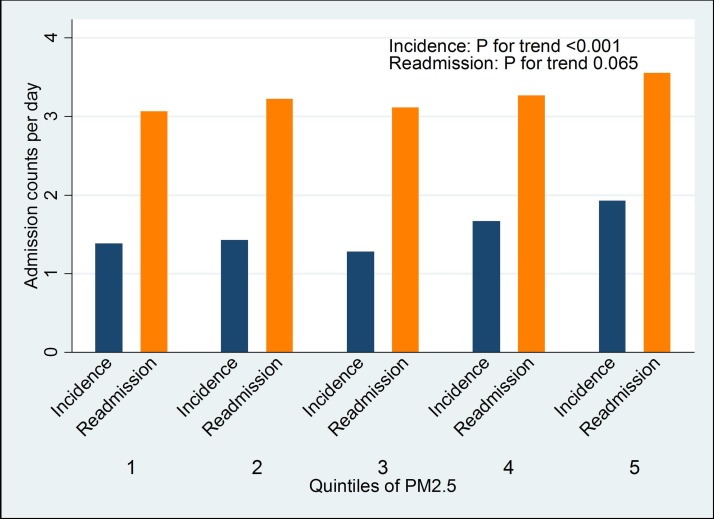
Figure 4.
Associations of quintile of PM2.5 with heart failure incidence and readmission.
Figure 5.
Associations of temperature with heart failure incidence and readmission.
Figure 6.
Associations of relative humidity with heart failure incidence and readmission.
bmjopen-2018-021798supp001.pdf (51.8KB, pdf)
Table 4 shows multivariable associations of air pollution and other environmental factors with the outcomes.
Table 4.
Multivariable Poisson regression of environmental factors with heart failure incidence and readmissions
| Heart failure incidence | All-cause readmissions | |||
| Risk ratio | P values | Risk ratio | P values | |
| PM2.5 lag1–3 day (per 10 µg/m3) | 1.10 (1.01–1.22) | 0.039 | 0.96 (0.89–1.04) | 0.44 |
| Temperature lag1–3 day (per 10°C) | 0.69 (0.59–0.81) | <0.001 | 0.88 (0.78–0.96) | 0.009 |
| Relative humidity lag1–3 day (per 10%) | 0.98 (0.92–1.05) | 0.56 | 1.10 (1.05–1.15) | 0.001 |
| Influenza epidemic (yes vs no) | 1.01 (0.80–1.21) | 0.45 | 1.20 (1.06–1.38) | 0.005 |
Further adjusted for weekday and weekend, school and public holiday and time trend.
Among the environmental factors, only PM2.5 and temperature remained as significant predictors of HF incidence. However, while temperature, relative humidity and presence of influenza epidemic were significantly associated with readmissions, PM2.5 did not predict readmissions among HF patients.
Possible threshold of PM2.5 in predicting HF incidence
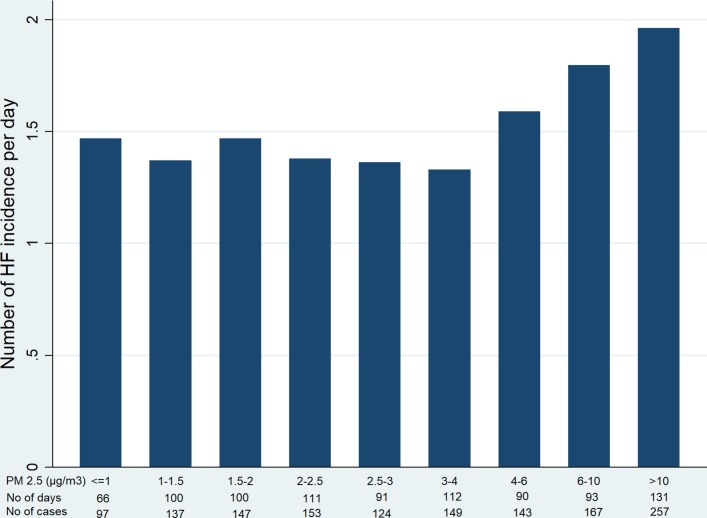
The relationship of PM2.5 with HF incidence count per day is shown in figure 4. Although there was a highly significant trend of increasing HF incidence throughout the whole range of PM2.5 included in this study, the level of HF incidence count per day appeared to increase when PM2.5 reached the fourth quintile. This finding suggests that there might be a threshold in the relationship of PM2.5 with HF incidence. Therefore, we further investigated this relationship by breaking the whole range of PM2.5 into nine groups each of which contained approximately 100 days of our study period (figure 7). The HF incidence count per day started to rise when PM2.5 was beyond 4 µm/m3. While the relationship between PM2.5 and HF incidence was null when PM2.5 <4 µm/m3 (RR=0.99 (95% CI 0.92 to 1.07)), it was significantly positive when PM2.5 ≥4 µm/m3 (RR=1.20 (95% CI 1.07 to 1.34)). This was consistent with no correlation between PM2.5 and HF incidence when PM2.5 <4 µm/m3 (β=−0.01 (−0.07 to 0.05), p=0.48) and a positive correlation when PM2.5 ≥4 µm/m3 (β=0.17 (0.07 to 0.35), p=0.008). These findings are controlled for temperature. Consistent findings were found when the PM2.5 range was broken by deciles (online supplementary figure 1). HF incidence count per day started to rise when PM2.5 was beyond the seventh decile (median 4.1 µm/m3). Using any threshold greater than 4 µm/m3 would result in a positive association between PM2.5 and HF incidence when PM2.5 below the new threshold (not shown).
Figure 7.
Possible threshold of PM2.5 with heart failure (HF) incidence.
Possible protective effects of HF medication against air pollution
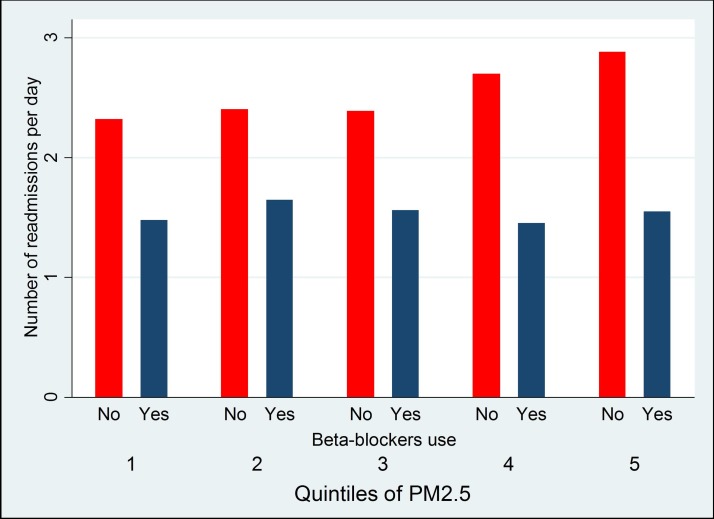
The concentration of PM2.5 was adversely associated with HF incidence but not with readmission. We further investigated whether HF medications prescribed after the confirmed diagnosis of HF may play a role in protecting patients against the adverse association with air pollution. We classified patients by whether they were prescribed common HF medications (beta-blockers, ACEi/ARB and diuretics) after their first admission with HF. For ACEi/ARB and diuretics, there was no difference in the association of PM2.5 with readmission count per day among patients who took these medications (ACEi/ARB: β=0.04 (−0.02 to 0.08), p=0.15, diuretics: β=0.05 (−0.01 to 0.11), p=0.084) and those who did not (ACEi/ARB: β=0.02 (−0.01 to 0.03), p=0.27, diuretics: β=0.04 (−0.02 to 0.09), p=0.11). However, while PM2.5 was not associated with readmission count per day among patients who took beta-blockers (figure 8, β=−0.01 (−0.07 to 0.06), p=0.89), PM2.5 was positively associated with readmission count per day among patients who did not take beta-blockers (figure 8, β=0.14 (0.05 to 0.23), p=0.002). There was a significant interaction between beta-blockers use and PM2.5 in their association with HF readmission (p=0.011). When restricting the analysis to HF-specific readmissions only, the association of PM2.5 with readmission count per day was also stronger among patients who did not take beta-blockers (β=0.09 (0.01 to 0.19), p=0.01) than that among patients who took beta-blockers (β=0.03 (−0.02 to 0.07), p=0.34).
Figure 8.
Possible protective effects of beta-blockers.
Discussion
This study investigated the relationships of particulate air pollution and other environmental factors with HF incidence and all-cause readmission and provided several important and novel findings. Acute exposure to ambient particulate matter is adversely associated with increased HF incidence after adjusting for other environmental factors, even in regions with very low air pollution such as Tasmania. More importantly, the relationship between PM2.5 and HF incidence appeared to have a threshold of approximately 4 µg/m3, which is far below the daily Australian and WHO standard of PM2.5 of 25 µg/m3. While temperature and relative humidity were associated with readmission, air pollution was very weakly associated with all-cause readmission among patients with HF. This might be partly due to protective effects of beta-blockers.
Air pollution and HF
Although the mechanisms underlying the relationship between particulate air pollution and HF are not well understood, possible causal pathways through increased oxidative stress and inflammation have been proposed.21–23 These pathways involve adverse effects on both the systemic arterial and venous circulation and lead to an increase in systemic blood pressure, myocardial ischaemia, vasoconstriction, atherosclerosis and arrhythmia. All these factors contribute to the exacerbation of HF. The positive association of air pollution with HF incidence shown in our study suggests that air pollution also plays a role in the development of HF.
To the best of our knowledge, this is the first time a threshold of PM2.5 has been detected for its association with HF. The very low threshold of PM2.5 observed in our study (approximately 4 µg/m3) explains the persistent adverse effects of air pollution when PM2.5 levels were lower than the Australian and WHO standard of 25 µg/m3.24 25 This is even lower than the target concentration of 5.8 µg/m3 used in the recent meta-analysis,13 which was the lowest concentration observed in 116 cities in the USA during 1999–2000 PM2.5 collection period.26 27 The finding that PM2.5 was linearly associated with HF when beyond the threshold is consistent with that found in other studies13 and suggests that any effort to improve air quality is beneficial if a level of PM2.5 as low as 4 µg/m3 is too difficult to achieve. Our findings link well to those in previous studies and together they form a complete picture of the relationship between PM2.5 and HF.
Possible protective effects of beta-blockers
PM2.5 was associated with increased HF incidence after accounting for other environmental factors but was not associated with HF specific or all-cause readmission. Although there were no interactions of ACEi/ARB or diuretic use on the relationship between PM2.5 level and HF readmission, there was a significant interaction of beta-blocker use with this relationship. This difference in the relationship of PM2.5 with HF incidence and HF specific or all-cause readmission may be partly due to the protective effects of beta-blockers. Because the mechanisms underlying the association between PM2.5 and HF are not fully understood, how the use of beta-blockers may contribute to this relationship is further unclear. However, there are three possible mechanisms: (1) beta-blockers are known to influence the autonomic nervous system, which is one of the proposed causal pathways between PM2.5 and HF. Specifically, previous studies have shown that the use of beta-blockers modifies the effect of PM2.5 on heart rate variability28–30—a reliable marker of autonomic activity and a predictor of increased risk for cardiovascular morbidity and mortality.31 32 (2) It is also reported that beta-blockers provide anti-inflammatory benefits in chronic HF by lowering the circulating level of tumour necrosis factor-alpha and increasing the levels of anti-inflammatory cytokines.33 (3) Furthermore, a protective effect of beta-blockers on exercise-induced ST depression after exposure to PM2.5 was also reported.34
One could argue that the patients without beta-blocker could not have tolerated taking them because they were too sick. Indeed, patients who were prescribed beta-blockers in our study were at younger age at their first admission and had slightly lower mean NYHA class, Charlson comorbidity index, heart rate and respiratory rate (online supplementary table 2), but there was no association with socioeconomic factors. However, patients who were prescribed ACEi/ARB also had similar characteristics (online supplementary table 3). Therefore, the protective effects of beta-blockers use (but not of ACEi/ARB) that were observed in our study were likely not fully explained by these discrepancies. However, because patients with HF usually have respiratory comorbidities such as asthma or chronic obstructive pulmonary disease that may contraindicate the use of beta-blockers, we could not completely exclude the possibility of a residual confounding caused by these conditions in our study. Thus, further studies on this are needed.
Differences between HF incidence and readmission
Apart from the differences in the associations with air pollution, HF incidence and readmission were also different in their associations with relative humidity and influenza infection epidemic. While these environmental factors were not independently associated with HF incidence, they were independently and adversely associated with readmission. This may be due to increased vulnerability once patients have developed HF, and a mild trigger might also lead to exacerbation of HF, or this may be due to the attenuation of significant effect of particulate air pollution resulted from beta-blocker use. The consistent findings for HF-specific readmissions and all-cause readmissions in our study support this speculation.
Strengths and limitations
This study has some particular strengths. The PM2.5 median level of 2.9 µg/m3 is a unique aspect of the study, as Tasmania has some of the world’s cleanest air. This has given us an opportunity to investigate the association of air pollution with HF within a range of air quality that was much wider than that of other previous studies of its kind. Second, our analyses were based on a wide range of environmental factors to determine the association of air pollution with HF. Third, the separation of HF incidence and readmission enabled us to investigate the differences in their associations with air pollution and other environmental factors.
This study is limited by the absence of available data on personal exposure to active and passive smoking, indoor temperature and other air pollutants (such as nitrogen dioxide, ozone and sulfur dioxide). Second, the adverse association between air pollution and HF might have been underestimated in our study, because our analyses were based on acute events associated with short-term exposures and did not take into account the effects of long-term exposure to air pollution. Third, our study did not take into account the duration, dosage and adherence of beta-blocker use and factors (including severity of HF) that may influence the use of beta-blockers. Future studies are therefore required to confirm this relationship and further explore if the benefit of beta-blockers use in this context is dose–response. Because most HF patients with reduced ejection fraction would have been prescribed beta-blockers if not contraindicated, it is important to confirm our findings for HF patients with preserved ejection fraction. Finally, due to the retrospective nature of our study, we only had echocardiography data on a subset of 451 patients (online supplementary tables 2 and 3) and were unable to investigate this matter. Further studies are therefore needed for this investigation.
Conclusions
In summary, our findings confirm the seasonal variations of HF and demonstrate an adverse relationship of air pollution with HF even in a very low range of PM2.5. For the first time, a possible threshold of PM2.5=4 µg/m3 has been detected in our study. This finding should encourage us to keep improving the air quality to reduce the burden of HF. Further studies are required to confirm the possible protective effects of beta-blockers against air pollution.
Supplementary Material
Acknowledgments
The authors would like to thank Dr Fay H Johnston for her intellectual advice and collecting meteorological data.
Footnotes
Contributors: KN conceived the research questions and designed the study. QLH conducted data collection, performed analysis and drafted a manuscript. CLB contributed to statistical analyses and interpretation. All authors contributed to data interpretation and revisions of the manuscript critically for important intellectual content. KN, QLH and THM obtained funding. All authors approved the final version of the submitted manuscript and agreed to be accountable for all aspects of the work.
Funding: Supported in part by a partnership grant from the National Health and Medical Research Foundation (Canberra), Tasmania Medicare Local (Hobart), Department of Health and Human Services (Hobart) and National Heart Foundation of Australia (Canberra).
Competing interests: None declared.
Patient consent: Not required.
Ethics approval: The study protocol was approved by Human Research Ethics Committee Tasmania (No. H0014931).
Provenance and peer review: Not commissioned; externally peer reviewed.
Data sharing statement: The anonymised original data can be shared upon the ethical approval.
References
- 1.Jencks SF, Williams MV, Coleman EA. Rehospitalizations among patients in the Medicare fee-for-service program. N Engl J Med 2009;360:1418–28. 10.1056/NEJMsa0803563 [DOI] [PubMed] [Google Scholar]
- 2.Mozaffarian D, Benjamin EJ, Go AS, et al. Heart disease and stroke statistics--2015 update: a report from the American Heart Association. Circulation 2015;131:e29–322. 10.1161/CIR.0000000000000152 [DOI] [PubMed] [Google Scholar]
- 3.Eapen ZJ, Liang L, Fonarow GC, et al. Validated, electronic health record deployable prediction models for assessing patient risk of 30-day rehospitalization and mortality in older heart failure patients. JACC Heart Fail 2013;1:245–51. 10.1016/j.jchf.2013.01.008 [DOI] [PubMed] [Google Scholar]
- 4.Blair JE, Zannad F, Konstam MA, et al. Continental differences in clinical characteristics, management, and outcomes in patients hospitalized with worsening heart failure results from the EVEREST (Efficacy of Vasopressin Antagonism in Heart Failure: Outcome Study with Tolvaptan) program. J Am Coll Cardiol 2008;52:1640–8. 10.1016/j.jacc.2008.07.056 [DOI] [PubMed] [Google Scholar]
- 5.Vivo RP, Krim SR, Liang L, et al. Short- and long-term rehospitalization and mortality for heart failure in 4 racial/ethnic populations. J Am Heart Assoc 2014;3:e001134 10.1161/JAHA.114.001134 [DOI] [PMC free article] [PubMed] [Google Scholar]
- 6.National Heart Foundation of Australia. A systematic approach to chronic heart failure care: a consensus statement. Melbourne: National Heart Foundation of Australia, 2013. [Google Scholar]
- 7.Boulay F, Berthier F, Sisteron O, et al. Seasonal variation in chronic heart failure hospitalizations and mortality in France. Circulation 1999;100:280–6. 10.1161/01.CIR.100.3.280 [DOI] [PubMed] [Google Scholar]
- 8.Stewart S, McIntyre K, Capewell S, et al. Heart failure in a cold climate. Seasonal variation in heart failure-related morbidity and mortality. J Am Coll Cardiol 2002;39:760–6. [DOI] [PubMed] [Google Scholar]
- 9.Inglis SC, Clark RA, Shakib S, et al. Hot summers and heart failure: seasonal variations in morbidity and mortality in Australian heart failure patients (1994-2005). Eur J Heart Fail 2008;10:540–9. 10.1016/j.ejheart.2008.03.008 [DOI] [PubMed] [Google Scholar]
- 10.Newby DE, Mannucci PM, Tell GS, et al. Expert position paper on air pollution and cardiovascular disease. Eur Heart J 2015;36:83–93. 10.1093/eurheartj/ehu458 [DOI] [PMC free article] [PubMed] [Google Scholar]
- 11.Atkinson RW, Carey IM, Kent AJ, et al. Long-term exposure to outdoor air pollution and incidence of cardiovascular diseases. Epidemiology 2013;24:44–53. 10.1097/EDE.0b013e318276ccb8 [DOI] [PubMed] [Google Scholar]
- 12.Lim SS, Vos T, Flaxman AD, et al. A comparative risk assessment of burden of disease and injury attributable to 67 risk factors and risk factor clusters in 21 regions, 1990-2010: a systematic analysis for the Global Burden of Disease Study 2010. Lancet 2012;380:2224–60. 10.1016/S0140-6736(12)61766-8 [DOI] [PMC free article] [PubMed] [Google Scholar]
- 13.Shah AS, Langrish JP, Nair H, et al. Global association of air pollution and heart failure: a systematic review and meta-analysis. Lancet 2013;382:1039–48. 10.1016/S0140-6736(13)60898-3 [DOI] [PMC free article] [PubMed] [Google Scholar]
- 14.He MZ, Zeng X, Zhang K, et al. Fine Particulate Matter Concentrations in Urban Chinese Cities, 2005-2016: A Systematic Review. Int J Environ Res Public Health 2017;14:E191 10.3390/ijerph14020191 [DOI] [PMC free article] [PubMed] [Google Scholar]
- 15.Tasmania Air Monitoring Report. Compliance with the National Environment Protection Measure (Ambient Air Quality) for 2013. Tasmania: Environment Protection Authority, 2014. [Google Scholar]
- 16.Climate Glossary. Commonwealth of Australia, Bureau of Meteorology. http://www.bom.gov.au/climate/glossary/seasons.shtml (cited 20 Mar 2014).
- 17.Health Indicators Tasmania 2013. Epidemiology unit, population health. Tasmania: Department of Health and Human Services, 2013. [Google Scholar]
- 18.Lyons L. Air pollution, environmental and respiratory diseases, Launceston and Upper Tamar Valley Tasmania. Tasmania: Launceston City Council, 1996. [Google Scholar]
- 19.National Climate Centre of the Bureau of Meteorology. Daily or three hourly weather data for bureau of meteorology stations. Melbourne: Bureau of Meteorology, 2010. [Google Scholar]
- 20.Huynh QL, Saito M, Blizzard CL, et al. Roles of nonclinical and clinical data in prediction of 30-day rehospitalization or death among heart failure patients. J Card Fail 2015;21:374–81. 10.1016/j.cardfail.2015.02.002 [DOI] [PubMed] [Google Scholar]
- 21.Mills NL, Donaldson K, Hadoke PW, et al. Adverse cardiovascular effects of air pollution. Nat Clin Pract Cardiovasc Med 2009;6:36–44. 10.1038/ncpcardio1399 [DOI] [PubMed] [Google Scholar]
- 22.Forastiere F, Agabiti N. Assessing the link between air pollution and heart failure. Lancet 2013;382:1008–10. 10.1016/S0140-6736(13)61167-8 [DOI] [PubMed] [Google Scholar]
- 23.Brook RD, Rajagopalan S, Pope CA, et al. Particulate matter air pollution and cardiovascular disease: An update to the scientific statement from the American Heart Association. Circulation 2010;121:2331–78. 10.1161/CIR.0b013e3181dbece1 [DOI] [PubMed] [Google Scholar]
- 24.Beelen R, Raaschou-Nielsen O, Stafoggia M, et al. Effects of long-term exposure to air pollution on natural-cause mortality: an analysis of 22 European cohorts within the multicentre ESCAPE project. Lancet 2014;383:785–95. 10.1016/S0140-6736(13)62158-3 [DOI] [PubMed] [Google Scholar]
- 25.Gan WQ, Davies HW, Koehoorn M, et al. Association of long-term exposure to community noise and traffic-related air pollution with coronary heart disease mortality. Am J Epidemiol 2012;175:898–906. 10.1093/aje/kwr424 [DOI] [PubMed] [Google Scholar]
- 26.Evans J, van Donkelaar A, Martin RV, et al. Estimates of global mortality attributable to particulate air pollution using satellite imagery. Environ Res 2013;120:33–42. 10.1016/j.envres.2012.08.005 [DOI] [PubMed] [Google Scholar]
- 27.Krewski D, Jerrett M, Burnett RT, et al. Extended follow-up and spatial analysis of the American Cancer Society study linking particulate air pollution and mortality. Res Rep Health Eff Inst 2009;140:5–114. [PubMed] [Google Scholar]
- 28.de Hartog JJ, Lanki T, Timonen KL, et al. Associations between PM2.5 and heart rate variability are modified by particle composition and beta-blocker use in patients with coronary heart disease. Environ Health Perspect 2009;117:105–11. 10.1289/ehp.11062 [DOI] [PMC free article] [PubMed] [Google Scholar]
- 29.Folino AF, Scapellato ML, Canova C, et al. Individual exposure to particulate matter and the short-term arrhythmic and autonomic profiles in patients with myocardial infarction. Eur Heart J 2009;30:1614–20. 10.1093/eurheartj/ehp136 [DOI] [PubMed] [Google Scholar]
- 30.Barclay JL, Miller BG, Dick S, et al. A panel study of air pollution in subjects with heart failure: negative results in treated patients. Occup Environ Med 2009;66:325–34. 10.1136/oem.2008.039032 [DOI] [PubMed] [Google Scholar]
- 31.Farrell TG, Bashir Y, Cripps T, et al. Risk stratification for arrhythmic events in postinfarction patients based on heart rate variability, ambulatory electrocardiographic variables and the signal-averaged electrocardiogram. J Am Coll Cardiol 1991;18:687–97. 10.1016/0735-1097(91)90791-7 [DOI] [PubMed] [Google Scholar]
- 32.Tsuji H, Larson MG, Venditti FJ, et al. Impact of reduced heart rate variability on risk for cardiac events. The Framingham Heart Study. Circulation 1996;94:2850–5. 10.1161/01.CIR.94.11.2850 [DOI] [PubMed] [Google Scholar]
- 33.Ohtsuka T, Hamada M, Hiasa G, et al. Effect of beta-blockers on circulating levels of inflammatory and anti-inflammatory cytokines in patients with dilated cardiomyopathy. J Am Coll Cardiol 2001;37:412–7. 10.1016/S0735-1097(00)01121-9 [DOI] [PubMed] [Google Scholar]
- 34.Pekkanen J, Peters A, Hoek G, et al. Particulate air pollution and risk of ST-segment depression during repeated submaximal exercise tests among subjects with coronary heart disease: the Exposure and Risk Assessment for Fine and Ultrafine Particles in Ambient Air (ULTRA) study. Circulation 2002;106:933–8. 10.1161/01.CIR.0000027561.41736.3C [DOI] [PubMed] [Google Scholar]
Associated Data
This section collects any data citations, data availability statements, or supplementary materials included in this article.
Supplementary Materials
bmjopen-2018-021798supp001.pdf (51.8KB, pdf)


