

Abstract
Nearly three billion people are exposed to household air pollution emitted from inefficient cooking and heating stoves, and almost the entire global population is exposed to detectable levels of outdoor air pollution from traffic, industry, and other sources. Over three million people die annually from ischemic heart disease or stroke attributed to air pollution, more than from traditional cardiac risk factors such as obesity, diabetes, or smoking. Clinicians have a role to play in reducing the burden of pollution-attributable cardiovascular disease. However, there currently exists no clear clinical approach to this problem. Here, we provide a blueprint for an evidence-based clinical approach to assessing and mitigating cardiovascular risk from exposure to air pollution. We begin with a discussion of the global burden of pollution-attributable cardiovascular disease, including a review of the mechanisms by which particulate matter air pollution leads to cardiovascular outcomes. Next, we offer a simple patient screening tool using known risk factors for pollution exposure. We then discuss approaches to quantifying air pollution exposures and cardiovascular risk, including the development of risk maps for clinical catchment areas. We review a collection of interventions for household and outdoor air pollution, which clinicians can tailor to patients and populations at risk. Finally, we identify future research needed to quantify pollution exposures and validate clinical interventions. Overall, we demonstrate that clinicians can be empowered to mitigate the global burden of cardiovascular disease attributable to air pollution.
Keywords: ambient air pollution, environmental health, global health, household air pollution, ischemic heart disease, outdoor air pollution, stove, stroke
Introduction
Cardiovascular disease (CVD) is the leading cause of death worldwide, with over 17 million premature deaths in 2016.1, 2 Exposures to air pollution were responsible for an estimated 3.3 million of those deaths, over 2.1 million from ischemic heart disease (IHD) and over 1.1 million from stroke.1, 2 Air pollution exposures are often ascribed to two categories: outdoor (or “ambient”) air pollution and household air pollution. Outdoor air pollution (OAP) is globally pervasive and is emitted from a combination of sources including traffic, industry, agricultural burning, wildfires, and resuspended dust.3 Household air pollution (HAP) arises from cooking and heating with stoves that inefficiently burn biomass and coal fuels, a common practice for almost half the world’s population.4, 5 Globally and in the United States, OAP ranks sixth and tenth, respectively, among all health risk factors for mortality.2, 6 HAP ranks eighth globally among all health risk factors for death, and second in low-income countries.2 Reduction in air pollution exposures is essential to attaining global targets, such as the the American Heart Association and World Heart Federation goal of reducing premature CVD mortality by 25% by 2025.7
Reducing pollution-attributable cardiovascular risk requires multisector policies and programs to reduce air pollution emissions and exposures at the local, regional, and international levels. The greatest benefits may be achieved through partnership across relevant sectors to regulate emissions, enforce air quality standards, share exposure data, provide patient-tailored interventions, and subsidize technologies to reduce patient exposures (Figure 1). Recent studies demonstrate that pollution-attributable cardiovascular risk is quantifiable and modifiable at the individual and population levels1, 3, 8-12. Clinicians therefore have an important role to play in reducing the global burden of CVD from air pollution. As with traditional CVD risk factors (e.g. high cholesterol), clinicians can identify patients at elevated risk from air pollution, and provide recommendations and interventions to reduce the risk of CVD. However, there is not currently a clear clinical approach to air pollution and CVD, and most clinicians lack the tools and partnerships necessary to assess risk of exposure in their service populations and to provide individual-level intervention recommendations to patients at elevated risk.
Figure 1. Partnerships in the reduction of pollution-attributable cardiovascular disease.
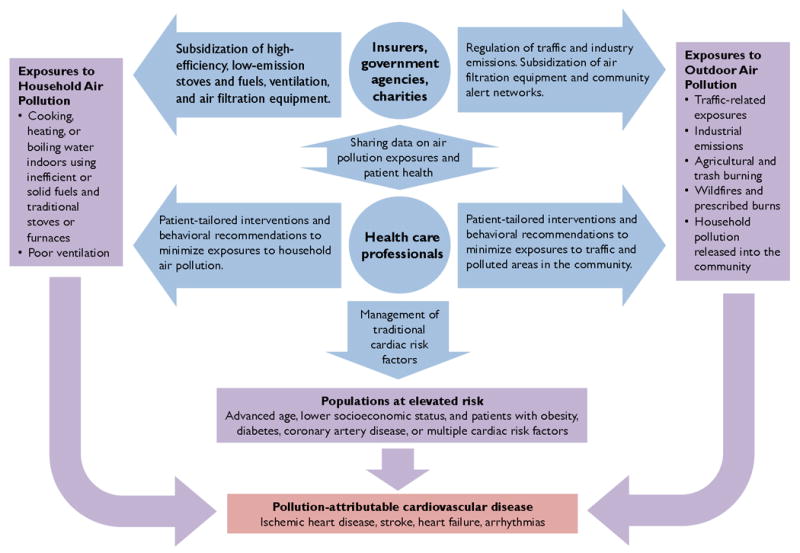
Conceptual diagram illustrating the effects of household air pollution, outdoor air pollution, and traditional risk factors (purple boxes and arrows) contributing to adverse cardiovascular events (red box). Health care professionals and provider organizations in partnership with government agencies, insurers, and charities take a multifaceted approach to improve cardiovascular health through reductions in air pollution exposures and underlying risk factors (blue circles and arrows). Government agencies and charities can provide data on local exposures, which clinicians can use to assess cardiovascular risk in their patients. Clinicians can then recommend patient-tailored interventions to reduce air pollution exposures. Insurance companies, government agencies, and non-governmental organizations can subsidize interventions such as facemasks, air filtration systems, and low-emission stoves and fuels.
In this review, we lay the foundation for an evidence-based clinical approach to improving cardiovascular health through the identification and reduction of patient air pollution exposures. We begin with a review of the global CVD burden attributable to air pollution, as well as the pathophysiology linking air pollution and CVD. We then describe how clinicians can: (1) identify patients exposed to increased levels of OAP and HAP; (2) estimate a patient’s attributable cardiovascular risk; and (3) recommend specific interventions to reduce air pollution exposures and improve cardiovascular health. Here, we define “clinicians” broadly to include physicians, nurses, community health workers, and other health professionals who may assist patients in reducing their exposures. Lastly, we discuss additional research needed to validate exposure metrics, screening tools, and interventions.
The Global Burden of Cardiovascular Disease Attributable to Air Pollution
Globally, 6.1 million deaths were attributed to air pollution in 2016, an estimate that has remained consistent since 1990.1, 6 Of these, nearly 4.1 million deaths were attributed to OAP and over 2.5 million to HAP.6 (Some deaths were attributable to both household and outdoor pollution.) The majority of these deaths (3.3 million) were due to cardiovascular disease, although air pollution has been associated with many other health outcomes in infants, children, and adults including low birthweight and preterm birth, lower respiratory infection, asthma exacerbation, chronic obstructive pulmonary disease, lung cancer, hypertension, and neurodevelopmental and neurodegenerative disorders.6, 13
Looking specifically at CVD, air pollution was responsible for 19% of all cardiovascular deaths worldwide in 2016, including 23% of all ischemic heart deaths and 21% of all stroke deaths1, 6. The 3.3 million cardiovascular deaths linked to air pollution exceeded that of several traditional risk factors such as smoking (2.48 million), elevated body-mass index (2.85 million), and elevated fasting plasma glucose (2.84 million) (Figure 2).1, 2 In fact, elevated systolic blood pressure was the only studied individual risk factor contributing to a significantly greater burden of cardiovascular mortality compared with air pollution.1 Cardiovascular mortality was higher in susceptible populations, including individuals of advanced age, lower socioeconomic status, and with other health risk factors like diabetes.2, 3, 14
Figure 2. Trends in global cardiovascular deaths attributable to air pollution and several traditional cardiovascular risk factors for men and women from 1990 to 2016.
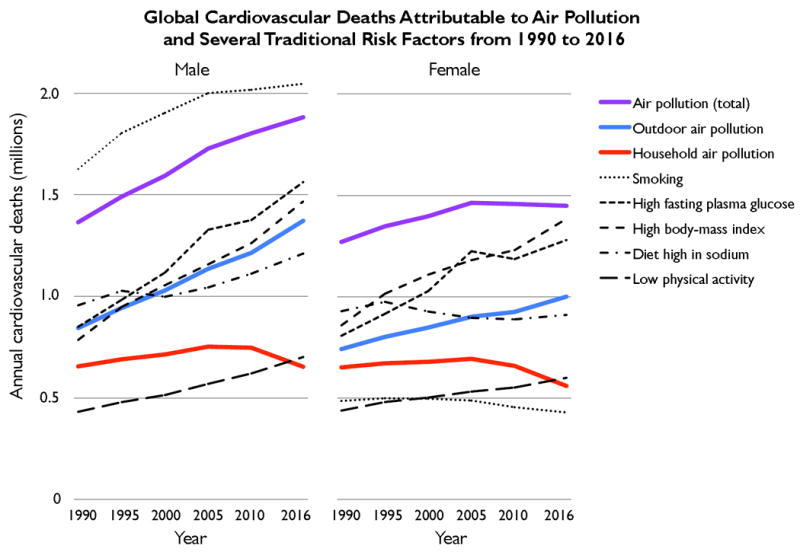
Cardiovascular deaths are from ischemic heart disease, ischemic and hemorrhagic stroke, rheumatic heart disease, hypertensive heart disease, cardiomyopathy, myocarditis, atrial fibrillation and flutter, aortic aneurysm, peripheral vascular disease, endocarditis, and other cardiovascular diseases. “Air pollution (total)” refers to cardiovascular deaths attributed to both outdoor and household sources of particulate matter pollution (PM2.5). Data are from the most recent Global Burden of Diseases, Injuries, and Risk Factors Study.1, 6
The massive burden of CVD attributed to air pollution is partially explained by widespread exposures to OAP and HAP. Globally, 92% of the population lives in places where the World Health Organization (WHO) OAP guidelines are not met.14 As a result, OAP was responsible in 2016 for over 2.3 million cardiovascular deaths and 53.8 million disease-adjusted life years (DALYs), a metric that combines years of life lost from premature death and years lived in less than full health.1 Worse, mortality attributable to OAP is expected to double by 2050, with increases driven largely by rising pollution levels in rapidly industrializing countries in Asia, as well as an aging global demographic with higher rates of non-communicable disease.2, 6, 15, 16 Similarly, nearly 3 billion people are exposed to hazardous levels of household pollutants from cooking and heating.4, 5 HAP was responsible for over 1.2 million cardiovascular deaths and 29.8 million DALYs in 2016.1 The burden of household air pollution has declined since 1990 as liquefied petroleum gas and other renewable sources of energy have become increasingly available in low- and middle-income countries, replacing solid fuel burning.2, 6 Occupational exposures to different types of airborne pollutants may contribute over 1 million premature deaths, but their contribution to the CVD-related disease burden has yet to be sufficiently characterized and quantified.17, 18
Pathophysiology of Air Pollution and CVD
Air pollution is a complex mixture of airborne pollutants that generates CVD through several pathways. Its components include particulate matter (PM) and gaseous pollutants such as ozone, nitrogen dioxide (NO2), volatile organic compounds (VOCs), carbon monoxide (CO), and sulfur dioxide (SO2). PM varies in its composition and size, and is usually classified into three size groups: coarse particles (PM10, diameter <10 and ≥2.5 μm), fine particles (PM2.5, diameter <2.5 μm), and ultrafine particles (<0.1 μm). PM2.5 originates from combustion and non-combustion sources including industrial sources, tailpipe emissions, brake and tire wear, resuspended soil and dust, wildfires and prescribed burns, and agricultural, biomass, and coal burning.8 The chemical constituents of PM2.5 vary by emissions source and include elemental carbon, transition metals, complex organic molecules, sulfate, nitrate, soil and dust.19, 20
The American Heart Association and the European Society of Cardiology both recognize PM2.5 as a cardiovascular risk factor.3, 8 Numerous studies have confirmed that PM2.5 increases the risk of cardiovascular mortality and nonfatal cardiovascular events.3, 6, 10, 21, 22 However, no single component or source of PM2.5 has been found to determine uniquely the toxicity of the PM2.5 mixture.6 Evidence from toxicological and experimental studies indicate that PM2.5 particles travel to the lung’s alveoli where they trigger a cascade of physiologic events.3, 8 Acutely, autonomic reflex arcs from the lung trigger increased sympathetic tone, and PM2.5 particles are transmitted to the blood resulting increased serum concentrations of ultrafine particles, soluble metals, and organic compounds. Chronic exposure to PM2.5 also causes oxidative stress and inflammation in the lung. Together, these processes cause systemic oxidative stress and inflammation, leading to increases in vascoconstriction, blood pressure, heart rate, insulin resistance, dyslipidemia, endothelial dysfunction, platelet aggregation, thrombogenicity, and plaque instability.3, 8, 10, 21, 23 Through these pathways, brief exposures to PM2.5 may precipitate ischemic heart disease, stroke, heart failure, venous thromboembolism, arrhythmias, and increased cardiovascular hospitalization and mortality.3, 8, 10, 21, 22, 24, 25 Likewise, prolonged exposures to PM2.5 also increases the risk of developing hypertension, diabetes, HDL dysfunction, atherosclerotic disease, the metabolic syndrome, and overall cardiovascular mortality.3, 8, 21, 24-26 The pathophysiology of air pollution and cardiovascular disease has been discussed more thoroughly elsewhere, to which the reader is referred for additional details.3, 8-10
Exposure-Response Relationships
Drawing from numerous prospective studies of OAP and both secondhand and active smoking, a series of Integrated Exposure-Response Curves (IERs) were developed to estimate the relative risk of cardiovascular events and mortality across a range of annual PM2.5 exposures. Figure 3 illustrates these relationships for ischemic heart disease and stroke, as described by Burnett et al. (2014) and Shin et al. (2016) for use in the Global Burden of Disease Study.11, 27, 28 In later sections, we will examine how IERs can be used to estimate patients’ relative risk of pollution-attributable CVD. Relative risk is used rather than absolute risk, since pollution-attributable risk of cardiovascular events varies with patients’ other cardiac risk factors. A tool to estimate a patient’s absolute risk still requires development.
Figure 3. Estimated exposure-response curves for PM2.5-attributable relative risk of mortality for ischemic heart disease and stroke.
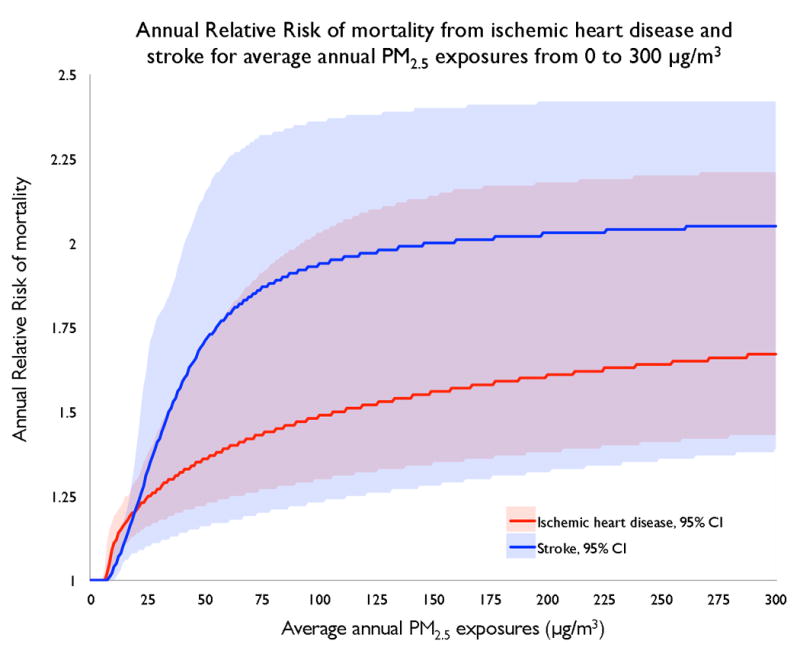
The model fits population data compiled from multiple studies and meta-analyses on the rates of IHD and stroke mortality at different levels of PM2.5 exposures from outdoor air pollution, secondhand smoke, and active smoking. No studies on household air pollution are included. Low levels of exposure are characterized by a substantial marginal risk per unit change in exposure, with decreasing marginal risk at higher exposure levels. Exposure-response curves are available for specific age groups and countries. Data from the Global Burden of Disease Study.6, 11, 27, 28
The exposure-response curve is steep at lower levels of exposure and then flattens out at higher levels (Figure 3). Consequently, the largest health benefits accrue from interventions that reduce exposures to low levels.29, 30 For example, an intervention or policy that reduces PM2.5 exposure from 300 to 100 μg/m3 may have a smaller impact on cardiovascular risk than one that reduces PM2.5 exposure from 100 to 30 μg/m3. This has serious clinical and policy implications. A single basic intervention may provide significant health benefits to an individual initially exposed to low pollution levels. However, a package of costlier interventions may be required to accrue any cardiovascular benefits for an individual initially exposed to high pollution levels from different sources.
Developing A Clinical Approach to Air Pollution
To reduce the global burden of CVD, clinicians must be empowered to mitigate the cardiovascular effects of air pollution in their service populations. As with traditional cardiac risk factors, this requires an assessment of risk and the provision of interventions. In what follows, we review advances in air pollution risk assessment and mitigation to outline an evidence-based approach for clinicians to identify and intervene upon air pollution exposures. As discussed above, we define clinicians broadly to include physicians, nurses, community health workers, and other health professionals who may assist patients in reducing their exposures to air pollution across a variety of settings. Our approach is also summarized in Figure 4.
Figure 4. Key elements in a clinical approach to mitigating risks of air pollution and protecting cardiovascular health.
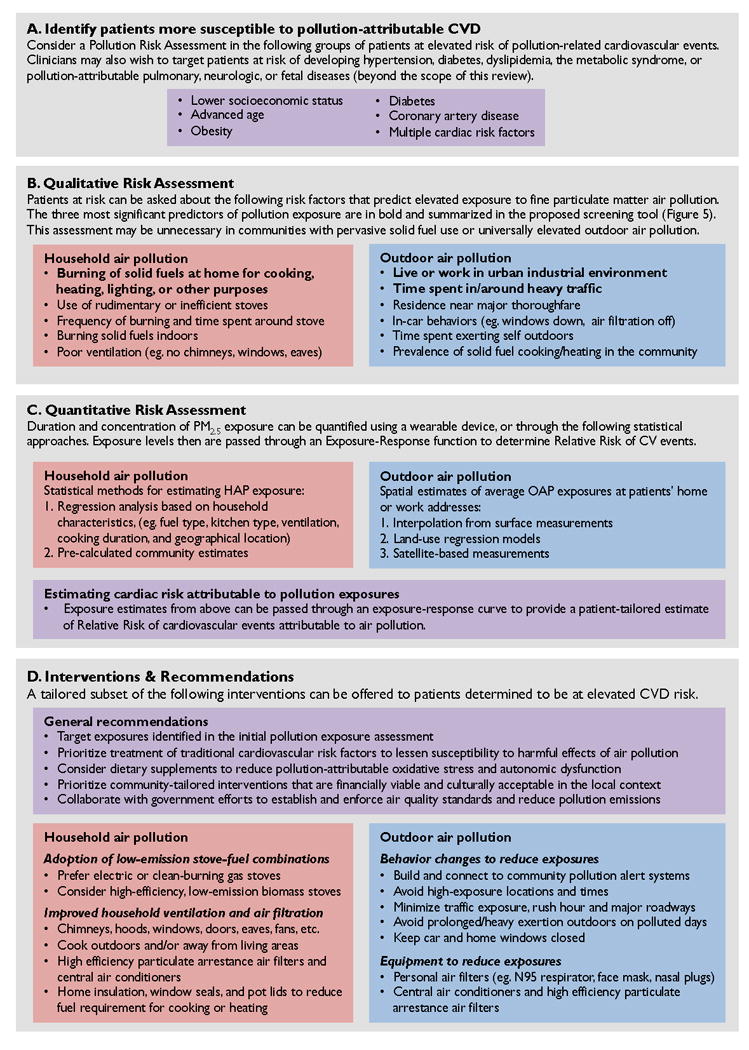
Summary of key risk assessment tools and targeted interventions that may be incorporated in a clinical approach to protecting cardiovascular health from the harmful affects of household and outdoor air pollution. (A) Clinicians may screen for patients more susceptible to pollution-attributable cardiovascular disease and therefore more likely to benefit from further assessment and interventions. (B) Clinicians may perform a qualitative assessment to identify individual risk factors that predict elevated exposures to air pollution. (A sample screening tool is provided in Figure 5.) (C) Individual exposure levels may be quantified via a variety of methods, including direct measurement or modeled estimates. Exposure estimates may then be used to estimate relative risk of cardiovascular events. (D) For individuals at elevated risk of pollution-attributable cardiovascular disease, clinicians can offer a variety of tailored recommendations and interventions.
A. Identify patients more susceptible to air pollution
Given the time constraints faced by all clinicians, it is reasonable to target patients most likely to benefit from intervention. Individuals likely to benefit may be more susceptible, more vulnerable, or both.
Susceptible individuals are those at greater relative risk of CVD outcomes for the same level of air pollution exposure. The data on susceptibility remain mixed; no group has been found to be universally more susceptible than others. However, current opinion is that individuals with the following characteristics are at higher risk of pollution-attributable cardiovascular events: advanced age, lower socioeconomic status, or those with obesity, diabetes, coronary artery disease, or other traditional cardiac risk factors.3, 8 Additionally, since long-term exposure to PM2.5 has been shown to increase the risk of developing other cardiac risk factors (e.g., hypertension, diabetes, dyslipidemia, atherosclerosis, metabolic syndrome), clinicians may wish to target individuals at risk of developing these conditions. Finally, although beyond the scope of this paper, clinicians may wish to target patients at risk of developing pulmonary, neurologic, or fetal diseases due to air pollution exposure.
Vulnerable individuals are those exposed to higher levels of air pollution. As will be discussed in the following sections, clinicians may use qualitative and quantitative tools to assess exposures and identify vulnerable patients.
B. Qualitative risk assessment
We recommend that clinicians and community health workers perform a brief air pollution exposure assessment with patients. This screen can be added to questions that clinicians already ask about diet, exercise, smoking, alcohol, and other cardiac risk factors. We propose an air pollution clinical screening tool (Figure 5) that contains three simple questions, one for household exposures and two for outdoor exposures. The questions are based on well-established predictors of air pollution exposure. An affirmative answer to any question suggests a potentially hazardous exposure that warrants intervention to reduce health complications. For affirmative answers, we provide follow-up questions about variables that may worsen exposures and guide patient-tailored interventions. Of note, occupational air pollution exposures may also contribute to cardiac risk,18 but remain inadequately characterized for physicians to characterize risk and intervene based on an individual’s occupational duties and related microenvironments.17
Figure 5. Clinical screening tool for air pollution risk.
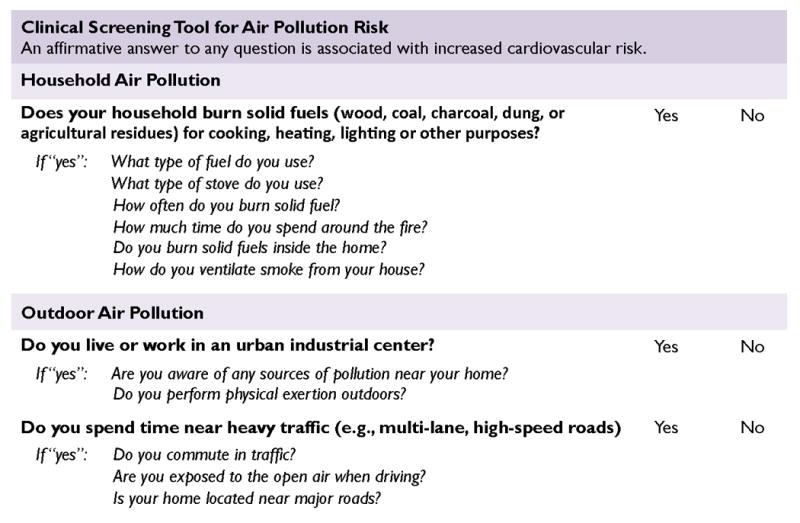
Novel evidence-based clinical screening tool for identifying patients exposed to hazardous levels of air pollution. The tool contains three questions covering the most established predictors of household and outdoor air pollution exposure. For questions answered in the affirmative, we provide several follow-up questions to help resolve factors that may exacerbate exposures and guide patient-tailored interventions. Although based on existing exposure-response data, this tool is pending validation.
Clinicians may find they can circumvent a qualitative assessment in populations known to have pervasive elevated exposures to PM2.5. For example, in some urban environments in rapidly industrializing countries, clinicians may safely assume that patients are regularly exposed to high levels of OAP. The WHO, for example, provides data on mean PM2.5 concentration levels for specific cities and countries.31 Similarly, clinicians working in low-income communities without access to clean fuels might assume that patients—particularly women—are regularly exposed to high levels of HAP.4, 5 This approach requires caution, however, since there may be inter-individual variation even in high-exposure settings. Additionally, clinicians may find they are better able to design a patient-tailored strategy by first screening for specific exposures.
Screening for exposures to household air pollution (HAP)
Numerous studies have identified predictors of exposure to HAP.4, 32-36 The predictor most consistently associated with hazardous exposures across settings is frequent use of solid fuel (wood, coal, charcoal, dung, or agricultural residues) stove for cooking, space heating, water boiling, or other uses in the home or community. Consequently, we include this indicator in our clinical screening tool (Figure 5). Patients answering in the affirmative are more likely to be at elevated risk of cardiovascular complications due to HAP exposures than those living in communities where homes use electricity or clean fuels like gas. Geographic location may also help clinicians predict fuel type, as different regions vary regarding affordable, available, and culturally preferred fuel sources.4 Solid fuel cookstoves are most likely to be used in rural households in low-income countries.4, 36 Clinicians also note that, in both high and low-income settings, space heating with wood-burning or coal fireplaces and stoves can be an important contributor to air pollution exposures in cold weather climates.4, 35
For patients at risk, clinicians can ask follow-up questions about other variables that may attenuate or exacerbate exposures. First, clinicians can ask about frequency of solid fuel burning. Households burning solid fuels indoors more than 2-3 times per week may be at highest risk of hazardous exposures.37 Second, clinicians can ask about total time spent in the kitchen, as cooks and others in the kitchen suffer higher exposures.32-34 Third, clinicians can ask about household layout, as solid fuel cookstoves or heaters inside of the living space may result in higher exposure to PM2.5 concentrations than stoves located in separate buildings or the outdoors.32 Finally, clinicians can ask about types of ventilation and air filtration, as exposures are predictably lower in rooms with windows, open eaves, chimneys, hoods, fans, and indoor air filtration systems.32
Screening for exposures to outdoor air pollution (OAP)
Estimating patients’ level of exposure to OAP requires both an estimation of OAP levels in their communities and an understanding of patients’ activities. Using the air pollution clinical screening tool, we recommend that clinicians ask about two factors shown consistently to predict exposure to OAP: proximity of household to urban or industrial centers and time spent near heavy traffic.3, 8, 38-41 It should be noted that outdoor PM2.5 infiltrates buildings, so individuals need not be outdoors to be exposed.8, 42
First, clinicians can ask whether patients live or work in the vicinity of a major urban industrial center. These areas typically house more PM2.5 emission sources, such as factories, refineries, power plants, and traffic. Numerous studies demonstrate that urban industrial centers are associated with elevations in OAP,38, 39 with well-recognized examples including Beijing43 and Los Angeles.44 Future research is needed to determine specifically what characteristics of urban/industrial environments best predict PM2.5 exposures (e.g., population density, total size, types of factories, etc.). For patients living in rural or less-developed areas, clinicians may also ask about proximity to common sources of OAP, including small-scale industry, wildfires, seasonal agricultural burning, solid waste burning, and neighbors’ household use of solid fuels.
Next, clinicians can inquire about time spent near heavy traffic. Proximity within a few hundred yards of multi-lane or high-speed roadways—whether living, working, or driving—is a consistently strong surrogate measure of traffic-related air pollution exposure.38, 40, 41 Short-term exposure to vehicular traffic emissions has been associated with a tripling of the odds of myocardial infarction .45 Additional factors that can increase traffic pollution exposures include commuting during rush-hour, driving in traffic with car windows rolled down, or use of air conditioning with external circulation.3 Future research is needed to determine specifically what characteristics of traffic most reliably predict PM2.5 exposures (e.g. hours spent in heavy traffic, residence within 100 meters of a major multi-lane, high speed roads, etc.).
In addition to these screening questions, clinicians may inquire about physical exertion outdoors (e.g., active transportation during work commutes, manual labor, exercising). The risk of cardiovascular events is higher for patients exerting themselves in polluted environments, particularly during warm days or rush hour when pollution levels are likely to be elevated.3, 8 Finally, an open-ended question about air pollution in the patient’s community may identify sources of risk that otherwise would have otherwise gone undetected. Together, these questions can help provide a qualitative picture of patients’ exposure to OAP. We now turn to more precise methods for quantifying air pollution exposures.
C. Quantitative Risk Assessment
Quantifying air pollution exposure requires data collection and analysis currently beyond the scope of most clinicians. However, we anticipate that existing innovations, including shared pollution models, personal electronics, and risk calculators, will accelerate and facilitate estimation of air pollution exposures in clinical practice.
Personal monitoring
The most accurate way to quantify an individual’s PM2.5 exposure is likely through wearable monitoring devices.12 At present, most devices are too bulky, noisy, and expensive to wear for extended measurement periods. However, recent developments in low-cost and lightweight wearable devices may soon facilitate personal PM2.5 monitoring, with conceivable integration into cellular phones, wristwatches, or other personal electronic devices.10, 12 These devices could automatically calculate patients’ pollution-attributable cardiovascular risk, which could be used by clinicians to inform decisions about risk modification.
Exposure modeling
Until personal monitors become widely available, exposure modeling remains the principal way to quantify pollution exposures. Exposure modeling is currently beyond the capability of most individual clinicians. Instead, clinicians can rely on publicly available models to obtain estimates of pollution exposures in their health facility catchment areas, including at patients’ home or work address. In the next sections, we describe available modeling approaches.
Quantifying exposure to HAP
Quantifying HAP exposure through models is difficult since exposures vary with cookstove type, fuel type, household configuration, ventilation, geography, weather conditions, and individual time-activity patterns.29 Exposure may also vary by age and gender, based on who is more likely to cook or spend time indoors near the fire.33, 34 A recent review of various methods for estimating individual HAP exposure—including assessing various surrogate measurements of exposure (e.g. self-reported fuel type, stove type, or time spent cooking), use of personal pollution monitors, and collection of individual biomarkers—concluded that all methods still have major unanswered questions regarding their precision, accuracy, and generalizability in capturing long-term or ‘usual’ exposures.29
Even so, estimates are required to inform clinical decisions. The most widely applied estimation method was developed in India, where researchers measured PM2.5 concentrations in rural Indian households using traditional solid fuel stoves.32. They then developed a regression model to predict household PM2.5 concentrations based on fuel type, kitchen type, ventilation, cooking duration, and geographic location. This model has been applied to country-level data on household fuel use from the WHO household energy database to estimate HAP concentrations around the world.46 The WHO also provides a growing database of HAP exposures and indoor concentration measurements from studies conducted around the world.47 These data can be used to estimate HAP exposures in a clinician’s service population.
Quantifying exposure to OAP
Statistical models can generate estimates of OAP exposures based on home or work address. Exposure maps are already available for some regions through the WHO31 and the U.S. Environmental Protection Agency (EPA).48-50 Alternatively, large provider organizations may collaborate with exposure scientists to develop their own in-house models and maps of pollution exposures for their service populations. The choice of model will depend on a number of factors including cost, the existence of ground-based air pollution monitoring networks, the density of local pollution sources, and the heterogeneity of pollution distribution. Here we review several models that produce clinically useful data.
Spatial estimation
The simplest way to model air pollution is to infer exposure levels for a city or region based on one or more sets of stationary outdoor monitors or industry-reported emission sources. Data from ground-based monitors are increasingly publically available for numerous locations worldwide, including China, India, Europe, and the United States.48, 49 In regions with multiple monitors, regression methods (e.g., “kriging”) can predict pollution levels for any address between measured points. For example, a krig’d map of PM2.5 levels across the United States illustrated higher levels of cardiovascular mortality due to elevated pollution in California, Appalachia, and the Rust Belt.51
Emissions models
Emissions models predict pollution levels based on geographic data about emissions rates from sources of polluters affecting air quality. Models may include meteorological data and photochemical modeling of pollutants throughout different atmospheric layers. For example, the EPA’s Community Multiscale Air Quality (CMAQ) modeling system combines an emissions model, meteorological model, and chemical simulation to provide estimates of many different air pollutants at a 12km resolution across the United States.50
Land-use regression models
Land-use regression (LUR) models predict PM2.5 exposure at various scales, including household address, based on a number of air pollution-related predictor variables. In both urban and rural settings in Europe and North America, the strongest predictors of air pollution concentrations included nearby heavy traffic, altitude, land use, population density, topography, and meteorology.38-41 These models can also account for patient activity patterns (e.g., hours spent in traffic).45 An example of LUR modeling is the European Study of Cohorts for Air Pollution Effects (ESCAPE) project that estimates air pollution levels at participant home addresses in 20 regions across Europe.52
Satellite measurements and chemical transport models
Satellite-based methods estimate exposures for regions without ample land-based detection systems. Currently, researchers rely on aerosol optical depth data from NASA satellite instruments, often combined with a chemical transport model.53 As an example, the Global Burden of Disease Study estimates global OAP exposures by combining satellite data with modeled estimates.53 Recently, mixed models have combined satellite measurements with meteorological and land use variables to produce estimates of both short- and long-term exposures at 1km resolution with high fidelity to ground-based measurement.54 Global estimates from these mixed models are pending.
Translating Exposure into Estimates of Cardiovascular Risk
Using integrated exposure-response models (IERs, Figure 3), health care professionals can quickly estimate the annual relative risk of IHD and stroke mortality for different levels of pollution exposure.11, 27 Tailored curves are available for specific age groups and countries.
In the United States, for example, average population-weighted OAP exposure is 12 μg/m3, 55 corresponding on the IERs to a relative risk of 1.1 for IHD and 1.1 for stroke. In China, average population-weighted OAP exposure is 59 μg/m3,55 corresponding to a predicted relative risk of 1.4 for IHD and 1.8 for stroke. Daily OAP levels in urban centers can exceed these yearly averages, with episodic levels greater than 100 μg/m3 recorded in Los Angeles and levels greater than 200 μg/m3 recorded in New Delhi. For households using solid fuels, PM2.5 exposures are estimated to range from approximately 100 μg/m3 to 600 μg/m3 in India,32 corresponding with a predicted annual relative risk ranging from 1.5-1.8 for IHD and 1.9-2.1 for stroke.
Despite having lower exposures, residents in high-income countries remain at risk. A recent cohort study of the entire US Medicare population followed for twelve years found that an increase of 10 μg/m3 in ambient PM2.5 in ZIP Code of residence was associated with a 7.3% (95% CI 7.1 to 7.5) increase in all-cause mortality.56 Similarly, a large Canadian cohort study found that a 5 μg/m3 increase in PM2.5 in postal code of residence was associated with an increased incidence of ischemic heart disease mortality (hazard ratio of 1.085 (95% CI 1.073 to 1.099).57 These numbers are consistent with recent studies that estimate a 0.8% increase in short-term cardiovascular mortality, and an 11% increase in long-term cardiovascular mortality, for adults experiencing a 10 μg/m3 increase in PM2.5 exposure, with considerable regional variation.58, 59 Importantly, these calculated risks likely underestimate the true effect, in part due to measurement error of the exposure and subsequent bias towards the null in studies used to develop the IERs.22, 60
Risk Mapping
Geospatial risk maps help identify populations at elevated cardiovascular risk from OAP. Risk maps are created by passing exposure maps (described above) through an exposure-response curve. Using these risk maps, clinicians can estimate the relative risk of cardiovascular events for different service populations. Different models may be developed to look at short-term cardiovascular risks (using real-time data on pollution levels and weather patterns8), as well as longer-term risks (using average yearly pollution levels).
Figure 6 illustrates a risk map based on average yearly pollution exposure in New York City. This risk map combines annual average PM2.5 concentration estimates based on a land-use regression model61, 62 with a frequently cited exposure-response curve.11 The resulting map is searchable for particular neighborhoods, enabling clinicians to estimate exposures to air pollution and relative risk of IHD mortality. Since the exposure-response relationship varies with individual characteristics (e.g., age), these risk estimates apply to populations and may not be predictive of individual risk.
Figure 6. Risk map prototype illustrating estimated relative risk of ischemic heart disease mortality attributable to fine particulate matter air pollution by location in New York City in 2014.
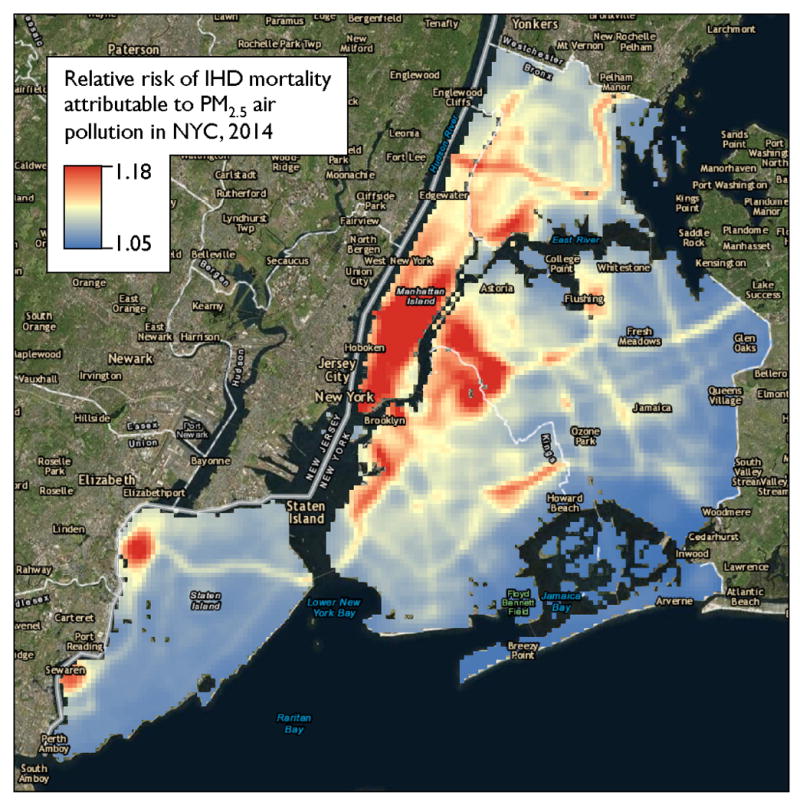
This searchable risk map enables clinicians to estimate PM2.5 exposure and attributable risk of ischemic heart disease mortality based on location in New York City. The risk map combines a frequently cited exposure-response curve11 with annual average PM2.5 concentration estimates based on a land-use regression model.61, 62 These risk estimates apply to populations and may not be predictive of individual risk. Exposure estimates used with permission from The New York City Department of Health and Mental Hygiene, Queens College Center for the Biology of Natural Systems, and Zev Ross Spatial Analysis.
Deciding when to intervene
A central problem in the clinical management of air pollution exposure is deciding which individuals should receive intervention. This issue hinges on the difference between relative risk and absolute risk, as well as on the risks versus benefits of potential intervention. For an individual with low baseline cardiac risk, exposure to air pollution may increase relative risk significantly, while the absolute risk of a cardiac event will remain very low. Still, air pollution generates a massive burden of disease by affecting the majority of the global population. In addition, although we strongly support policies targeting air quality at the population level (see “Interventions” section), such approaches typically are beyond the scope of clinical practice.
Clinicians can maximize their impact in the setting of limited resources by targeting patients that are both highly susceptible to pollution-attributable cardiac events and exposed to elevated levels of air pollution. We have so far provided a blueprint to identify these high-risk patients on the criteria of susceptibility and vulnerability, and quantify their relative risk of a cardiac event.
Going forward, clinicians will benefit from tools to estimate individual patients’ absolute risk of cardiac outcomes for various levels of exposure. For example, the well-known Atherosclerotic Cardiovascular Disease (ASCVD) Risk Calculator could be expanded to include data on air pollution and produce similar 10-year risk estimates.63 Patients then could be stratified into different levels of risk and assigned interventions accordingly. Estimation of absolute risk is also helpful for evaluating the efficacy and practicality of interventions. Ultimately, formal guidelines will emerge to help clinicians risk stratify patients and prescribe specific interventions accordingly.
D. Interventions for patients at risk
Observational studies of adults in the United States and Europe demonstrate that reducing exposures to air pollution rapidly decreases the immediate risk of acute coronary syndromes, heart failure, stroke, and arrhythmias, as well as the long-term development and progression of atherosclerosis.3, 8, 26 Clinicians, therefore, may accrue health benefits for their patients by helping mitigate air pollution exposures. In what follows, we review specific evidence-based interventions to reduce exposures to HAP and OAP. As will be discussed in Future Directions, some individual-level interventions still require definitive prospective studies to establish a reduction in cardiovascular outcomes.
Many of the proposed interventions require the provision of specialized equipment and training. Although this is currently beyond the scope of clinical practice, this is likely to change. Providers already assist patients in obtaining equipment such as wheelchairs and home blood pressure cuffs, via partnerships and subsidies from insurance companies, government agencies, charities, device manufacturers, pharmacies, and supply stores. Such collaborations will become increasingly common to provide patients with equipment to reduce air pollution exposures. This change will be driven in part by evidence that these interventions are cost-saving. That is, it is often cheaper to mitigate pollution exposures than to bear the costs of pollution-attributable disease and environmental degradation.64
Interventions for household air pollution
Exposures to PM2.5 in settings of solid fuel burning often range in the hundreds of micrograms per cubic meter.32 Consequently, given the estimated supralinear nature of the IER curves, it may be necessary to substantially reduce HAP levels to produce a measureable cardiovascular benefit at the population level. Several trials investigating improved stoves and air filtration devices have demonstrated significant improvements in blood pressure,65, 66 ST-segment depression,67 inflammatory biomarkers,68, 69 endothelial function,70 or microvascular flow.71 Other studies identified behavior patterns and home layouts associated with lower levels of exposure.33, 72, 73 However, no trials have examined the effect of a household pollution intervention on cardiovascular mortality or the incidence of stroke or myocardial infarction. It therefore becomes difficult at present to recommend, with certainty, specific household energy interventions that will reliably improve cardiovascular health.
The most effective way to reduce HAP exposure is to eliminate household solid fuel burning altogether. Electrification and access to clean-burning gas (e.g., liquefied petroleum gas or piped natural gas) therefore represent important health goals.74 Although a shift to clean fuels may be logistically and economically challenging for some countries in the near term, others are making progress. The Indian Ministry of Health, for example, recently committed US$1.5 billion to provide clean cooking gas to 50 million poor households.75
In regions where gaseous fuels or electricity remain unavailable or unaffordable, we recommend reducing HAP aggressively through a package of household interventions, combining more-efficient stoves, improved fuels, ventilation, and education.74, 76 First, a high-efficiency/low-emission biomass stove may help reduce HAP exposures, although as of yet there is little evidence to suggest that the reduction in exposure levels from an efficient solid fuel stove alone is sufficient to provide a cardiovascular benefit. (Both the International Organization for Standardization and the US EPA offer frameworks for identifying safe, versatile, cost-effective, low-emission stoves.77, 78) Provision of clean-burning stove-fuel combinations, for example, can cost as little as $50-$100 per disability-adjusted life year averted if markets are in place.79 Global initiatives are underway to disseminate cleaner-burning stoves through targeted subsidies, microcredit programs, and market-based approaches.74, 75 Second, burning fuels farther up the energy ladder (e.g. processed biomass) may reduce exposures compared with burning unrefined solid fuels (e.g. wood, dung, or other unprocessed biomass).32, 33, 74 Most clean-burning fuels must be commercially produced at the village level or higher, requiring upfront public and private sector investments.74
Health benefits may be limited if new stoves and fuels have limited adoption and are used in combination with traditional stoves rather than substituting in the clean stove-fuel combination for all household energy needs.37, 74, 80, 81 Consequently, stove acceptance and performance should be evaluated in communities well in advance of larger-scale implementation to ensure compatibility with local energy use needs and behaviors, obtainable fuel types, and available maintenance and repair facilities.76, 80, 81
Other appliances and behavior changes, when packaged with cleaner fuel-stove combinations, may reduce HAP exposures to levels at which health benefits are more likely to accrue.76 For example, indoor air filtration using high efficiency particulate arrestance (HEPA) filters has been shown to reduce in-home PM2.5 by roughly half among healthy subjects of advanced age in Canada and Europe living in communities impacted by woodsmoke from fireplaces.70, 71, 82 Similarly, a recent randomized, double-blind, crossover trial in China demonstrated that the use of HEPA air purifiers compared with sham purifiers resulted in significantly lower stress hormone levels.23 Household ventilation can be improved via chimneys, flues, hoods, fans, open eaves, windows, doors, and cross-ventilation. In a randomized trial in Guatemala, a biomass chimney stove decreased women’s daily average PM2.5 exposures by 61%, which was associated with a 3.0 mmHg lower diastolic blood pressure.65, 67 Small reductions in PM exposures can be achieved by increasing the distance between the stove and household occupants, cooking outside or away from living areas, and ventilating during and after cooking,33, 72 though the potential benefit to cardiovascular health is likely far less than a low-polluting intervention stove. Similar reductions in exposure may be possible by reducing fuel consumption. For example, improvements in household insulation and window seals can reduce the need for space heating, and lids for cooking pots can reduce the cooking fuel requirement.73
Interventions for outdoor air pollution
Clinicians can offer several strategies for at-risk patients to reduce their exposures to OAP. First, they can encourage patients to reduce their exposures to traffic while commuting.40 Patients can be educated to avoid major roadways during rush hour traffic, keep car windows closed, maintain car air filtration systems, and keep the air on internal circulation.3, 8
At home, patients living in communities with elevated ambient pollution levels can be instructed to keep windows closed and use air filtration devices and central air conditioners when possible.8, 69 Central air has been shown to reduce the risk for cardiovascular hospitalizations associated with episodes of higher outdoor pollution among individuals with advanced age in the United States.83 Additionally, indoor air filtration reduces physiologic markers of cardiovascular risk from fireplace woodsmoke,70, 71 and may also provide benefit to households in regions with elevated OAP.
Studies have demonstrated that awareness of air quality indices and media alerts along with health professional advice can significantly change pollution-avoiding behaviors.84 Clinicians can connect patients to automated air pollution alert networks that provide warnings via text, phone, or email (such as the EPA’s AirNow network, airnow.org48). Similarly, mobile phone applications, news feeds, and other websites can help individuals plan their activities to minimize pollution exposures (e.g., breathlondon.org85). Patients should be educated to use this information to modulate their behaviors. On heavily polluted days, for example, patients could close home windows and limit prolonged or heavy exertion outdoors.3, 8, 48 Strenuous activities and exercise can be planned when particle levels are lower, conducted indoors, or in parks and gardens rather than next to major thoroughfares.3, 8 Individuals should not be discouraged from walking or cycling, as the cardiovascular benefit of these activities typically outweighs the risk associated with higher inhalation doses of pollutants.86 Individuals also can be encouraged to reduce travel to heavily polluted regions.3
Patients can be encouraged to wear personal filters to reduce exposures while outdoors. For example, N95 respirators block greater than 95% of PM2.5 inhalation and have been demonstrated to lower blood pressure and prevent ST-depression9, 16, 82. Simple facemasks were shown to reduce blood pressure in a small study in Beijing, and are becoming an increasingly common defensive strategy in Asia’s most polluted cities.87, 88
Preliminary evidence suggests that dietary supplements, including olive oil, antioxidant vitamins, and omega-3 polyunsaturated fatty acids may help protect against autonomic dysfunction, endothelial dysfunction, and oxidative stress reactions triggered by pollution exposures.89, 90 Patients at elevated risk of OAP exposure may benefit from the addition of these dietary supplements, although formal recommendations require rigorous evidence from randomized trials.
Health care professionals and provider organizations can also partner with government and advocacy organizations to enact and enforce emissions regulations. Effective measures include the establishment and enforcement of air quality standards, reduction in power plant emissions, transition to clean fuels and renewable energy sources, zoning laws, fuel efficiency standards for automobiles, and improved access to public transportation.6, 13 In the United States, for example, the Clear Air Act is estimated to have prevented 130,000 myocardial infarctions in 2010, the majority of which are attributed to PM pollution.91 Advocacy efforts may benefit from referencing global targets, such as the WHO’s recommendation to maintain PM2.5 exposures below a 10 μg/m3 yearly mean and a 25 μg/m3 24-hour mean.14
Finally, providers, payers, and policymakers can use spatial modeling to identify pollution hotspots and allocate resources accordingly. These geographic hotspots should be the target of health campaigns promoting the adoption of clean energy production,92 education on the health risks of pollution, regulation of vehicle and industrial emissions, and reductions in wildfires, agricultural burning, and dust from deforestation.37
Tailoring interventions to patients and communities
Patients differ in their exposures to pollution and other cardiovascular risk factors, as well as in health literacy, financial resources, and social support networks. Furthermore, regions differ in their governments, sociocultural structures, and available health and economic resources. Clinicians must therefore identify a subset of interventions tailored to the patient and community they serve. In particular, clinicians should choose interventions targeting exposures identified in the initial patient pollution exposure assessment, as well as the treatment of traditional cardiovascular risk factors.3 Additionally, we recommend that health care professionals and provider organizations situated in a community should research and develop community-tailored and culturally acceptable intervention packages for their service populations.
Some patients and communities may become preoccupied about the effects of air pollution on themselves or their family members, arranging their lives around daily pollution levels, or employing novel interventions despite a lack of evidence. Such patients should be commended for their vigilance, but also counseled that concern about pollution exposures should not prohibit them from pursuing other healthy behaviors.
Future Directions
Extensive research is still needed to better quantify exposures and validate interventions, particularly for HAP. When possible, we recommend that OAP and HAP be studied together as a composite risk factor reflecting many patients’ realities of dual exposure (Table 1).79
Table 1.
Areas for Further Research.
| Develop and validate screening tools |
| • Screening questions for pollution exposures (e.g., three-item questionnaire included in this paper) |
| • Risk calculator for individual pollution-attributable CV risk (akin to ASCVD 10-year risk calculator) |
| • Pollution exposure risk maps searchable by patient address |
| • Blood, urinary, and exhaled biomarkers of exposure (e.g., hydroxylated polycyclic aromatic hydrocarbons) |
| Characterize exposure-response relationships for populations and individuals |
| • Effect of household air pollution on CV outcomes |
| • Effect of PM2.5 from different fuel sources on CV outcomes |
| • Effects of non-particulate matter air pollutants (e.g., CO, NO2, SO2, ozone, and “clean” stove byproducts) |
| • Effects of occupational air pollution exposures on CV outcomes |
| • Effects of OAP and HAP studied as a composite risk factor |
| • Effects of pollution on CV outcomes other than IHD and stroke (e.g., CHF and all-cause CV mortality) |
| • Subgroup analyses by geography, socioeconomic status, and traditional CV risk factors |
| Identify effective interventions |
| • Clean stove and fuel combinations for household cooking and heating |
| • Pollution monitors and warning systems households, vehicles, and personal electronic devices |
| • Indoor air filtration systems and improved household and vehicle ventilation |
| • Facemasks worn while cooking or outside on polluted days |
| • Medicines to reduce cardiovascular impact of air pollution (e.g., statins, antioxidants, etc.) |
Areas recommended for further research to guide clinical approaches to air pollution, based on a review of the current literature. ASCVD, atherosclerotic cardiovascular disease; CV, cardiovascular.
Develop and validate clinical screening tools and exposure assessments
A simple screening tool could assist clinicians in identifying participants who are at increased risk of cardiovascular events or long-term CVD attributable to air pollution. We have proposed a basic air pollution screening tool to identify established predictors of pollution exposure (Figure 5). This tool should be field-tested along with other screening questions to determine which questions best predict hazardous exposures. In particular, future research or consensus recommendations are needed to define specifically which aspects of traffic, urban environments, and industrial emissions best predict harmful PM2.5 exposures.
Additionally, health care providers can create pollution risk maps for the communities they serve (e.g., Figure 6). Providers may benefit from the use of citizen science initiatives and crowdsourcing applications that allow patients to log exposures in the community, such as the EPA’s SmokeSense mobile application for wildfires.93 Real-time maps can provide patients and clinicians with a sense of short-term cardiovascular risk based on current pollution levels. Likewise, average exposure maps can estimate an individual’s chronic pollution exposures based on home or work address.
A simple calculator should be developed to help clinicians quantify exposures and risk. Similar to the ASCVD 10-year risk function,63 this calculator would estimate a patient’s PM2.5 exposure based on known predictors, such as traffic exposure or use of household solid fuel stoves. Based on these exposures and the patient’s overall cardiovascular risk profile, the tool could provide a patient’s relative risk of cardiovascular outcomes. A more advanced calculator could incorporate known synergistic risk factors (e.g., presence of coronary artery disease) to estimate a patient’s absolute risk of air pollution-attributable cardiovascular outcomes.
Finally, there is increasing evidence that certain exhaled or urinary/blood biomarkers may reflect an individual’s air pollution exposure.29 A clinical instrument could be developed to estimate individual exposures and cardiovascular risk during routine health care visits based on, for example, a person’s concentration of exhaled or urinary hydroxylated polycyclic aromatic hydrocarbons or metabolic profile.94
Characterize exposure-response relationships
The cardiovascular effects of HAP are largely inferred from an exposure-response relationship generated from data on the cardiovascular impacts of OAP, environmental tobacco smoke, and tobacco smoking.5, 29 Recent cross-sectional and cohort studies indicate that HAP increases systolic and diastolic blood pressure, myocardial ischemia, stroke, pulmonary hypertension, heart failure, and diabetes.3, 30, 36, 65, 67, 79, 95, 96 However, additional prospective cohort studies adjusted for CVD risk factors are needed to understand the exact relationship between measured HAP exposures and rates of stroke, IHD, and heart failure. Emissions from gaseous fuels, including ultrafine PM, black carbon, and polycyclic aromatic compounds, also should be investigated for their cardiovascular effects.29 Likewise, additional research is needed to determine what amount of reduction in HAP exposure is required to achieve cardiovascular benefit. Indeed, further research is needed to answer the question, “how clean is clean enough” to achieve both short- and long-term cardiovascular benefits at an individual and population level.29
Studies are also needed to determine whether cardiovascular outcomes vary based on the source and composition of PM, as well as by the unique characteristics of each individual.29, 59 PM2.5 emissions from traffic in urban China, for example, may have different health effects compared with PM2.5 emissions from biomass cookstoves in rural Kenya. Similarly, investigation is needed to clarify the cardiovascular effects of non-particulate matter components of air pollution (e.g., ozone, CO, NO2, SO2, benzene and other volatile organic compounds), which are also associated with increased risk of IHD.8 So far there is scant evidence to treat different combustion particles differently,5 but this remains to be confirmed. Finally, studies are needed to examine inter-individual differences based on demographic and physiological factors such as minute ventilation, genetic predisposition, and metabolism and excretion of harmful pollutants.
In addition to HAP and OAP, occupational air pollution exposures likely contribute to cardiac outcomes, particularly IHD among individuals working in manufacturing, mining, construction, farming, and the military.18 However, studies of workplace exposures and cardiac outcomes remain rare and difficult to control for other cardiac risks that may track with certain professions.17, 18 Further research is greatly needed to characterize the relationships between specific occupations, work microenvironments, air pollution exposures, cardiac outcomes, and targeted interventions.
Identify effective interventions
Further research is critical to identify interventions that reduce pollution exposures and the risk of cardiovascular outcomes16. Key interventions to be tested include: (1) clean stove-fuel combinations; (2) pollution monitors and warning systems for homes, vehicles, workplaces, and even wearable devices for individuals; (3) improved ventilation and indoor air filtration systems; (4) facemasks worn while outside on polluted days; and (5) medicines to potentially reduce the cardiovascular impacts of air pollution (eg. statins, antioxidants, omega-3 fatty acids). Packages that combine several of these interventions may have a stronger effect,74, 76 especially since patients must achieve low exposure levels to accrue substantial health benefits for certain outcomes. Stoves and other technologies should be comprehensively field tested prior to being studied, as there may be unanticipated issues with repairs, fuel supply chains, and local energy use behaviors.76 With each intervention, patients also should be provided with education on the cardiovascular risks of air pollution.
There have so far been no randomized controlled trials investigating the efficacy of pollution-directed interventions on cardiovascular outcomes such as stroke, IHD, heart failure, arrhythmia, and all-cause cardiovascular mortality. However, a small number of randomized controlled trials have evaluated the efficacy of individual and household-level interventions such as cookstoves, air filters, and facemasks in improving sub-clinical cardiovascular markers such as blood pressure, heart rate variability, endothelial function, and blood inflammatory markers.66, 68-70, 87 Randomized controlled trials are the gold standard for evidence-based medicine, and may be a particularly useful tool for the evaluation of these types of individual and household-level interventions. However, trials can also be too lengthy, expensive, and logistically difficult to answer some questions about pollution exposure.97 Quasi-randomized trails and natural experiments, along with well-designed prospective observational studies and case-crossover studies using high-quality quantitative exposure measurements can also provide actionable information for certain health endpoints, and also facilitate evaluation of regional air pollution policies.97 In some settings, exposures should be quantified with personal monitoring devices to reduce error that arises from exposure modeling.76 Data should be stratified to show effects based on socioeconomic status and age.74, 79 Traditional cardiac risk factors should be tested for effect modification (e.g., obesity, diabetes, coronary artery disease). And studies should collect data on cost-effectiveness and financing options to guide policy decisions.79 Researchers may find answers in exposure and outcome data collected from new National Institutes of Health - sponsored “GeoHealth hubs” across multiple LMICs.98 Additionally, sources of funding are growing for new clean fuel-stove trials, such as the current National Institutes of Health-funded four-country randomized trial comparing liquefied petroleum gas to traditional solid fuels.99
Conclusions
Air pollution is a well-established risk factor for cardiovascular diseases, responsible for a global burden of IHD and stroke that is greater than several traditional cardiac risk factors. Reductions in both household and outdoor air pollution exposures would significantly increase life expectancy in the US and abroad. Clinicians can play a significant role in mitigating pollution-attributable cardiovascular risk among the patients they serve. We have outlined a clinical approach for improving cardiovascular health. Clinicians, in partnership with government agencies, can use this approach to reduce pollution exposures in their service populations. We encourage clinicians and other health professionals to tailor this model to their specific populations, and to collect prospective data to validate the efficacy of screening tools and interventions.
Box 1. Case study example that applies several of the presented approaches.
Mrs. Mutai is a 72-year-old woman with history of hypertension and diabetes who visits Dr. Chebet for a regular health check-up at her clinic in Nairobi. Dr. Chebet’s clinic is testing a new approach for screening and protecting patients from the harmful cardiovascular effects of air pollution. Dr. Chebet identifies Mrs. Mutai as a patient at elevated risk of pollution-related cardiovascular events given her age and multiple cardiac risk factors. She performs a brief risk assessment and learns that Mrs. Mutai cooks her meals with an indoor wood-burning stove, commutes across town on a public bus, and works in her outdoor garden on weekends. Dr. Chebet locates Mrs. Mutai’s home on a publicly available pollution map and learns that average daily outdoor pollutant concentrations in her neighborhood are 61μg/m3. Dr. Chebet calculates that these various exposures impart an elevated risk of ischemic heart disease and stroke. She educates Mrs. Mutai on the cardiovascular risks associated with air pollution and discusses strategies to reduce her exposures. Together, they decide Mrs. Mutai will take the bus in the middle of the day to avoid rush hour traffic exposures, and avoid exertion in her garden on heavily polluted days. Dr. Chebet connects Mrs. Mutai to an automated phone message system that will warn her when outdoor pollution is at dangerous levels. On these days, she is instructed to wear an N95 respirator mask provided by her insurance company. Finally, Dr. Chebet connects Mrs. Mutai to a community organization providing clean-burning gas stoves, upkeep, and education. When using her old stove, Mrs. Mutai is encouraged to cook outdoors in a well-ventilated area. Over the next year, these interventions reduce Mrs. Mutai’s exposures and associated cardiovascular risk.
Acknowledgments
Funding Sources: Dr. Baumgartner is supported by a Canadian Institutes of Health Research New Investigator Award (#141959). Dr. Vedanthan is supported by the Fogarty International Center of the National Institutes of Health (K01TW009218). The content is solely the responsibility of the authors and does not necessarily represent the official views of the National Institutes of Health. All other authors have reported that they have no relationships relevant to the contents of this paper to disclose.
Footnotes
Conflict of Interest Disclosures: None
References
- 1.Institute for Health Metrics and Evaluation. [2017];Global Health Data Exchange. 2016 Available at: http://ghdx.healthdata.org/gbd-results-tool.
- 2.Collaborators GBDRF. Global, regional, and national comparative risk assessment of 84 behavioural, environmental and occupational, and metabolic risks or clusters of risks, 1990-2016: a systematic analysis for the Global Burden of Disease Study 2016. Lancet. 2017;390:1345–1422. doi: 10.1016/S0140-6736(17)32366-8. [DOI] [PMC free article] [PubMed] [Google Scholar]
- 3.Brook RD, Rajagopalan S, Pope CA, 3rd, Brook JR, Bhatnagar A, Diez-Roux AV, Holguin F, Hong Y, Luepker RV, Mittleman MA, Peters A, Siscovick D, Smith SC, Jr, Whitsel L, Kaufman JD. American Heart Association Council on E, Prevention CotKiCD, Council on Nutrition PA and Metabolism. Particulate matter air pollution and cardiovascular disease: An update to the scientific statement from the American Heart Association. Circulation. 2010;121:2331–2378. doi: 10.1161/CIR.0b013e3181dbece1. [DOI] [PubMed] [Google Scholar]
- 4.Martin WJ., 2nd On the Global Epidemic of CVD and Why Household Air Pollution Matters. Glob Heart. 2012;7:201–206. doi: 10.1016/j.gheart.2012.06.012. [DOI] [PubMed] [Google Scholar]
- 5.Smith KR, Bruce N, Balakrishnan K, Adair-Rohani H, Balmes J, Chafe Z, Dherani M, Hosgood HD, Mehta S, Pope D, Rehfuess E Group HCRE. Millions dead: how do we know and what does it mean? Methods used in the comparative risk assessment of household air pollution. Annu Rev Public Health. 2014;35:185–206. doi: 10.1146/annurev-publhealth-032013-182356. [DOI] [PubMed] [Google Scholar]
- 6.Cohen AJ, Brauer M, Burnett R, Anderson HR, Frostad J, Estep K, Balakrishnan K, Brunekreef B, Dandona L, Dandona R, Feigin V, Freedman G, Hubbell B, Jobling A, Kan H, Knibbs L, Liu Y, Martin R, Morawska L, Pope CA, 3rd, Shin H, Straif K, Shaddick G, Thomas M, van Dingenen R, van Donkelaar A, Vos T, Murray CJL, Forouzanfar MH. Estimates and 25-year trends of the global burden of disease attributable to ambient air pollution: an analysis of data from the Global Burden of Diseases Study 2015. Lancet. 2017;389:1907–1918. doi: 10.1016/S0140-6736(17)30505-6. [DOI] [PMC free article] [PubMed] [Google Scholar]
- 7.Sacco RL, Roth GA, Reddy KS, Arnett DK, Bonita R, Gaziano TA, Heidenreich PA, Huffman MD, Mayosi BM, Mendis S, Murray CJ, Perel P, Pineiro DJ, Smith SC, Jr, Taubert KA, Wood DA, Zhao D, Zoghbi WA. The Heart of 25 by 25: Achieving the Goal of Reducing Global and Regional Premature Deaths From Cardiovascular Diseases and Stroke: A Modeling Study From the American Heart Association and World Heart Federation. Circulation. 2016;133:e674–690. doi: 10.1161/CIR.0000000000000395. [DOI] [PubMed] [Google Scholar]
- 8.Newby DE, Mannucci PM, Tell GS, Baccarelli AA, Brook RD, Donaldson K, Forastiere F, Franchini M, Franco OH, Graham I, Hoek G, Hoffmann B, Hoylaerts MF, Kunzli N, Mills N, Pekkanen J, Peters A, Piepoli MF, Rajagopalan S, Storey RF Esc Working Group on Thrombosis EAfCP, Rehabilitation and Association ESCHF. Expert position paper on air pollution and cardiovascular disease. Eur Heart J. 2015;36:83–93b. doi: 10.1093/eurheartj/ehu458. [DOI] [PMC free article] [PubMed] [Google Scholar]
- 9.Munzel T, Sorensen M, Gori T, Schmidt FP, Rao X, Brook J, Chen LC, Brook RD, Rajagopalan S. Environmental stressors and cardio-metabolic disease: part I-epidemiologic evidence supporting a role for noise and air pollution and effects of mitigation strategies. Eur Heart J. 2017;38:550–556. doi: 10.1093/eurheartj/ehw269. [DOI] [PubMed] [Google Scholar]
- 10.Munzel T, Sorensen M, Gori T, Schmidt FP, Rao X, Brook FR, Chen LC, Brook RD, Rajagopalan S. Environmental stressors and cardio-metabolic disease: part II-mechanistic insights. Eur Heart J. 2017;38:557–564. doi: 10.1093/eurheartj/ehw294. [DOI] [PMC free article] [PubMed] [Google Scholar]
- 11.Burnett RT, Pope CA, 3rd, Ezzati M, Olives C, Lim SS, Mehta S, Shin HH, Singh G, Hubbell B, Brauer M, Anderson HR, Smith KR, Balmes JR, Bruce NG, Kan H, Laden F, Pruss-Ustun A, Turner MC, Gapstur SM, Diver WR, Cohen A. An integrated risk function for estimating the global burden of disease attributable to ambient fine particulate matter exposure. Environ Health Perspect. 2014;122:397–403. doi: 10.1289/ehp.1307049. [DOI] [PMC free article] [PubMed] [Google Scholar]
- 12.Steinle S, Reis S, Sabel CE. Quantifying human exposure to air pollution--moving from static monitoring to spatio-temporally resolved personal exposure assessment. Sci Total Environ. 2013;443:184–193. doi: 10.1016/j.scitotenv.2012.10.098. [DOI] [PubMed] [Google Scholar]
- 13.Landrigan PJ. Air pollution and health. The Lancet Public Health. 2017;2:e4–e5. doi: 10.1016/S2468-2667(16)30023-8. [DOI] [PubMed] [Google Scholar]
- 14.World Health Organization. Ambient air pollution: A global assessment of exposure and burden of disease. [2017];2016 Available at: http://www.who.int/phe/publications/air-pollution-global-assessment/en/
- 15.Lelieveld J, Evans JS, Fnais M, Giannadaki D, Pozzer A. The contribution of outdoor air pollution sources to premature mortality on a global scale. Nature. 2015;525:367–371. doi: 10.1038/nature15371. [DOI] [PubMed] [Google Scholar]
- 16.Brook RD, Newby DE, Rajagopalan S. The Global Threat of Outdoor Ambient Air Pollution to Cardiovascular Health: Time for Intervention. JAMA Cardiol. 2017;2:353–354. doi: 10.1001/jamacardio.2017.0032. [DOI] [PubMed] [Google Scholar]
- 17.Cullen MR. Invited commentary: the search for preventable causes of cardiovascular disease--whither work? Am J Epidemiol. 2009;169:1422–1425. doi: 10.1093/aje/kwp078. [DOI] [PMC free article] [PubMed] [Google Scholar]
- 18.Fang SC, Cassidy A, Christiani DC. A systematic review of occupational exposure to particulate matter and cardiovascular disease. Int J Environ Res Public Health. 2010;7:1773–1806. doi: 10.3390/ijerph7041773. [DOI] [PMC free article] [PubMed] [Google Scholar]
- 19.Ning Z, Geller MD, Moore KF, Sheesley R, Schauer JJ, Sioutas C. Daily variation in chemical characteristics of urban ultrafine aerosols and inference of their sources. Environ Sci Technol. 2007;41:6000–6006. doi: 10.1021/es070653g. [DOI] [PubMed] [Google Scholar]
- 20.Secrest MH, Schauer JJ, Carter EM, Baumgartner J. Particulate matter chemical component concentrations and sources in settings of household solid fuel use. Indoor Air. 2017;27:1052–1066. doi: 10.1111/ina.12389. [DOI] [PubMed] [Google Scholar]
- 21.Ruckerl R, Schneider A, Breitner S, Cyrys J, Peters A. Health effects of particulate air pollution: A review of epidemiological evidence. Inhal Toxicol. 2011;23:555–592. doi: 10.3109/08958378.2011.593587. [DOI] [PubMed] [Google Scholar]
- 22.Mustafic H, Jabre P, Caussin C, Murad MH, Escolano S, Tafflet M, Perier MC, Marijon E, Vernerey D, Empana JP, Jouven X. Main air pollutants and myocardial infarction: a systematic review and meta-analysis. JAMA. 2012;307:713–721. doi: 10.1001/jama.2012.126. [DOI] [PubMed] [Google Scholar]
- 23.Li H, Cai J, Chen R, Zhao Z, Ying Z, Wang L, Chen J, Hao K, Kinney PL, Chen H, Kan H. Particulate Matter Exposure and Stress Hormone Levels: A Randomized, Double-Blind, Crossover Trial of Air Purification. Circulation. 2017;136:618–627. doi: 10.1161/CIRCULATIONAHA.116.026796. [DOI] [PubMed] [Google Scholar]
- 24.Pope CA, 3rd, Burnett RT, Thurston GD, Thun MJ, Calle EE, Krewski D, Godleski JJ. Cardiovascular mortality and long-term exposure to particulate air pollution: epidemiological evidence of general pathophysiological pathways of disease. Circulation. 2004;109:71–77. doi: 10.1161/01.CIR.0000108927.80044.7F. [DOI] [PubMed] [Google Scholar]
- 25.Pope CA, 3rd, Muhlestein JB, May HT, Renlund DG, Anderson JL, Horne BD. Ischemic heart disease events triggered by short-term exposure to fine particulate air pollution. Circulation. 2006;114:2443–2448. doi: 10.1161/CIRCULATIONAHA.106.636977. [DOI] [PubMed] [Google Scholar]
- 26.Laden F, Schwartz J, Speizer FE, Dockery DW. Reduction in fine particulate air pollution and mortality: Extended follow-up of the Harvard Six Cities study. Am J Respir Crit Care Med. 2006;173:667–672. doi: 10.1164/rccm.200503-443OC. [DOI] [PMC free article] [PubMed] [Google Scholar]
- 27.Institute for Health Metrics and Evaluation. Global Burden of Disease Study 2010 (GBD 2010) – Ambient Air Pollution Risk Model 1990 – 2010. [2017];2016 Available at: http://ghdx.healthdata.org/record/global-burden-disease-study-2010-gbd-2010-ambient-air-pollution-risk-model-1990-2010.
- 28.Shin HH, Cohen AJ, Pope CA, Ezzati M, Lim SS, Hubbell BJ, Burnett RT. Meta-Analysis Methods to Estimate the Shape and Uncertainty in the Association Between Long-Term Exposure to Ambient Fine Particulate Matter and Cause-Specific Mortality Over the Global Concentration Range. Risk Analysis. 2016;36:1813–1825. doi: 10.1111/risa.12421. [DOI] [PubMed] [Google Scholar]
- 29.Clark ML, Peel JL, Balakrishnan K, Breysse PN, Chillrud SN, Naeher LP, Rodes CE, Vette AF, Balbus JM. Health and household air pollution from solid fuel use: the need for improved exposure assessment. Environ Health Perspect. 2013;121:1120–1128. doi: 10.1289/ehp.1206429. [DOI] [PMC free article] [PubMed] [Google Scholar]
- 30.Smith KR, Peel JL. Mind the gap. Environ Health Perspect. 2010;118:1643–1645. doi: 10.1289/ehp.1002517. [DOI] [PMC free article] [PubMed] [Google Scholar]
- 31.World Health Organization. Global Health Observatory (GHO) data. [2017];2017 Available at: http://www.who.int/gho/phe/outdoor_air_pollution/exposure/en/
- 32.Balakrishnan K, Ghosh S, Ganguli B, Sambandam S, Bruce N, Barnes DF, Smith KR. State and national household concentrations of PM2.5 from solid cookfuel use: results from measurements and modeling in India for estimation of the global burden of disease. Environ Health. 2013;12:77. doi: 10.1186/1476-069X-12-77. [DOI] [PMC free article] [PubMed] [Google Scholar]
- 33.Ezzati M, Saleh H, Kammen DM. The contributions of emissions and spatial microenvironments to exposure to indoor air pollution from biomass combustion in Kenya. Environ Health Perspect. 2000;108:833–839. doi: 10.1289/ehp.00108833. [DOI] [PMC free article] [PubMed] [Google Scholar]
- 34.Balakrishnan K, Sambandam S, Ramaswamy P, Mehta S, Smith KR. Exposure assessment for respirable particulates associated with household fuel use in rural districts of Andhra Pradesh, India. J Expo Anal Environ Epidemiol. 2004;14(Suppl 1):S14–25. doi: 10.1038/sj.jea.7500354. [DOI] [PubMed] [Google Scholar]
- 35.Baumgartner J, Schauer JJ, Ezzati M, Lu L, Cheng C, Patz J, Bautista LE. Patterns and predictors of personal exposure to indoor air pollution from biomass combustion among women and children in rural China. Indoor Air. 2011;21:479–488. doi: 10.1111/j.1600-0668.2011.00730.x. [DOI] [PubMed] [Google Scholar]
- 36.Mitter SS, Vedanthan R, Islami F, Pourshams A, Khademi H, Kamangar F, Abnet CC, Dawsey SM, Pharoah PD, Brennan P, Fuster V, Boffetta P, Malekzadeh R. Household Fuel Use and Cardiovascular Disease Mortality: Golestan Cohort Study. Circulation. 2016;133:2360–2369. doi: 10.1161/CIRCULATIONAHA.115.020288. [DOI] [PMC free article] [PubMed] [Google Scholar]
- 37.Johnson MA, Chiang RA. Quantitative Guidance for Stove Usage and Performance to Achieve Health and Environmental Targets. Environ Health Perspect. 2015;123:820–826. doi: 10.1289/ehp.1408681. [DOI] [PMC free article] [PubMed] [Google Scholar]
- 38.Hoek G, Beelen R, De Hoogh K, Vienneau D, Gulliver J, Fischer P, Briggs D. A review of land-use regression models to assess spatial variation of outdoor air pollution. Atmospheric environment. 2008;42:7561–7578. [Google Scholar]
- 39.Ryan PH, LeMasters GK. A review of land-use regression models for characterizing intraurban air pollution exposure. Inhal Toxicol. 2007;19(Suppl 1):127–133. doi: 10.1080/08958370701495998. [DOI] [PMC free article] [PubMed] [Google Scholar]
- 40.Adar SD, Kaufman JD. Cardiovascular disease and air pollutants: evaluating and improving epidemiological data implicating traffic exposure. Inhal Toxicol. 2007;19(Suppl 1):135–149. doi: 10.1080/08958370701496012. [DOI] [PubMed] [Google Scholar]
- 41.Brauer M, Hoek G, van Vliet P, Meliefste K, Fischer P, Gehring U, Heinrich J, Cyrys J, Bellander T, Lewne M, Brunekreef B. Estimating long-term average particulate air pollution concentrations: application of traffic indicators and geographic information systems. Epidemiology. 2003;14:228–239. doi: 10.1097/01.EDE.0000041910.49046.9B. [DOI] [PubMed] [Google Scholar]
- 42.Chen C, Zhao B. Review of relationship between indoor and outdoor particles: I/O ratio, infiltration factor and penetration factor. Atmospheric Environment. 2011;45:275–288. [Google Scholar]
- 43.Xu M, Guo Y, Zhang Y, Westerdahl D, Mo Y, Liang F, Pan X. Spatiotemporal analysis of particulate air pollution and ischemic heart disease mortality in Beijing, China. Environ Health. 2014;13:109. doi: 10.1186/1476-069X-13-109. [DOI] [PMC free article] [PubMed] [Google Scholar]
- 44.Kunzli N, Jerrett M, Mack WJ, Beckerman B, LaBree L, Gilliland F, Thomas D, Peters J, Hodis HN. Ambient air pollution and atherosclerosis in Los Angeles. Environ Health Perspect. 2005;113:201–206. doi: 10.1289/ehp.7523. [DOI] [PMC free article] [PubMed] [Google Scholar]
- 45.Peters A, von Klot S, Heier M, Trentinaglia I, Hormann A, Wichmann HE, Lowel H Cooperative Health Research in the Region of Augsburg Study G. Exposure to traffic and the onset of myocardial infarction. N Engl J Med. 2004;351:1721–1730. doi: 10.1056/NEJMoa040203. [DOI] [PubMed] [Google Scholar]
- 46.World Health Organization. WHO Household energy database. [2017];2016 Available at: http://www.who.int/indoorair/health_impacts/he_database/en/
- 47.Balakrishnan K, Smith K. WHO global database of household air pollution measurements. [2017];2016 Available at: http://www.who.int/indoorair/health_impacts/databases_iap/en/
- 48.Environmental Protection Agency. [2017];AirNow. 2017 Available at: https://www.airnow.gov.
- 49.Environmental Protection Agency. [2017];Air Pollution in World: Real-time Air Quality Index Visual Map. 2017 Available at: http://aqicn.org/map/world/
- 50.Environmental Protection Agency. CMAQ: The Community Multiscale Air Quality Modeling System. [2017]; Available at: https://www.epa.gov/cmaq.
- 51.Bhatnagar A. Environmental cardiology: studying mechanistic links between pollution and heart disease. Circ Res. 2006;99:692–705. doi: 10.1161/01.RES.0000243586.99701.cf. [DOI] [PubMed] [Google Scholar]
- 52.Eeftens M, Beelen R, de Hoogh K, Bellander T, Cesaroni G, Cirach M, Declercq C, Dedele A, Dons E, de Nazelle A, Dimakopoulou K, Eriksen K, Falq G, Fischer P, Galassi C, Grazuleviciene R, Heinrich J, Hoffmann B, Jerrett M, Keidel D, Korek M, Lanki T, Lindley S, Madsen C, Molter A, Nador G, Nieuwenhuijsen M, Nonnemacher M, Pedeli X, Raaschou-Nielsen O, Patelarou E, Quass U, Ranzi A, Schindler C, Stempfelet M, Stephanou E, Sugiri D, Tsai MY, Yli-Tuomi T, Varro MJ, Vienneau D, Klot S, Wolf K, Brunekreef B, Hoek G. Development of Land Use Regression models for PM(2.5), PM(2.5) absorbance, PM(10) and PM(coarse) in 20 European study areas; results of the ESCAPE project. Environ Sci Technol. 2012;46:11195–11205. doi: 10.1021/es301948k. [DOI] [PubMed] [Google Scholar]
- 53.Brauer M, Amann M, Burnett RT, Cohen A, Dentener F, Ezzati M, Henderson SB, Krzyzanowski M, Martin RV, Van Dingenen R, van Donkelaar A, Thurston GD. Exposure assessment for estimation of the global burden of disease attributable to outdoor air pollution. Environ Sci Technol. 2012;46:652–660. doi: 10.1021/es2025752. [DOI] [PMC free article] [PubMed] [Google Scholar]
- 54.Chudnovsky AA, Koutrakis P, Kloog I, Melly S, Nordio F, Lyapustin A, Wang Y, Schwartz J. Fine particulate matter predictions using high resolution Aerosol Optical Depth (AOD) retrievals. Atmospheric Environment. 2014;89:189–198. doi: 10.1016/j.atmosenv.2014.07.014. [DOI] [PMC free article] [PubMed] [Google Scholar]
- 55.Apte JS, Marshall JD, Cohen AJ, Brauer M. Addressing Global Mortality from Ambient PM2.5. Environ Sci Technol. 2015;49:8057–8066. doi: 10.1021/acs.est.5b01236. [DOI] [PubMed] [Google Scholar]
- 56.Di Q, Wang Y, Zanobetti A, Wang Y, Koutrakis P, Choirat C, Dominici F, Schwartz JD. Air Pollution and Mortality in the Medicare Population. N Engl J Med. 2017;376:2513–2522. doi: 10.1056/NEJMoa1702747. [DOI] [PMC free article] [PubMed] [Google Scholar]
- 57.Crouse DL, Peters PA, Hystad P, Brook JR, van Donkelaar A, Martin RV, Villeneuve PJ, Jerrett M, Goldberg MS, Pope CA, 3rd, Brauer M, Brook RD, Robichaud A, Menard R, Burnett RT. Ambient PM2.5, O(3), and NO(2) Exposures and Associations with Mortality over 16 Years of Follow-Up in the Canadian Census Health and Environment Cohort (CanCHEC) Environ Health Perspect. 2015;123:1180–1186. doi: 10.1289/ehp.1409276. [DOI] [PMC free article] [PubMed] [Google Scholar]
- 58.Atkinson RW, Kang S, Anderson HR, Mills IC, Walton HA. Epidemiological time series studies of PM2.5 and daily mortality and hospital admissions: a systematic review and meta-analysis. Thorax. 2014;69:660–665. doi: 10.1136/thoraxjnl-2013-204492. [DOI] [PMC free article] [PubMed] [Google Scholar]
- 59.Hoek G, Krishnan RM, Beelen R, Peters A, Ostro B, Brunekreef B, Kaufman JD. Long-term air pollution exposure and cardio- respiratory mortality: a review. Environ Health. 2013;12:43. doi: 10.1186/1476-069X-12-43. [DOI] [PMC free article] [PubMed] [Google Scholar]
- 60.Armstrong BG. Effect of measurement error on epidemiological studies of environmental and occupational exposures. Occup Environ Med. 1998;55:651–656. doi: 10.1136/oem.55.10.651. [DOI] [PMC free article] [PubMed] [Google Scholar]
- 61.Matte TD, Ross Z, Kheirbek I, Eisl H, Johnson S, Gorczynski JE, Kass D, Markowitz S, Pezeshki G, Clougherty JE. Monitoring intraurban spatial patterns of multiple combustion air pollutants in New York City: design and implementation. J Expo Sci Environ Epidemiol. 2013;23:223–231. doi: 10.1038/jes.2012.126. [DOI] [PubMed] [Google Scholar]
- 62.Kheirbek I, Johnson S, Ito K, Anan K, Huskey C, Matte T, Kass D, Eisl H, Gorczynski J, Markowitz S. The New York City Community Air Survey: Neighborhood Air Quality 2008-2014. [2017];2016 Available at: https://www1.nyc.gov/assets/doh/downloads/pdf/environmental/comm-air-survey-08-14.pdf.
- 63.American College of Cardiology & American Heart Association. [2017];ASCVD Risk Estimator. 2017 Available at: http://tools.acc.org/ASCVD-Risk-Estimator-Plus.
- 64.Jeuland M, Tan-Soo JS. Analyzing the costs and benefits of clean and improved cooking solutions. [2017];2016 Available at: https://cleancookstoves.org/binary-data/RESOURCE/file/000/000/459-1.pdf.
- 65.McCracken JP, Smith KR, Diaz A, Mittleman MA, Schwartz J. Chimney stove intervention to reduce long-term wood smoke exposure lowers blood pressure among Guatemalan women. Environ Health Perspect. 2007;115:996–1001. doi: 10.1289/ehp.9888. [DOI] [PMC free article] [PubMed] [Google Scholar]
- 66.Alexander D, Northcross A, Wilson N, Dutta A, Pandya R, Ibigbami T, Adu D, Olamijulo J, Morhason-Bello O, Karrison T, Ojengbede O, Olopade CO. Randomized Controlled Ethanol Cookstove Intervention and Blood Pressure in Pregnant Nigerian Women. Am J Respir Crit Care Med. 2017;195:1629–1639. doi: 10.1164/rccm.201606-1177OC. [DOI] [PubMed] [Google Scholar]
- 67.McCracken J, Smith KR, Stone P, Diaz A, Arana B, Schwartz J. Intervention to lower household wood smoke exposure in Guatemala reduces ST-segment depression on electrocardiograms. Environ Health Perspect. 2011;119:1562–1568. doi: 10.1289/ehp.1002834. [DOI] [PMC free article] [PubMed] [Google Scholar]
- 68.Olopade CO, Frank E, Bartlett E, Alexander D, Dutta A, Ibigbami T, Adu D, Olamijulo J, Arinola G, Karrison T, Ojengbede O. Effect of a clean stove intervention on inflammatory biomarkers in pregnant women in Ibadan, Nigeria: A randomized controlled study. Environ Int. 2017;98:181–190. doi: 10.1016/j.envint.2016.11.004. [DOI] [PubMed] [Google Scholar]
- 69.Chen R, Zhao A, Chen H, Zhao Z, Cai J, Wang C, Yang C, Li H, Xu X, Ha S, Li T, Kan H. Cardiopulmonary benefits of reducing indoor particles of outdoor origin: a randomized, double-blind crossover trial of air purifiers. J Am Coll Cardiol. 2015;65:2279–2287. doi: 10.1016/j.jacc.2015.03.553. [DOI] [PMC free article] [PubMed] [Google Scholar]
- 70.Allen RW, Carlsten C, Karlen B, Leckie S, van Eeden S, Vedal S, Wong I, Brauer M. An air filter intervention study of endothelial function among healthy adults in a woodsmoke-impacted community. Am J Respir Crit Care Med. 2011;183:1222–1230. doi: 10.1164/rccm.201010-1572OC. [DOI] [PubMed] [Google Scholar]
- 71.Brauner EV, Forchhammer L, Moller P, Barregard L, Gunnarsen L, Afshari A, Wahlin P, Glasius M, Dragsted LO, Basu S, Raaschou-Nielsen O, Loft S. Indoor particles affect vascular function in the aged: an air filtration-based intervention study. Am J Respir Crit Care Med. 2008;177:419–425. doi: 10.1164/rccm.200704-632OC. [DOI] [PubMed] [Google Scholar]
- 72.Dasgupta S, Huq M, Khaliquzzaman M, Pandey K, Wheeler D. Indoor air quality for poor families: new evidence from Bangladesh. Indoor Air. 2006;16:426–444. doi: 10.1111/j.1600-0668.2006.00436.x. [DOI] [PubMed] [Google Scholar]
- 73.Yang X, Jiang Y, Yang M, Shan M. Energy and environment in Chinese rural housing: Current status and future perspective. Frontiers of Energy and Power Engineering in China. 2010;4:35–46. [Google Scholar]
- 74.Baumgartner J, Smith KR, Chockalingam A. Reducing CVD Through Improvements in Household Energy: Implications for Policy-Relevant Research. Glob Heart. 2012;7:243–247. doi: 10.1016/j.gheart.2012.06.018. [DOI] [PubMed] [Google Scholar]
- 75.Sagar A, Balakrishnan K, Guttikunda S, Roychowdhury A, Smith KR. India Leads the Way: A Health-Centered Strategy for Air Pollution. Environ Health Perspect. 2016;124:A116–117. doi: 10.1289/EHP90. [DOI] [PMC free article] [PubMed] [Google Scholar]
- 76.Ezzati M, Baumgartner JC. Household energy and health: where next for research and practice? Lancet. 2016;389:130–132. doi: 10.1016/S0140-6736(16)32506-5. [DOI] [PubMed] [Google Scholar]
- 77.Jetter J, Zhao Y, Smith KR, Khan B, Yelverton T, Decarlo P, Hays MD. Pollutant emissions and energy efficiency under controlled conditions for household biomass cookstoves and implications for metrics useful in setting international test standards. Environ Sci Technol. 2012;46:10827–10834. doi: 10.1021/es301693f. [DOI] [PubMed] [Google Scholar]
- 78.International Organization for Standardization. Guidelines for evaluating cookstove performance. [2017];2012 Available at: https://www.iso.org/obp/ui/#iso:std:iso:iwa:11:ed-1:v1:en.
- 79.Rajagopalan S, Brook RD. The Indoor-Outdoor Air-Pollution Continuum and the Burden of Cardiovascular Disease: An Opportunity for Improving Global Health. Glob Heart. 2012;7:207–213. doi: 10.1016/j.gheart.2012.06.009. [DOI] [PMC free article] [PubMed] [Google Scholar]
- 80.Ruiz-Mercado I, Masera O, Zamora H, Smith KR. Adoption and sustained use of improved cookstoves. Energy policy. 2011;39:7557–7566. [Google Scholar]
- 81.Rhodes EL, Dreibelbis R, Klasen EM, Naithani N, Baliddawa J, Menya D, Khatry S, Levy S, Tielsch JM, Miranda JJ, Kennedy C, Checkley W. Behavioral attitudes and preferences in cooking practices with traditional open-fire stoves in Peru, Nepal, and Kenya: implications for improved cookstove interventions. Int J Environ Res Public Health. 2014;11:10310–10326. doi: 10.3390/ijerph111010310. [DOI] [PMC free article] [PubMed] [Google Scholar]
- 82.Morishita M, Thompson KC, Brook RD. Understanding Air Pollution and Cardiovascular Diseases: Is It Preventable? Curr Cardiovasc Risk Rep. 2015;9:30. doi: 10.1007/s12170-015-0458-1. [DOI] [PMC free article] [PubMed] [Google Scholar]
- 83.Bell ML, Ebisu K, Peng RD, Dominici F. Adverse health effects of particulate air pollution: modification by air conditioning. Epidemiology. 2009;20:682–686. doi: 10.1097/EDE.0b013e3181aba749. [DOI] [PMC free article] [PubMed] [Google Scholar]
- 84.Wen XJ, Balluz L, Mokdad A. Association between media alerts of air quality index and change of outdoor activity among adult asthma in six states, BRFSS, 2005. J Community Health. 2009;34:40–46. doi: 10.1007/s10900-008-9126-4. [DOI] [PubMed] [Google Scholar]
- 85.National Institute for Health Research (NHS) Breathe London: Improving your community’s health through breathing cleaner air. [2017];2015 Available at: http://breathelondon.org/
- 86.Cepeda M, Schoufour J, Freak-Poli R, Koolhaas CM, Dhana K, Bramer WM, Franco OH. Levels of ambient air pollution according to mode of transport: a systematic review. The Lancet Public Health. 2017;2:e23–e34. doi: 10.1016/S2468-2667(16)30021-4. [DOI] [PubMed] [Google Scholar]
- 87.Langrish JP, Mills NL, Chan JK, Leseman DL, Aitken RJ, Fokkens PH, Cassee FR, Li J, Donaldson K, Newby DE, Jiang L. Beneficial cardiovascular effects of reducing exposure to particulate air pollution with a simple facemask. Part Fibre Toxicol. 2009;6:8. doi: 10.1186/1743-8977-6-8. [DOI] [PMC free article] [PubMed] [Google Scholar]
- 88.Zhang J, Mu Q. Air pollution and defensive expenditures: Evidence from particulate-filtering facemasks. [2017];2016 Available at: https://escholarship.org/uc/item/1bz8c9ms.
- 89.Romieu I, Castro-Giner F, Kunzli N, Sunyer J. Air pollution, oxidative stress and dietary supplementation: a review. Eur Respir J. 2008;31:179–197. doi: 10.1183/09031936.00128106. [DOI] [PubMed] [Google Scholar]
- 90.Tong H, Rappold AG, Diaz-Sanchez D, Steck SE, Berntsen J, Cascio WE, Devlin RB, Samet JM. Omega-3 fatty acid supplementation appears to attenuate particulate air pollution-induced cardiac effects and lipid changes in healthy middle-aged adults. Environ Health Perspect. 2012;120:952–957. doi: 10.1289/ehp.1104472. [DOI] [PMC free article] [PubMed] [Google Scholar]
- 91.Environmental Protection Agency Office of Air and Radiation. The benefits and costs of the clean air act from 1990 to 2020, Final Report, Rev A. [2017];2011 Available at: https://www.epa.gov/sites/production/files/2015-07/documents/fullreport_rev_a.pdf.
- 92.Health Effects Institute. Proceedings of an HEI Workshop on Further Research to Assess the Health Impacts of Actions Taken to Improve Air Quality: Communication 15. Boston: Aug, 2010. [2017]. Available at: https://www.healtheffects.org/system/files/Communication15-Workshop-Proceedings.pdf. [Google Scholar]
- 93.Environmental Protection Agency. Smoke Sense Study: A Citizen Science Project Using a Mobile App. [2017]; Available at; https://www.epa.gov/air-research/smoke-sense-study-citizen-science-project-using-mobile-app.
- 94.Adetona O, Simpson CD, Li Z, Sjodin A, Calafat AM, Naeher LP. Hydroxylated polycyclic aromatic hydrocarbons as biomarkers of exposure to wood smoke in wildland firefighters. J Expo Sci Environ Epidemiol. 2015;27:78–83. doi: 10.1038/jes.2015.75. [DOI] [PMC free article] [PubMed] [Google Scholar]
- 95.Baumgartner J, Schauer JJ, Ezzati M, Lu L, Cheng C, Patz JA, Bautista LE. Indoor air pollution and blood pressure in adult women living in rural China. Environ Health Perspect. 2011;119:1390–1395. doi: 10.1289/ehp.1003371. [DOI] [PMC free article] [PubMed] [Google Scholar]
- 96.McCracken JP, Wellenius GA, Bloomfield GS, Brook RD, Tolunay HE, Dockery DW, Rabadan-Diehl C, Checkley W, Rajagopalan S. Household Air Pollution from Solid Fuel Use: Evidence for Links to CVD. Glob Heart. 2012;7:223–234. doi: 10.1016/j.gheart.2012.06.010. [DOI] [PubMed] [Google Scholar]
- 97.Peel JL, Baumgartner J, Wellenius GA, Clark ML, Smith KR. Are Randomized Trials Necessary to Advance Epidemiologic Research on Household Air Pollution? Current Epidemiology Reports. 2015;2:263–270. [Google Scholar]
- 98. [2017];US National Institutes of Health Fogarty International Center: Global Environmental and Occupational Health (GeoHealh): Program Overview. Available at: https://www.fic.nih.gov/programs/pages/environmental-occupational.aspx.
- 99.US National Institutes of Health. Household Air Pollution and Health: A Multi-country LPG Intervention Trial. [2017];2017 Available at: https://clinicaltrials.gov/ct2/show/NCT02944682.