

Abstract
The purpose of the study was to examine the effects of altering from habitual mixed Western-based (HD) to a very low-carbohydrate high-fat (VLCHF) diet over a 4-week timecourse on performance and physiological responses during high-intensity interval training (HIIT). Eighteen moderately trained males (age 23.8 ± 2.1 years) consuming their HD (48 ± 13% carbohydrate, 17 ± 3% protein, 35 ± 9% fat) were assigned to 2 groups. One group was asked to remain on their HD, while the other was asked to switch to a non-standardized VLCHF diet (8 ± 3% carbohydrate, 29 ± 15% protein, 63 ± 13% fat) for 4 weeks. Participants performed graded exercise tests (GXT) before and after the experiment, and an HIIT session (5x3min, work/rest 2:1, passive recovery, total time 34min) before, and after 2 and 4 weeks. Heart rate (HR), oxygen uptake (V̇O2), respiratory exchange ratio (RER), maximal fat oxidation rates (Fatmax) and blood lactate were measured. Total time to exhaustion (TTE) and maximal V̇O2 (V̇O2max) in the GXT increased in both groups, but between-group changes were trivial (ES ± 90% CI: -0.1 ± 0.3) and small (0.57 ± 0.5), respectively. Between-group difference in Fatmax change (VLCHF: 0.8 ± 0.3 to 1.1 ± 0.2 g/min; HD: 0.7 ± 0.2 to 0.8 ± 0.2 g/min) was large (1.2±0.9), revealing greater increases in the VLCHF versus HD group. Between-group comparisons of mean changes in V̇O2 and HR during the HIIT sessions were trivial to small, whereas mean RER decreased more in the VLCHF group (-1.5 ± 0.1). Lactate changes between groups were unclear. Adoption of a VLCHF diet over 4 weeks increased Fatmax and did not adversely affect TTE during the GXT or cardiorespiratory responses to HIIT compared with the HD.
Key points.
A group of participants that changed from habitual mixed western-based to VLCHF diet over 4 weeks substantially increased rates of fat oxidation shown during a graded exercise test and high-intensity interval training (HIIT) session.
Performance and cardiorespiratory responses during a graded exercise test and HIIT were not impaired after consuming a VLCHF diet relative to a group consuming their mixed western-based diet.
A four-week adaptation period to a VLCHF diet preserved high-intensity exercise performance.
Key words: High-intensity exercise, graded exercise test, ketosis, low-carbohydrate diet, high-fat diet
Introduction
Despite a hundred-plus year history, there has been renewed interest in research describing the effects of lowering dietary carbohydrate on health and exercise performance (Volek, Noakes and Phinney, 2015). Approaches have included training in the fasted state, training with reduced glycogen stores after prior exercise, and restricting carbohydrate (CHO) intake during recovery (Bartlett et al., 2015). A very low-CHO high-fat (VLCHF) diet, also known as the ketogenic diet, is a nutritional approach that restricts daily carbohydrates to 20-50 g/d, replacing the majority of those reduced calories with fat, while maintaining low to moderate quantities of protein (Feinman et al., 2015). In persons habituated to typical Western diets, the VLCHF diet has been shown to lower basal glucose and insulin levels, increase fat oxidation rates, and upregulate an alternative energy source in the form of hepatic ketone bodies (Paoli et al., 2015). These ketogenic diet-induced metabolic changes drive the body to preferentially use fat and ketones as their primary fuel sources (Volek et al., 2015), and might be considered advantageous, particularly for prolonged exercise, since access to the extensive quantity of fat stores implies a steady source of energy flow, unlike our limited endogenous CHO stores from muscle and liver glycogen (Yeo et al., 2011; Volek et al., 2015).
Initial exposure to low CHO diets can reduce resting muscle (and presumably liver) glycogen stores within the first several days. This reduction of muscle glycogen stores without notable increase in the capacity for fat utilization is associated with a lowered capacity for exercise performance (Burke and Hawley, 2002). Indeed, a short-term ketogenic diet (1-3 days) has been shown to reduce both prolonged submaximal (~70% of maximal oxygen uptake (V̇O2max)) (Starling et al., 1997; Pitsiladis and Maughan, 1999) and high-intensity supramaximal exercise (Langfort et al., 1997; Lima-Silva et al., 2013). Beyond 5-7 days of exposure to the ketogenic diet, fat oxidation during submaximal exercise is enhanced (Paoli et al., 2015), with maximal performance benefits postulated to take up to several weeks or months (Volek et al., 2015).
CHO availability and muscle glycogen content are primary components of metabolism and exercise performance (Bergström et al., 1967), with skeletal muscle increasingly reliant on CHO as a fuel source as exercise rises in intensity (van Loon et al., 2001). Thus, it stands to reason that restriction of endogenuous CHO availability, forcing greater reliance on fat as the primary fuel source, would adversely affect strenuous exercise performance, such as that needed for high-intensity interval training (HIIT) (Buchheit and Laursen, 2013a). However, no studies to date have examined the effects of long-term reductions in CHO intake on HIIT performance. Therefore, the purpose of this study was to examine the effects of altering from one’s HD to a VLCHF diet over 4 weeks on cardiorespiratory and metabolic responses during HIIT.
Methods
Participants
Eighteen moderately trained males were recruited for this study, before being assigned to 2 groups: a very low-CHO high-fat diet group (VLCHF; N = 9) and a habitual mixed Western diet group (HD; N = 8). Inclusion criteria consisted of being male and between the age of 18 and 30, and actively engaged in regular (at least 3 sessions/week) non-competitive exercise activities, mostly of a low-intensity endurance nature. At baseline, both groups were similarly matched for age (23.8 ± 2.4 vs. 23.8 ± 1.8 years), body height (1.80 ± 0.07 vs. 1.83 ± 0.04 m), body mass (83.2 ± 17.7 vs. 83.7 ± 9.4 kg), body fat (13.7 ± 7.7 vs. 16.1 ± 7.4%) and self-reported exercise activity per week (6.4 ± 2.7 vs. 6.2 ± 1.9 h, VLCHF vs. HD, respectively). All participants were free from any known diseases, and currently not taking medications or dietary supplements. None of the participants had experience with the VLCHF diet before the study. One participant in the HD group withdrew due to his inability to comply with the performance test schedule. Participants were informed of the nature of the study and written informed consent was obtained prior to study commencement. The experimental protocol was approved by the local Ethics Committee and conformed to the principles outlined in the Declaration of Helsinki.
Overview of study design
At baseline (PRE), after 2 weeks (MID) and 4 weeks (POST) of the controlled experiment, participants attended the exercise physiology laboratory for testing. A maximal incremental treadmill test (GXT) was performed at PRE and POST, while an HIIT session was performed at all time points. Tests were separated by 48 h.
All sessions were conducted in the morning, at least 3 h after their last meal and in a thermally-controlled laboratory room (21°C, 40% relative humidity). Each participant performed their laboratory sessions during similar morning hours (± 30 min). Body mass and composition were determined using a bioelectrical impedance analyser (InBody770, Seoul, Korea) and a capillary blood sample was drawn from a finger for the measurement of β-hydroxybutyrate (FreeStyleOptium Neo, Oxon, UK) before all exercise interventions. Participants were advised not to participate in vigorous activity 24 h before the laboratory visits. Apart from the prescribed dietary intervention in the case of the VLCHF group or maintaining HD, participants were asked to perform 3-5 sessions per week of non-supervised training, primarily endurance-based running sessions or exercise according to interest (e.g. team sports, hiking, in-line skating), to record their training heart rate (HR) using a HR monitor (Polar410, Oy, Finland), and to keep an exercise diary.
Dietary intervention and recording
Participants in the HD group were asked to maintain their habitual dietary intake without restriction. The VLCHF diet adhered to by the VLCHF group was defined as consisting of up to 50 g/d of CHO (Feinman et al., 2015). Neither diet included a specific calorie or energy goal. Detailed dietary advice, consisting of meal planning recipe suggestions were provided by a dietician before the study, and assistance was provided at any time during the intervention as required. A handbook was given to participants that contained recipe examples, food lists and guides for counting macronutrients. All foods and quantities consumed were recorded daily beginning 5 days before the intervention period (www.kaloricketabulky.cz). Alcoholic beverages were restricted for the intervention period. Dietary supplements were not permitted for the 1 month before and during the intervention period, while caffeine beverages were restricted before the laboratory sessions.
Exercise testing sessions
In order to determine the maximum aerobic capacity (V̇O2max) and the minimal running speed required to elicit V̇O2max (vV̇O2max) participants performed a graded exercise test (GXT) to volitional exhaustion. The treadmill (LodeValiant, Groningen, The Netherlands) GXT protocol started at 7.0 km/h and increased by 1.5 km/h every 4 min with inclination remaining at 1%. Expired air was continuously monitored for analysis of O2 and CO2 concentrations during the GXT by the use of a breath-by-breath system (ZAN600Ergo; Oberthulba, Germany). Determination of V̇O2max was made based on the highest average O2 consumption measured over a 30s period. vV̇O2max was determined as the speed upon which a plateau in the V̇O2 first occurred or V̇O2 did not increase more than 2.1 ml/kg/min despite an increasing running speed (Kohn, Essén-Gustavsson and Myburgh, 2011). Gas-exchange measurements were also used to quantify the second ventilatory threshold (VT2). VT2 was defined as the second increase in ventilation (VE) with increase in both VE/VO2 and VE/VCO2. HR was measured using a chest belt (PolarElectro; Finland). Fat oxidation was calculated from indirect calorimetry measurements using stoichiometric equations from RER (Jeukendrup and Wallis, 2005). The average RER of the last 2 min of each 4 min interval was used for this calculation, and the highest value was considered as the Fatmax.
The HIIT session involved a 10 min warm-up at 60% vV̇O2max, followed by 5 high-intensity repetitions consisting of 3 min at 100% vV̇O2max, separated by 1.5 min passive recovery (work to rest ratio, 2:1). For the HIIT session, the treadmill was set at 1%, and lasted a total of 34 min. This long interval HIIT protocol (Buchheit and Laursen, 2013a) was chosen because it requires a high level of aerobic oxidative, as well as anaerobic glycolytic and neuromuscular contributions (i.e., Type 4 response, Figure 1 in Buchheit and Laursen, 2013a), in alignment with the objectives of the investigation. In addition to cardiorespiratory variables, blood lactate concentrations were measured from capillary blood samples taken from a finger (20 µL) (Accutrend Plus, Roche, Germany; intra-assay coefficient of variation 5.5%) before exercise, at the end of warm-up (10th min), and after each interval (i.e. in 14th, 18th, 23th, 27th and 31th min). Self-reported perceived exertion (RPE) (Borg, 1982) was recorded after each interval.
Figure 1.
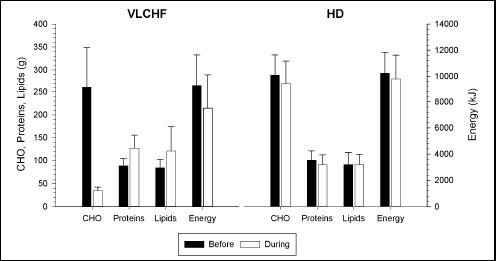
Dietary characteristics across the 5-day recordings before the intervention started (black bars) and during the 4-week experimental period (white bars) in the very low-carbohydrate high-fat diet (VLCHF) and high carbohydrate (HD) groups. Values are expressed as mean ± standard deviation.
Statistical analysis
Standardised differences in the mean (Effect size, ES) and 90% confidence intervals (90% CI) were calculated for differences between groups. Threshold values for ES statistics were <0.2 (trivial), 0.20-0.59 (small), 0.60-1.19 (moderate), 1.20-1.99 (large), 2.00-3.99 (very large), ≥4.00 (nearly perfect). The exact probabilities of an effect were also evaluated qualitatively as follows: 25-75% possibly, 75-95% likely, 95-99.5% very likely, >99.5% most likely. The probability that the true difference was substantial was estimated from the smallest worthwhile change/difference (0.2xbetween-individual standard deviation). If the probability of higher or lower differences was >5% then the true difference was deemed unclear (Batterham and Hopkins, 2006; Hopkins et al., 2009). Statistical analyses were performed using statistical spreadsheets (Hopkins, 2006) and IBM SPSS Statistics 23.
Results
Dietary records and physical activity analysis
The dietary analyses of macronutrients consumed before and during the 4-wk experimental period are shown in Figure 1. The recorded dietary intakes indicated that less than 50 g/d of CHO was ingested per subject throughout the intervention phase for the VLCHF group. The between-group difference in the mean total energy intake before the study (5-day recordings) was unclear (ES ± 90% CI, -0.7 ± 1.0). However, the mean total energy intake was higher in the HD group (-1.4 ± 1.0; very likely) during the 4-week intervention period. Dietary intake of all macronutrients was similar in both groups at baseline. Compared with the initial 5-day baseline recordings, unlike the VLCHF group, the dietary macronutrient structure in the HD group during the 4-week intervention was not changed substantially (Figure 1).
Physical activity was analysed according to the exercise diary and records downloaded from HR monitors to the software Polar ProTrainer 5. There was no substantial difference between the groups in total number of training sessions (15.9 ± 5.5 vs. 14.1 ± 3.1), total training time (1,046 ± 354 vs. 846 ± 515 min) or mean HR expressed as % HRmax (76.1 ± 4.9 vs. 74.8 ± 5.7%, VLCHF vs. HD, respectively) during the 4-week intervention period.
β-hydroxybutyrate (βHB)
The capillary blood βHB concentrations before the study started and in the HD group throughout the study were ≤0.1 mmol/L. However, βHB increased in the VLCHF group to 0.7 ± 0.3 mmol/L after 2 weeks, before decreasing to 0.4 ± 0.2 mmol/L after 4 weeks (ES ± 90% CI: 17.8 ± 5.6 and 9.6 ± 3.8 for MID vs. PRE and POST vs. PRE comparison, respectively; most likely).
Graded Exercise Test (GXT)
The GXT time to exhaustion (TTE) and V̇O2max increased after the experimental period in both study groups, but the group differences between these changes were possibly trivial (-0.1 ± 0.3) and likely small (0.6 ± 0.5), respectively. Additionally, the between-group difference in Fatmax change was large (1.2 ± 0.9, very likely), revealing greater increases in the VLCHF over the HD group (Table 1).
Table 1.
Basic body composition characteristics and GXT results. Values are expressed as mean (± standard deviation).
| VLCHF (N = 9) | HD (N = 8) | Effect Size ± 90% CI | |||
|---|---|---|---|---|---|
| PRE | POST | PRE | POST | ||
| Body mass (kg) | 83.2 (17.7) | 78.5 (15.5) | 83.7 (9.4) | 82.9 (9.6) | -.3 (.1) ** |
| Body fat (%) | 13.7 (7.7) | 10.5 (7.6) | 16.1 (7.4) | 15.0 (7.6) | -.5 (.3) ** |
| V̇O2max (ml/kg/min) | 52.3 (4.7) | 55.4 (4.2) | 51.9 (6.4) | 53.4 (6.9) | .6 (.5) ** |
| V̇O2max (l/min) | 4.3 (.6) | 4.3 (.7) | 4.3 (.5) | 4.4 (.5) | -.1 (.5) |
| HRmax (bpm) | 192(6) | 189(6) | 195(8) | 195 (5.7) | -.3 (.7) |
| vmax (km/h) | 15.1 (1.1) | 15.7 (1.1) | 14.5 (1.4) | 15.2 (1.4) | -.1 (.3) |
| VT2 (% V̇O2max) | 82.3 (3.6) | 85.9 (3.7) | 82.4 (3.9) | 83.9 (1.6) | .6 (.8) |
| TTE (min) | 25.7 (2.8) | 27.2 (3.0) | 24.0 (3.9) | 25.8 (3.8) | -.1 (.3) * |
| Fatmax (g/min) | .8 (.3) | 1.1 (.2) | .7 (.2) | .8 (.2) | 1.2 (.9) *** |
VLCHF/HD – very low-carbohydrate high-fat diet/habitual diet group, CI – confidence interval, PRE – before the experiment, POST – after the experiment, V̇O2max – maximal oxygen consumption, HRmax – maximal heart rate, vmax – maximal running speed, VT2 – second ventilatory threshold, TTE – total time to exhaustion, Fatmax – maximal fat oxidation. The differences over time between the changes in the VLCHF and HD groups expressed as Effect Size values and their likelihood are shown (*possible, **likely, ***very likely, ****most likely) (see also Methods).
High-Intensity Interval Training (HIIT)
There were trivial to small between-group differences in the mean V̇O2 and HR changes across PRE, MID and POST comparisons (Table 2 and Table 3, Figure 2). Mean RER decreased in both groups but was substantially more pronounced in the VLCHF group (most likely large difference between RER changes in VLCHF and HD groups; -1.5 ± 0.1) (Table 2 and 3, Figure 2 and 3). The lactate concentration changes at 2 weeks and 4 weeks of the experiment responded differently (Figure 2), with change differences most/very likely moderate for the MID vs. PRE (1.0 ± 0.5) and POST vs. MID (-0.9 ± 0.6) comparisons, whereas unclear (0.1 ± 0.6) in the POST vs. PRE comparison (Table 2, Figure 3). Comparisons of the RPE changes over time between VLCHF and HD groups were unclear (PRE vs. MID 0.3±0.8; PRE vs. POST -0.4 ± 0.9) or likely small (MID vs. POST -0.58 ± 0.8) (Table 2 and 3). Maximal RER values progressively decreased throughout all five high-intensity repetitions in both groups irrespective of PRE, MID or POST measurement timepoints. A substantial decrease of the peak RER values from PRE vs. MID and POST measurement comparison was apparent in the VLCHF group (Figure 3). Blood lactate values after the last two high-intensity repetitions during the MID and POST measurement increased compared with the PRE measurement in the VLCHF group (Figure 3).
Table 2.
HIIT results. Warm-up and cool-down excluded. Values are expressed as mean (± standard deviation).
| PRE | MID | POST | ||
|---|---|---|---|---|
| Peak V̇O2 (% V̇O2max) | VLCHF | 97.8 (3.9) | 96.3 (5.2) | 98.2 (5.0) |
| HD | 94.6 (4.4) | 90.2 (5.3) | 96.0 (7.3) | |
| Mean V̇O2 (% V̇O2max) | VLCHF | 77.0 (17.6) | 75.7 (16.8) | 76.9 (17.7) |
| HD | 72.4 (17.5) | 68.9 (17.0) | 73.0 (18.7) | |
| Mean HR (% HRmax) | VLCHF | 86.8 (7.3) | 86.1 (7.3) | 84.1 (7.6) |
| HD | 87.4 (7.0) | 84.3 (7.2) | 84.3 (7.8) | |
| Mean RER | VLCHF | 0.96 (0.06) | 0.84 (0.04) | 0.86 (0.04) |
| HD | 0.93 (0.06) | 0.89 (0.05) | 0.92 (0.05) | |
| Mean Lactate (mmol/L) | VLCHF | 5.9 (1.4) | 6.6 (1.6) | 5.9 (1.1) |
| HD | 5.3 (1.2) | 4.5 (.6) | 5.2 (.9) | |
| Mean RPE | VLCHF | 13.8 (1.7) | 13.4 (1.8) | 12.2 (1.4) |
| HD | 14.5 (1.3) | 13.8 (1.4) | 13.7 (1.8) |
PRE – before the experiment, MID – after 2 weeks of the experiment, POST – after the experiment, VLCHF/HD – very low-carbohydrate high-fat diet/habitual diet group, V̇O2 – oxygen consumption, HR – heart rate, RER – respiratory exchange ratio, RPE – rate of perceived exertion.
Table 3.
The differences between changes in the HIIT results in the VLCHF and HD groups. Warm-up and cool-down excluded.
| MID vs. PRE | POST vs. PRE | POST vs. MID | |
|---|---|---|---|
| Peak V̇O2 | 0.7 ± 01.3, unclear | -0.2 ± 1.1, unclear | -0.9 ± 1.3, unclear |
| Mean V̇O2 | 0.1 ± 0.0****, trivial | -0.0 ± 0.0****, trivial | -0.2 ± 0.0***, trivial |
| Mean HR | 0.3 ± 0.0****, small | 0.1 ± 0.1****, trivial | -0.3 ± 0.1**, small |
| Mean RER | -1.4 ± 0.1****, large | -1.5 ± 0.1****, large | -0.1 ± 0.1***, trivial |
| Mean Lactate | 1.0 ± 0.5****, moderate | 0.1 ± 0.6, unclear | -0.9 ± 0.6***, moderate |
| RPE | 0.3 ± 0.8, unclear | -0.4 ± 0.9, unclear | -0.6 ± 0.8**, small |
PRE – before the experiment, MID – after 2 weeks of the experiment, POST – after the experiment, V̇O2 – oxygen consumption, HR – heart rate, RER – respiratory exchange ratio, RPE – rate of perceived exertion. The differences over time between the changes in the VLCHF and HD groups expressed as Effect Size ± 90% CI values, magnitude based inference and their likelihood are shown (*possible, **likely, ***very likely, ****most likely) (see also Methods).
Figure 2.
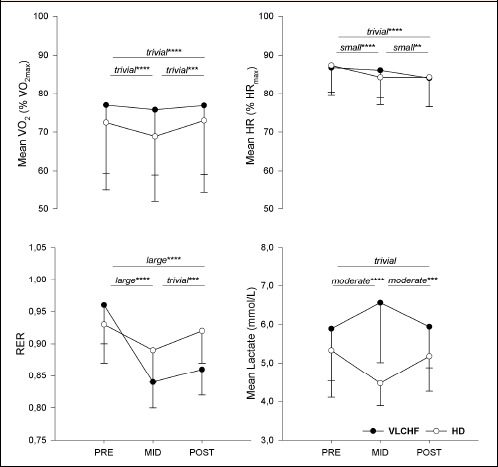
Mean (and standard deviation) V̇O2, HR, RER and lactate during the high-intensity interval training (HIIT) session before the experimental period (PRE), after 2 weeks (MID) and at 4 weeks (POST). The differences over time between the very low-carbohydrate high-fat diet (VLCHF) and habitual mixed Western diet (HD) groups expressed as magnitude-based inferences and their likelihood are shown (*possible, **likely, ***very likely, ****most likely. No asterisk means that 90% CL overlapped the thresholds for substantiveness - unclear difference) (see also Methods).
Figure 3.
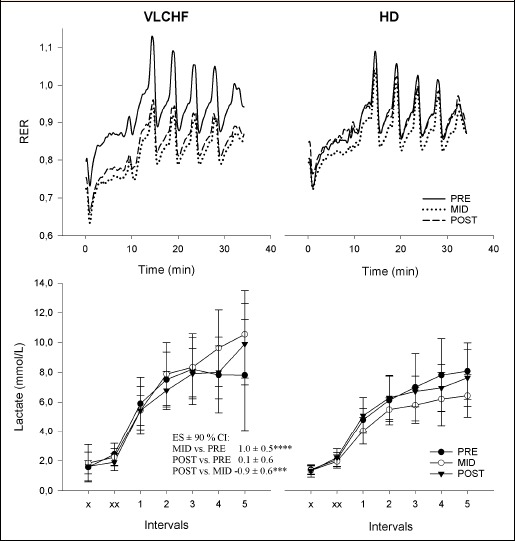
Respiratory exchange ratio (RER) and lactate concentrations during HIIT in the very low-carbohydrate high-fat diet (VLCHF) and habitual mixed Western diet (HD) groups. x – before exercise, xx- after warm-up. The differences over time in lactate between the VLCHF and HD groups expressed as ES ± 90% CI and their likelihood are shown (*possible, **likely, ***very likely, ****most likely. No asterisk means that 90% CL overlapped the thresholds for substantiveness - unclear difference) (see also Methods). Lactate values are expressed as mean ± standard deviation.
Body composition characteristics
Body mass (by 5.7% in VLCHF, 1.0% in HD) and body fat (by 23.4% in VLCHF, 6.8% in HD) decreased in both groups (Table 1) probably due in part to the lowered energy intake (Figure 1). However, the group difference between these changes was likely small for body mass (ES ± 90% CI; -0.3 ± 0.1) as well as body fat (-0.5 ± 0.3).
Discussion
In the present study, we compared the effects of shifting from a habitual mixed Western diet (HD) to that of a very low-carbohydrate high-fat diet (VLCHF) on the physiological responses to a graded exercise test (GXT) and a high-intensity interval training (HIIT) session. We presumed that reduced dietary carbohydrate availability apparent in the VLCHF group would adversely affect their high-intensity exercise performance during either the latter stages of the GXT or in their ability to complete the HIIT bouts. In contrast to our hypothesis, however, we could not find evidence of high-intensity performance compromise during the final stages of the GXT or during the HIIT bouts. We did however observe increased fat oxidation rates in the VLCHF group after 4 weeks.
It has long been accepted that both aerobic and anaerobic exercise performance is highly reliant on CHO availability (Cermak and van Loon, 2013; Hawley et al., 1997). Dietary guidelines have recommended daily CHO intake of 6-10 g/kg for athletes performing 1-3 h of daily moderate- to high-intensity exercise (Burke et al., 2011). While athletes in the present study would not be considered highly trained, our findings and others (Cox et al., 2016; Volek et al., 2015; Zajac et al., 2014) challenge the presumed necessity of a high-CHO diet for high-intensity exercise performance. In the context of habitual diet and how it may relate to exercise performance, an important variable that has been less examined is the duration of dietary adaptation. For example, a 7-day low-CHO diet (13% of total energy) in highly-trained female athletes significantly reduced TTE (by 47%) during cycling at 80% V̇O2max when compared to moderate or high CHO diets (54% and 72% of total energy, respectively) (O’Keeffe et al., 1989). However, a 14-day VLCHF diet (7% of total energy) in well-trained athletes induced significant increases in TTE (by 87%) during moderate intensity cycling at 60% V̇O2max, while high-intensity exercise (Wingate test and TTE at 90% V̇O2max) was unaffected (Lambert et al., 1994). In the most recent study to examine the topic in athletes, Burke et al. (Burke et al., 2017) used a 3-week low-CHO high-fat diet (LCHF) and showed a performance impairment (-1.6%) over a 10-km race walk in elite race walkers; high-CHO and periodized-CHO groups showed a performance improvement (6.6% and 5.3%, respectively). While the absolute change in V̇O2 (L/min) at race speed (12-15 km/h) following the 3-week diet intervention during a standardized graded economy test were not statistically different between groups, exercise economy reduction (increased V̇O2 for a given speed) was used to explain the performance decrease in the LCHF group (Burke et al., 2017). As body mass decreased the most in the LCHF group (by 1.8 kg versus 0.6 and 1.6 kg in the high-CHO and periodized-CHO groups, respectively) an increase in V̇O2 expressed per body mass would be expected. As well, confidence intervals shown for performance decrease in the LCHF group (90% CL: -8.5, 5.3%) suggest large inter-individual responses to the LCHF diet, and could potentially be reflective of diet adaptation level. Our additional week of VLCHF diet adaptation may be important in the context of understanding the time needed to become accustomed and fully adapted to distinctly different habitual diets. Indeed, some have suggested that adaptation to the VLCHF diet may require several weeks to months before benefits may be realized (Volek et al., 2015). Most recently, high intensity exercise performance including peak and average relative power during a 6-s sprint and critical power test were recently shown to improve after 12-weeks adaptation to a VLCHF diet, with 100-km time trial performance maintained (McSwiney et al., 2018).
Evidence of the adaptation and compliance to VLCHF diet is usually evaluated by the βHB concentration in plasma. The βHB concentration increased substantially after two weeks (0.7 ± 0.3 mmol/L) and then decreased after four weeks but remained elevated (0.4 ± 0.2 mmol/L) in the VLCHF group. Accepting the threshold of βHB for nutritional ketosis as >0.5-3.0 mmol/L (Volek and Phinney, 2012), suggests that nutritional ketosis was achieved despite lower concentrations of βHB shown compared with previously published studies (Burke et al., 2017; Zajac et al., 2014). The macronutrient profile of the VLCHF diet (higher protein content) differed from previous research also (29% versus 17%) (McSwiney et al., 2018) and might be considered as a possible explanation of the lower βHB concentration.
Consistent with other studies (Burke et al., 2017; Cox et al., 2016; Peters and Leblanc, 2004), the VLCHF diet applied over 4 weeks in the present study resulted in a metabolic substrate shift toward a greater reliance on fat versus carbohydrate oxidation, as indirectly assessed by the RER measurement (Figure 4). It is also worthy to notice that the maximal aerobic capacity (V̇O2max expressed in absolute values, Table 1) did not change in both study groups, so that RER changes are most likely related to the diet intervention. The progressive decrease in RER over the repeated high-intensity work intervals during the HIIT supports the importance of aerobic metabolism (and fat oxidation) for completing an HIIT session (Cipryan et al., 2017; Hetlelid et al., 2015).
Figure 4.
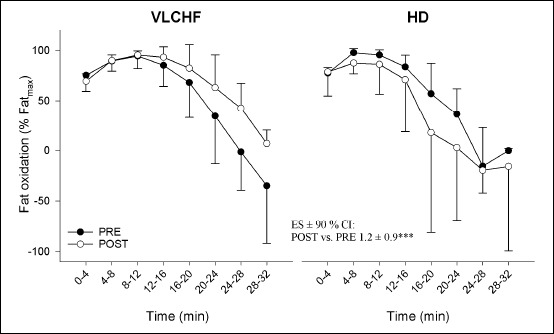
Fat oxidation during the graded exercise test in the very low-carbohydrate high-fat diet (VLCHF) and habitual mixed Western diet (HD) groups. The differences over time between the VLCHF and HD groups expressed as ES ± 90% CI and its likelihood is shown (***very likely) (see also Methods). Values are expressed as mean ± standard deviation.
A major trepidation of athletes, coaches and scientists concerning the VLCHF diet is that it severely impairs the ability to perform high-intensity training optimally (Burke, 2015; Close et al., 2016; Hawley and Leckey, 2015). Indeed, such HIIT workouts are considered vital components of training for most sports (Buchheit and Laursen, 2013b). Thus, our findings are important in this regard, as HIIT performance was not compromised in these participants after 4 weeks of adaptation to their VLCHF diet. While performance in the HIIT bout was fixed or closed and not ‘open ended’, there was no evidence of performance compromise. For example, all HIIT bouts were fully completed in both diet groups, there was no difference in RPE during the HIIT between groups, and no difference in TTE (and V̇O2max) during the GXT between the groups (Table 1).
With respect to strenuous intermittent exercise, a close correlation (r = 0.79, p < 0.01) has been shown between muscle glycogen levels and exercise performance after 6 weeks adoption to a VLCHF diet (1% of CHO of total energy) (Bogardus et al., 1981). While we did not measure muscle glycogen content in our study, HIIT was not adversely affected after 2 and 4 weeks of restricted dietary CHO availability in the VLCHF group (Figure 1). Specifically, we found no between-group differences in mean V̇O2 and mean HR changes over the three identical HIIT sessions (Table 2 and 3, Figure 2). Additionally, all participants were able to finish their HIIT session without any observable increase in perceived exercise effort, as evaluated by RPE (Borg, 1982) (Table 2 and 3). Participants in both study groups achieved at least 90 % V̇O2max during the HIIT sessions as expected, with no substantial between-group differences shown. This is an exercise intensity that is clearly above VT2 for all participants in both groups (Tables 1 and 2). It has been suggested that low-CHO diets (17% of CHO of total energy) may compromise the ability to oxidize available glycogen at a sufficient rate to fuel high-intensity exercise (Havemann et al., 2006) and impair rather than spare glycogen utilization during exercise by reducing glycogenolysis (Stellingwerff et al., 2006). Since the catabolism of muscle glycogen is considered the primary source of plasma lactate, reduced blood lactate concentrations during exercise performed under the condition of prolonged CHO restriction should also be expected (Cox et al., 2016; Havemann et al., 2006). In our study, mean lactate concentration substantially (most likely moderately) increased in the VLCHF group after 2 weeks (Figure 3). Between-group differences in lactate dynamics were also evident during HIIT (Figure 3) with plasma lactate concentrations increasing further toward the end of the HIIT after 2 and 4 weeks in the VLCHF group. These findings compare with Volek et al. (2016) who showed a two-fold higher lactate concentration at the end of a 3-h treadmill run at 65% V̇O2max in chronically adapted VLCHF diet ultra-runners (9-36 months; 10% of CHO of total energy). Similarly, Webster et al. (2016) demonstrated higher (but not significantly, p = 0.21) lactate concentrations (3.2 ± 1.0 vs. 2.8 ± 1.2 mmol/L in VLCHF vs. HD groups, respectively) during a 2-h cycling task, with greater increases in lactate concentrations towards the end of exercise in the VLCHF group (8 months; 7% of CHO of total energy). The authors proposed that this could have been due to more newly synthesized hepatic glucose from glycerol compared with the HD group, who derived more glucose from lactate, despite similar rates of gluconeogenesis during exercise. Additionally, higher lactate concentrations during exercise in our VLCHF group might also be explained by an inhibited pyruvate dehydrogenase (PDH) activity and subsequent decrease of the conversion of pyruvate to acetyl-CoA (Peters et al., 1998), leading to increases in lactate production from pyruvate via lactate dehydrogenase, coupled with impairment of blood lactate utilisation via gluconeogenesis. Both explanations presume that the glycogen stores were not depleted and were still available for high-intensity exercise even if our VLCHF group shifted largely to using fat as a fuel for muscle contraction. A non-significant decrease in muscle lactate concentration has been shown despite an increased plasma lactate concentration following a short-term ketogenic diet intervention (Stellingwerff et al., 2006). Therefore, changes in lactate clearance or use of lactate as a fuel may explain the disparate findings shown across varying adaptation periods. Wood suggests that if PDH activity is reduced, pyruvate may instead be diverted through pyruvate carboxylase to make oxaloacetate to facilitate the continuation of the Krebs cycle; the required acetyl-CoA then provided by other fuels as required (fatty acids or ketone bodies) (Wood, 2017).
Limitations within the current study should also be considered. First, we did not measure intramuscular glycogen levels, which would have significantly extended our understanding. Second, a lack of standardization of diets occurred in this study and we are reliant on the study participants to monitor themselves appropriately. Finally, all foods consumed during the intervention period, including the last meal ingested before the exercise testing, were not isocaloric, and this might also have influenced the study outcomes.
Practical applications
HIIT plays a pivotal role in the training programs of most endurance athletes. Accordingly, any external effects on HIIT execution considered detrimental to the desired training outcome should be naturally avoided. Dietary CHO availability is believed to be essential for performing high-intensity exercise (Havemann et al., 2006; Kerksick et al., 2017). Our study challenges this premise, as when CHO intake was restricted for 2 and 4 weeks in the VLCHF group, with the exception of heighted levels of fat oxidetion rates and blood lactate concentrations relative to the HD group, we observed no difference in the psycho-physiological responses to HIIT (i.e., same VO2, HR and RPE). As such, HIIT can be applied in athletes adherring to a low carbohydrate diet.
Conclusion
We asked participants to alter their habitual mixed Western diet to that of a very low-CHO high-fat diet for 4 weeks and examined its effect on physiological variables during a graded exercise test and a HIIT bout. While substantial changes in substrate oxidation were found, with heightened levels of fat oxidation and blood lactate concentration in the VLCHF group, we found no adverse effects of a 4-week VLCHF diet on any aspect of performance during either the GXT or the HIIT bout in these recreationally-trained participants.
Acknowledgements
This work was supported by Czech Science Foundation (Grant 18-08358S) and Ostrava University (Grant SGS PdF2016). All authors declare no conflict of interest. The experiments comply with the current laws of the country in which they were performed.
Biographies

Lukas Cipryan
Employment
Lecturer & Researcher, Human Motion Diagnostic Centre & Department of Human Movement Studies, Ostrava University, Czech Republic
Degree
Ph.D.
Research interest
Exercise physiology, performance diagnostics and training, nutrition, exercise prescription.
E-mail: lukas.cipryan@osu.cz

Daniel Plews
Employment
Research Fellow; Sports Performance Research Institute New Zealand, Auckland University of Technology, Auckland, New Zealand
Degree
Ph.D.
Research interests
Exercise physiology and performance, heart rate variability, performance optimisation, functional resistance training.
E-mail: daniel.plews@aut.ac.nz

Alessandro Ferretti
Employment
Independent Researcher
Research interest
nutrition
E-mail: a.ferretti@me.com

Philip Maffetone
Employment
Independent researcher; Retired clinician
Degree
Dr. DC
Research interests
Exercise physiology, nutrition assessment and therapy, biofeedback, lecturer, writer.
E-mail: philmaffetone@gmail.com

Paul Laursen
Employment
Adjunct Professor, Sports Performance Research Institute New Zealand (SPRINZ), Auckland University of Technology, Auckland, New Zealand
Degree
PhD
Research interests
High-intensity interval training, ketosis, heart rate variability, thermoregulation, artificial intelligence
E-mail: paul.laursen@aut.ac.nz
References
- Bartlett J.D., Hawley J.a, Morton J.P. (2015) Carbohydrate availability and exercise training adaptation: Too much of a good thing? European Journal of Sport Science 15(1), 3-12. [DOI] [PubMed] [Google Scholar]
- Batterham A.M., Hopkins W.G. (2006) Making Meaningful Inferences about Magnitudes. International Journal of Sports Physiology and Performance 1(1), 50-57. [PubMed] [Google Scholar]
- Bergström J., Hermansen L., Hultman E., Saltin B. (1967) Diet, Muscle Glycogen and Physical Performance. Acta Physiologica Scandinavica 71(2–3), 140–150. [DOI] [PubMed] [Google Scholar]
- Bogardus C., LaGrange B.M., Horton E.S., Sims E. A. (1981) Comparison of carbohydrate-containing and carbohydrate-restricted hypocaloric diets in the treatment of obesity. Endurance and metabolic fuel homeostasis during strenuous exercise. Journal of Clinical Investigation 68(2), 399-404. [DOI] [PMC free article] [PubMed] [Google Scholar]
- Borg G. a. (1982) Psychophysical bases of perceived exertion. Medicine and Science in Sports and Exercise 14(5), 377-381. [PubMed] [Google Scholar]
- Buchheit M., Laursen P.B. (2013a) High-intensity interval training, solutions to the programming puzzle: Part I: Cardiopulmonary emphasis’, Sports Medicine 43(5), 313-338. [DOI] [PubMed] [Google Scholar]
- Buchheit M., Laursen P.B. (2013b) High-intensity interval training, solutions to the programming puzzle: Part II: Anaerobic energy, neuromuscular load and practical applications. Sports Medicine 43(10), 927-954. [DOI] [PubMed] [Google Scholar]
- Burke L.M. (2015) Re-Examining High-Fat Diets for Sports Performance: Did We Call the “Nail in the Coffin” Too Soon? Sports Medicine 45(S1), 33-49. [DOI] [PMC free article] [PubMed] [Google Scholar]
- Burke L.M., Hawley J.A. (2002) Effects of short-term fat adaptation on metabolism and performance of prolonged exercise. Medicine and Science in Sports and Exercise 34(9), 1492-1498. [DOI] [PubMed] [Google Scholar]
- Burke L.M., Hawley J.A., Wong S.H. S., Jeukendrup A.E. (2011) ‘Carbohydrates for training and competition. Journal of Sports Sciences 29(sup1), S17-S27. [DOI] [PubMed] [Google Scholar]
- Burke L.M., Ross M.L., Garvican-Lewis L.A., Welvaert M., Heikura I.A., Forbes S.G., Mirtschin J.G., Cato L.E., Strobel N., Sharma A.P., Hawley J.A. (2017) Low carbohydrate, high fat diet impairs exercise economy and negates the performance benefit from intensified training in elite race walkers. The Journal of Physiology 595(9), 2785-2807. [DOI] [PMC free article] [PubMed] [Google Scholar]
- Cermak N.M., van Loon L.J.C. (2013) The Use of Carbohydrates During Exercise as an Ergogenic Aid’. Sports Medicine 43(11), 1139-1155. [DOI] [PubMed] [Google Scholar]
- Cipryan L., Tschakert G., Hofmann P. (2017) Acute and Post-Exercise Physiological Responses to High-Intensity Interval Training in Endurance and Sprint Athletes. Journal of Sports Science and Medicine 16, 219-229. [PMC free article] [PubMed] [Google Scholar]
- Close G.L., Hamilton D.L., Philp A., Burke L.M., Morton J.P. (2016) New strategies in sport nutrition to increase exercise performance. Free Radical Biology and Medicine 98, 144-158. [DOI] [PubMed] [Google Scholar]
- Cox P.J., Kirk T., Ashmore T., Willerton K., Evans R., Smith A., Murray A.J., Stubbs B., West J., McLure S.W., King M.T., Dodd M.S., Holloway C., Neubauer S., Drawer S., Veech R.L., Griffin J.L., Clarke K. (2016) Nutritional Ketosis Alters Fuel Preference and Thereby Endurance Performance in Athletes. Cell Metabolism 24(2), 256-268. [DOI] [PubMed] [Google Scholar]
- Feinman R.D., Pogozelski W.K., Astrup A., Bernstein R.K., Fine E. J., Westman E.C., Accurso A., Frassetto L., Gower B.A., McFarlane S.I., Nielsen J.V., Krarup T., Saslow L., Roth K. S., Vernon M.C., Volek J.S., Wilshire G.B., Dahlqvist A., Sundberg R., Childers A., Morrison K., Manninen A.H., Dashti H.M., Wood R.J., Wortman J., Worm N. (2015) Dietary carbohydrate restriction as the first approach in diabetes management: Critical review and evidence base. Nutrition 31(1), 1-13. [DOI] [PubMed] [Google Scholar]
- Havemann L., West S.J., Goedecke J.H., Macdonald I.A., St Clair Gibson A., Noakes T.D., Lambert E.V. (2006) Fat adaptation followed by carbohydrate loading compromises high-intensity sprint performance. Journal of Applied Physiology 100(1), 194-202. [DOI] [PubMed] [Google Scholar]
- Hawley J.A., Leckey J.J. (2015) Carbohydrate Dependence During Prolonged, Intense Endurance Exercise. Sports Medicine 45(S1), 5-12. [DOI] [PMC free article] [PubMed] [Google Scholar]
- Hawley J.A., Schabort E.J., Noakes T.D., Dennis S.C. (1997) Carbohydrate-Loading and Exercise Performance. Sports Medicine 24(2), 73-81. [DOI] [PubMed] [Google Scholar]
- Hetlelid K.J., Plews D.J., Herold E., Laursen P.B., Seiler S. (2015) Rethinking the role of fat oxidation: substrate utilisation during high-intensity interval training in well-trained and recreationally trained runners. BMJ Open Sport & Exercise Medicine 1(1), p. e000047. [DOI] [PMC free article] [PubMed] [Google Scholar]
- Hopkins W.G. (2006) Spreadsheets for Analysis of Controlled Trials, with Adjustment for a Subject Characteristic. Sportscience 10, 46-50. Available at URL: http://sportsci.org/2006/wghcontrial.htm (Accessed: 9 September 2016). [Google Scholar]
- Hopkins W.G., Marshall S.W., Batterham A.M., Hanin J. (2009) Progressive Statistics for Studies in Sports Medicine and Exercise Science. Medicine & Science in Sports & Exercise 41(1), 3-13. [DOI] [PubMed] [Google Scholar]
- Jeukendrup A.E., Wallis G.A. (2005) Measurement of Substrate Oxidation During Exercise by Means of Gas Exchange Measurements. International Journal of Sports Medicine 26(1), S28-S37. [DOI] [PubMed] [Google Scholar]
- Kerksick C., Harvey T., Stout J., Campbell B., Wilborn C., Kreider R., Kalman D., Ziegenfuss T., Lopez H., Landis J., Ivy J.L., Antonio J. (2017) International Society of Sports Nutrition position stand: Nutrient timing. Journal of the International Society of Sports Nutrition 17. [DOI] [PMC free article] [PubMed] [Google Scholar]
- Kohn T.A., Essén-Gustavsson B., Myburgh K.H. (2011) Specific muscle adaptations in type II fibers after high-intensity interval training of well-trained runners. Scandinavian Journal of Medicine & Science in Sports 21(6), 765-772. [DOI] [PubMed] [Google Scholar]
- Lambert E.V., Speechly D.P., Dennis S.C., Noakes T.D. (1994) Enhanced endurance in trained cyclists during moderate intensity exercise following 2 weeks adaptation to a high fat diet. European Journal of Applied Physiology and Occupational Physiology 69(4), 287-293. [DOI] [PubMed] [Google Scholar]
- Langfort J., Zarzeczny R., Pilis W., Nazar K., Kaciuba-Uscitko H. (1997) ‘he effect of a low-carbohydrate diet on performance, hormonal and metabolic responses to a 30-s bout of supramaximal exercise. European Journal of Applied Physiology 76(2), 128-133. [DOI] [PubMed] [Google Scholar]
- Lima-Silva A.E., Pires F.O., Bertuzzi R., Silva-Cavalcante M.D., Oliveira R.S.F., Kiss M.A., Bishop D. (2013) Effects of a low- or a high-carbohydrate diet on performance, energy system contribution, and metabolic responses during supramaximal exercise. Applied Physiology, Nutrition, and Metabolism 38(9), 928-934. [DOI] [PubMed] [Google Scholar]
- van Loon L.J.C., Greenhaff P.L., Constantin-Teodosiu D., Saris W.H. M., Wagenmakers A.J.M. (2001) The effects of increasing exercise intensity on muscle fuel utilisation in humans. The Journal of Physiology 536(1), 295-304. [DOI] [PMC free article] [PubMed] [Google Scholar]
- McSwiney F.T., Wardrop B., Hyde P.N., Lafountain R.A., Volek J.S., Doyle L. (2018) Keto-adaptation enhances exercise performance and body composition responses to training in endurance athletes. Metabolism 81, 25-34. [DOI] [PubMed] [Google Scholar]
- O’Keeffe K.A., Keith R.E., Wilson G.D., Blessing D.L. (1989) Dietary carbohydrate intake and endurance exercise performance of trained female cyclists. Nutrition Research 9(8), 819-830. [Google Scholar]
- Paoli A., Bianco A., Grimaldi K.A. (2015) The Ketogenic Diet and Sport. Exercise and Sport Sciences Reviews 43(3), 153-162. [DOI] [PubMed] [Google Scholar]
- Peters S.J., Leblanc P.J. (2004) Metabolic aspects of low carbohydrate diets and exercise. Nutrition & Metabolism 1(1), 7. [DOI] [PMC free article] [PubMed] [Google Scholar]
- Peters S.J., St.Amand T.a, Howlett R.a, Heigenhauser G.J., Spriet L.L. (1998) Human skeletal muscle pyruvate dehydrogenase kinase activity increases after a low-carbohydrate diet. American Journal of Physiology. Endocrinology and Metabolism 275(6), E980-E986. [DOI] [PubMed] [Google Scholar]
- Pitsiladis Y.P., Maughan R.J. (1999) The effects of exercise and diet manipulation on the capacity to perform prolonged exercise in the heat and in the cold in trained humans. The Journal of Physiology 517(3), 919-930. [DOI] [PMC free article] [PubMed] [Google Scholar]
- Starling R.D., Trappe T.A., Parcell A.C., Kerr C.G., Fink W.J., Costill D.L. (1997) Effects of diet on muscle triglyceride and endurance performance. Journal of Applied Physiology 82(4), 1185-1189. [DOI] [PubMed] [Google Scholar]
- Stellingwerff T., Spriet L.L., Watt M.J., Kimber N.E., Hargreaves M., Hawley J.A., Burke L.M. (2006) Decreased PDH activation and glycogenolysis during exercise following fat adaptation with carbohydrate restoration. American Journal of Physiology. Endocrinology and Metabolism 290(2), E380-388. [DOI] [PubMed] [Google Scholar]
- Volek J., Phinney S.D. (2012) The art and science of low carbohydrate performance : a revolutionary program to extend your physical and mental performance envelope. Beyond Obesity. [Google Scholar]
- Volek J.S., Freidenreich D.J., Saenz C., Kunces L.J., Creighton B.C., Bartley J.M., Davitt P.M., Munoz C.X., Anderson J.M., Maresh C.M., Lee E.C., Schuenke M.D., Aerni G., Kraemer W.J., Phinney S.D. (2016) Metabolic characteristics of keto-adapted ultra-endurance runners. Metabolism 65(3), 100-110. [DOI] [PubMed] [Google Scholar]
- Volek J.S., Noakes T., Phinney S.D. (2015) Rethinking fat as a fuel for endurance exercise. European Journal of Sport Science 15(1), 13-20. [DOI] [PubMed] [Google Scholar]
- Webster C.C., Noakes T.D., Chacko S.K., Swart J., Kohn T.A., Smith J.A.H. (2016) Gluconeogenesis during endurance exercise in cyclists habituated to a long-term low carbohydrate high-fat diet. The Journal of Physiology 594(15), 4389-4405. [DOI] [PMC free article] [PubMed] [Google Scholar]
- Wood T. (2017) Lost Metabolic Machinery During Ketosis? Depends Where You Are Looking. Strength and Conditioning Journal 39(5), 94-95. [Google Scholar]
- Yeo W.K., Carey A.L., Burke L., Spriet L.L., Hawley J.a. (2011) Fat adaptation in well-trained athletes: effects on cell metabolism. Applied Physiology, Nutrition, and Metabolism 36(1), 12-22. [DOI] [PubMed] [Google Scholar]
- Zajac A., Poprzecki S., Maszczyk A., Czuba M., Michalczyk M., Zydek G. (2014) The Effects of a Ketogenic Diet on Exercise Metabolism and Physical Performance in Off-Road Cyclists. Nutrients 6(7), 2493-2508. [DOI] [PMC free article] [PubMed] [Google Scholar]