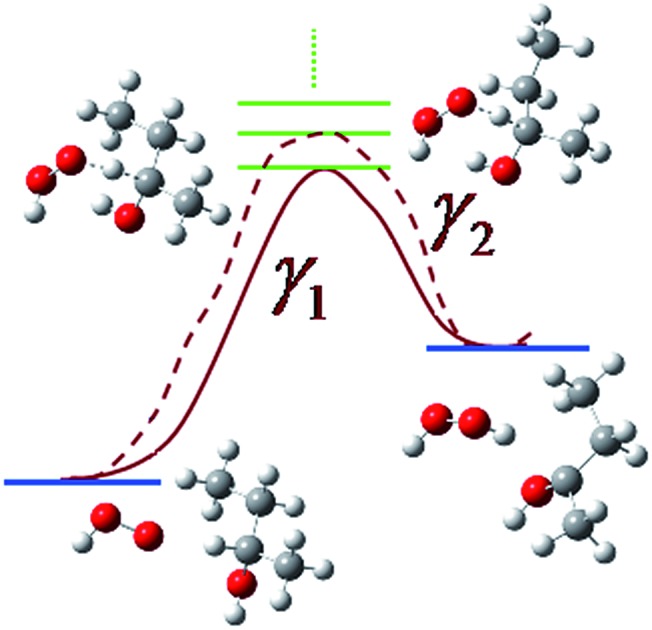
 A hydrogen bond at the transition state can lower the enthalpy of activation, but raise the free energy of activation.
Abstract
The goal of the present work is modeling the kinetics of a key reaction involved in the combustion of the biofuel 2-butanol. To accomplish this we extended multi-path variational transition state theory (MP-VTST) with the small curvature tunneling (SCT) approximation to include multistructural anharmonicity factors for molecules with chiral carbons. We use the resulting theory to predict the site-dependent rate constants of the hydrogen abstraction from 2-butanol by hydroperoxyl radical. The generalized transmission coefficients were averaged over the four lowest-energy reaction paths. The computed forward reaction rate constants indicate that hydrogen abstraction from the C-2 site has the largest contribution to the overall reaction from 200 K to 2400 K, with a contribution ranging from 99.9988% at 200 K to 88.9% at 800 K to 21.2% at 3000 K, while hydrogen abstraction from the oxygen site makes the lowest contribution at all temperatures, ranging from 2.5 × 10⁻⁹% at 200 K to 0.65% at 800 K to 18% at 3000 K. This work highlights the importance of including the multiple-structure and torsional potential anharmonicity in the computation of the thermal rate constants. We also analyzed the role played by the hydrogen bond at the transition state, and we illustrated the risks of (a) considering only the lowest-energy conformations in the calculations of the rate constants or (b) ignoring the nonlinear temperature dependence of the activation energies. A hydrogen bond at the transition state can lower the enthalpy of activation, but raise the free energy of activation. We find an energy of activation that increases from 11 kcal mol–1 at 200 K to more than 36 kcal mol–1 at high temperature for this radical reaction with a biofuel molecule.
1. Introduction
Fossil fuels are nonrenewable, and there is considerable effort to develop alternatives to petroleum-derived fuels. Bioalcohols can be produced by the biological fermentation of biomass such as sugars and glucose, and they constitute a very promising family of bio-derived substitutes for petroleum-derived fuels. Butanol is an important member in the bioalcohol family and is an advanced biofuel superior to ethanol. The combustion chemistry of the four isomers of butanol, namely n-butanol, 2-butanol, isobutanol, and tert-butanol, has recently drawn great interest, and understanding the combustion chemistry of a fuel is a prerequisite for maximizing its utility. The hydrogen abstraction reactions from different sites of a butanol by hydroxyl radical (HO˙), hydroperoxyl radical (HO2˙), and hydrogen radical (H˙) are very important in the combustion processes, which are the first step in all the kinetic mechanisms proposed, and they have received wide study in recent years. For example, the thermal rate constants at various temperatures of the hydrogen abstraction reactions of n-butanol1,2 and isobutanol3 have been calculated via multistructural variational transition state theory (MS-VTST),4–7 and they have been measured by shock tube experiments,8 laser absorption experiments,9 and the pulsed laser photolysis-laser induced fluorescence technique.10 However, 2-butanol, although having various promising physicochemical properties,11 has rarely been studied. Pang and coworkers12 determined the overall rate constant for hydroxyl radical (HO˙) + 2-butanol by measuring the near-first-order hydroxyl radical decay in shock-heated mixtures. Yasunaga13 and coworkers studied the pyrolysis and oxidation of all four butanols using reflected shock waves from 1000 K to 1800 K. Sarathy and others14 proposed a comprehensive combustion model for the four butanol isomers, in which, due to the lack of available reliable calculations, the rate constants of hydrogen abstraction from different sites of 2-butanol by HO2˙ radical were crudely estimated using an Evans–Polanyi-type correlation15 based on the n-butanol + HO2˙ system.
Hydroperoxyl radical (HO2˙) plays a particularly important role in the ignition process at intermediate temperature (∼800–1200 K), partly because another important radical, HO˙, can be formed by the decomposition of H2O2, which is the product of the hydrogen abstraction reaction by hydroperoxyl radical. In the present study, we calculated the rate constants of hydrogen abstraction from different sites of 2-butanol by HO2˙ radical using the recently developed multi-path variational transition state theory (MP-VTST)16,17 with the small-curvature tunneling (SCT) approximation,18 with the MP-VTST treatment being extended here to the treatment of a chiral reactant. Multi-structural variational transition state theory (MS-VTST) calculations, which have now been widely applied in previous work, have also been carried out for comparison. MP-VTST can be viewed as an extension of MS-VTST; first it accounts for the overbarrier contribution of all the reaction paths to the total one-way flux in a more accurate way, and secondly it treats the differences in the multi-dimensional tunneling paths and their contribution to the thermal rate constants more thoroughly.
The five possible hydrogen abstraction reactions that we considered in this work are the abstraction of a hydrogen atom from each of the four carbon sites of 2-butanol or from the oxygen atom. Carbon-2 of the 2-butanol molecule is a chiral center; therefore 2-butanol has two enantiomers: rectus (R) and sinister (S), i.e. (R)-2-butanol and (S)-2-butanol. When 2-butanol reacts with a nonchiral species, which in the present study is the HO2 radical, the thermal rate constants of the R enantiomer and the S enantiomer are the same. Therefore the rate constants of the studied reactions (R1)–(R5) can be computed based on a single enantiomer. In the present work, we use (S)-2-butanol to compute the rate constants. Therefore the reactions we consider are
| S-CH3CH(OH)CH2CH3 + HO2˙ → S-CH2·CH(OH)CH2CH3 + H2O2 | R1 |
| S-CH3CH(OH)CH2CH3 + HO2˙ → CH3C·(OH)CH2CH3 + H2O2 | R2 |
| S-CH3CH(OH)CH2CH3 + HO2˙ → S-CH3CH(OH)C(H˙)CH3 + H2O2 | R3 |
| S-CH3CH(OH)CH2CH3 + HO2˙ → S-CH3CH(OH)CH2CH2˙ + H2O2 | R4 |
| S-CH3CH(OH)CH2CH3 + HO2˙ → S-CH3CH(O˙)CH2CH3 + H2O2 | R5 |
The present calculations not only yield the total rate constant, which is the sum of the five elementary rate constants for reactions (R1)–(R5), but they also yield the five individual elementary rate constants; these site-specific quantities are seldom available experimentally, but they are very important for combustion mechanisms because each of the five products has a different further reactivity pattern after being produced.
Section 2 presents the Theory, and Section 3 has Computational details. Readers interested only in the results may skip to Section 4, which presents Results and discussion. To facilitate this, Section 4 reminds the reader of the definitions of all acronyms and mathematical symbols used in that section. Section 5 summarizes the main conclusions.
2. Theoretical background
Transition state theory assumes that the reaction rate is slower than the interconversion rate between conformers of the reactant (or, more precisely, that those conformers of the reactant that make a significant contribution to the transition state rate constant are all rapidly interconvertable on the atomic time scale of the reaction; if not true, it would be necessary to treat the slowly interconverting conformational structures as chemical isomers, i.e., as different species). Therefore it is necessary to distinguish species (for example a reactant species) from structures (for example, a conformer of a reactant), and here we clarify our terms. A species is a reactant, a product, a conventional transition state, or a generalized transition state (GT). A transition state is a dividing surface6 that separates the reactant region from the product region and is transverse to a selected reaction path. A given reaction may have more than one reaction path and therefore more than one saddle point leading from reactants to products. The conventional transition state passes through these saddle points, and at each of them it is normal to the imaginary-frequency normal mode corresponding to the reaction coordinate of some particular path leading from reactants to products. Any other dividing surface is a generalized transition state.
Each species can have several structures. For reactants and products, the structures are local minima on the potential energy surface and may be called conformers. For conventional transition states, the structures are saddle points with one imaginary frequency and they may be called transition structures. Only saddle points that are maxima on a minimum energy path are considered; that means that the fluxes through transition structures of a given transition state must be added like currents in parallel, not in series.17,19 (One could consider transition states in series by the canonical unified statistical model,20 but that is not the subject of the present study.) For generalized transition states, the structures are the points where the reaction paths pass through the dividing surface, and they may be called generalized transition structures.
For bimolecular reactions, we consider that “the partition function of the reactants” is the product of the partition functions for the two reactants, and “the energy of the reactants” is the sum of their energies. The electronic energy of a structure including nuclear repulsion is the potential energy for nuclear motion. The barrier height V‡f is the increase in potential energy from the lowest-energy equilibrium structure of the reactants to the lowest-energy conventional transition state. Adding zero point energy at these structures give the conventional-transition-state-theory enthalpy of activation at 0 K, which is denoted ΔH‡0. The energy of reaction ΔE is the potential energy of the lowest-energy equilibrium structure of the products minus that of the lowest-energy equilibrium structure of the reactants. Adding zero point energy at these structures gives the enthalpy of reaction at 0 K, which is denoted ΔH0.
We are interested in species that have (in the general case) more than one structure, and these structures may be called conformers. We must replace the rovibrational partition function that is appropriate for a species with a single structure by a conformational–rovibrational partition function for species that have multiple structures. In many cases the conformers are connected by torsions; the local maxima along the torsional coordinates are not barriers along reaction paths connecting reactants to products and so they are not treated as transition structures or generalized transition structures in considering the kinetics; however, the heights of these barriers do have an effect on the conformational–rovibrational partition function when the barrier regions of configuration space are thermally accessible at the temperature of interest. The “classical barrier height” of the chemical reaction is the increase in potential energy from the lowest-energy equilibrium structure of the reactants to the lowest-energy conventional transition state. Adding zero point energy at these structures give the conventional-transition-state-theory enthalpy of activation at 0 K, which is denoted ΔH‡0.
With these concepts and terminologies as background, we can proceed to discuss the theory.
2.1. Multistructural method with torsional anharmonicity
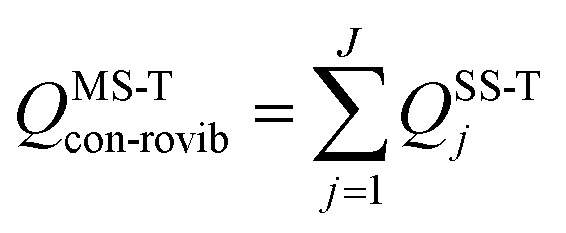
We use the multistructural method with torsional anharmonicity based on a coupled torsional potential21 (MS-T(C)) to calculate the conformational–rovibrational partition function QMS-Tcon-rovib for each species; QMS-Tcon-rovib is defined as
 |
1 |
where j labels a conformer,
 |
2 |
Qrot,j is the conformer's classical rotational partition function including the symmetry number, t is the number of torsions, and QQHj is the normal-mode quasiharmonic oscillator vibrational partition function. We use “quasiharmonic” to denote the use of the harmonic oscillator formula with an effective frequency, which in our work is a scaled harmonic frequency (see below) with a scale factor designed to give a more accurate zero point energy. Therefore a quasiharmonic partition function is expected to be more accurate than a harmonic one. The total number of structures of a species is denoted as J. The local minimum of the potential energy surface is chosen to be the zero of energy for each conformational–rovibrational partition function; therefore, as shown in eqn (2), each conformer is weighted by a Boltzmann factor, in which Uj is the relative potential energy of the local potential energy minimum structure j, kB is the Boltzmann's constant, and T is the thermodynamic temperature. The factor fj,η accounts for the potential function anharmonicity of each coupled torsion η, where torsions are defined by internal coordinates (in particular, by dihedral angles, not by normal-mode coordinates).
A key feature of the MS-T method is that it does not require the calculation of the barrier heights along the reaction paths for the interconversion of conformers; rather these barriers are implicitly approximated in terms of the local periodicities by using a Voronoi tessellation in the available torsional phase space,21–23 which are much easier to compute. This is a generalization of the relation valid for symmetric one-dimensional torsions by which the barrier between equivalent minima can be predicted approximately from the local frequency and the periodicity. Due to the coupling between the torsions, the number of conformational structures that one finds after the optimizations is less than the number of structures generated by ideal torsions, i.e., less than the ideal number of 3t for t threefold torsions. Therefore, the periodicity is not well defined, but we replace it by a local periodicity as explained previously22,23 and extended to chiral reagents in Section 2.5.
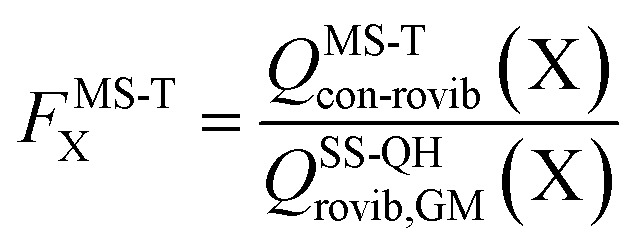
The effect of multistructural torsional anharmonicity on the partition function of a species X can be characterized by the following factor
 |
3 |
where QSS-QHrovib,GM(X) is the single-structural quasiharmonic rovibrational partition function for the global minimum structure of X, which corresponds to eqn (2) without the product of anharmonicity factors. Note that 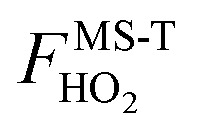 for HO2˙ radical is equal to 1 because HO2˙ has no torsion.
To demonstrate the multistructural torsional anharmonic effect on the reaction rate, we define the following multistructural torsional anharmonicity factor
 |
4 |
where the subscript “act” is an abbreviation for “activation”. In previous papers, this factor is written2 as FMS-Trxn; however, “activation” is a more appropriate term than “reaction” because the numerator refers to the transition state, not the products.
2.2. MS-VTST rate constant
In MS-VTST, the thermal rate constant is calculated by4
| kMS-CVT/SCT = FMS-TactkSS-CVT/SCT1 | 5 |
where kSS-CVT/SCT1 is the single-structural canonical variation theory5 (CVT) rate constant with the multidimensional small curvature tunneling (SCT) approximation,18 employing the lowest-energy structure (labeled here as 1) for reactants and the transition state. The CVT rate constant is computed by variationally optimizing the location of the dividing surface in order to maximize the free energy of activation. The multistructural CVT rate constant is obtained by multiplying the single structural CVT rate constant with the multistructural torsional anharmonicity factor FMS-Tact.
The variational transition state location needed for eqn (5) is obtained by maximizing the quasiclassical standard-state generalized free energy of activation ΔGGT,oact as a function of the reaction coordinate s, which is defined as the distance from the saddle point along the minimum energy path (MEP). For a bimolecular reaction without treating torsional anharmonicity as a function of reaction coordinate, we have
 |
6 |
where ΦMS-QH,R is the MS-QH conformational–rovibrational–electronic partition function of reactants per volume, co is the standard-state concentration, Q‡elec is the electronic partition function at the transition state, VMEP(s) is the potential energy along the MEP that passes through the lowest-energy structure, and QGT-SS-QH(s) is the quasiharmonic rotational-vibrational partition function at location s along that same path.
2.3. MP-VTST rate constant
Multi-path variational transition state theory16 (MP-VTST) generalizes the multistructural variational transition state theory to include not only multiple transition structures in parallel, but also multiple reaction paths in parallel. The multi-path canonical variational theory (MP-CVT) rate constant is computed as:
| kMP-CVT/SCT = FMS-TactγkTST1 | 7 |
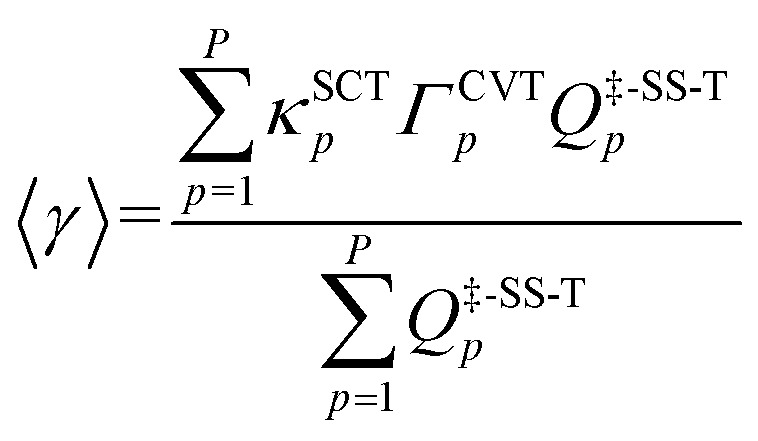
where kTST1 stands for the conventional, single-structural transition state theory (TST) rate constant, where only the lowest-energy structures for the reactants and the transition state are used in the calculation. The averaged generalized transmission coefficient γ based on using P reaction paths is defined as:
 |
8 |
where κSCTp denotes the tunneling transmission coefficient for reaction path p and is based on employing the multidimensional small-curvature tunneling approximation. The CVT recrossing transmission coefficient, ΓCVTp, is computed as the ratio of the CVT rate constant kCVTp to the TST rate constant kTSTp; and Q‡,SS-Tp is the single-structural rovibrational partition function with torsional anharmonicity (T) at the saddle point of the p-th reaction path. Note that the denominator of eqn (8) is a special case of eqn (1) and it cancels out when we substitute eqn (1)–(5) and (8) into eqn (7).
2.4. Anharmonicity along the reaction path in MS-VTST and MP-VTST
In both kinds of calculations that we discussed above, namely MS-VTST and MP-VTST calculations, the torsional anharmonicity is calculated only for the reactants, the products, and the saddle points, and it is included in rate constants by multiplying the CVT/SCT rate constant with the activation anharmonicity factor FMS-Tact at generalized transition states approximated by its value at the saddle point along the same reaction path. A more accurate approach, introduced21 after the original MS-VTST4 and MP-VTST16 methods were published, is to include not only the torsional anharmonicity at the saddle point but its variation along the reaction path, i.e., to calculate the torsional anharmonicity as a function of reaction coordinate s and use the results in locating the variational transition state. We might call these MS(full)-VTST and MP(full)-VTST. In the present article, the final reported rate constants are based on the results without treating the torsional anharmonicity as a function of reaction coordinate because we will show in Section 4.6 that the differences in the rate constants obtained by these two approaches are negligible for the reactions studied here. In the rest of this section we review the detailed methodology for the “full” methods as background for the results presented in Section 4.6. We need only discuss MP-VTST since MS-VTST is a special case of MP-VTST with p = 1.
In the MP-VTST method, the recrossing transmission coefficient of the reaction path p without treating torsional anharmonicity as a function of reaction coordinate s can be written as follows:
 |
9 |
where QVT-SS-QH is the single-structural (SS) quasiharmonic oscillator (QH) rovibrational partition function of the variational transition state (VT); Q‡-SS-QHp represents the rovibrational partition function computed at the saddle point (conventional transition state), and VVTp and V‡ are the potential energies at the VT and at the conventional transition state, respectively.
In contrast, in MP(full)-VTST, we include the s dependence of the torsional anharmonicity, and so we obtain:24
 |
10 |
Note that the location of the generalized transition state may differ (and usually will differ) from the one determined without treating torsional anharmonicity as a function of reaction coordinate, due to the change of the location of the maximum of the free energy of activation, which is now determined now by finding the maximum of
 |
11 |
as a function of s for each path (each path has a different reaction coordinate) where QGT-MS-T is the MS-T partition functions of the generalized transition state.
2.5. Special considerations due to the chirality of 2-butanol
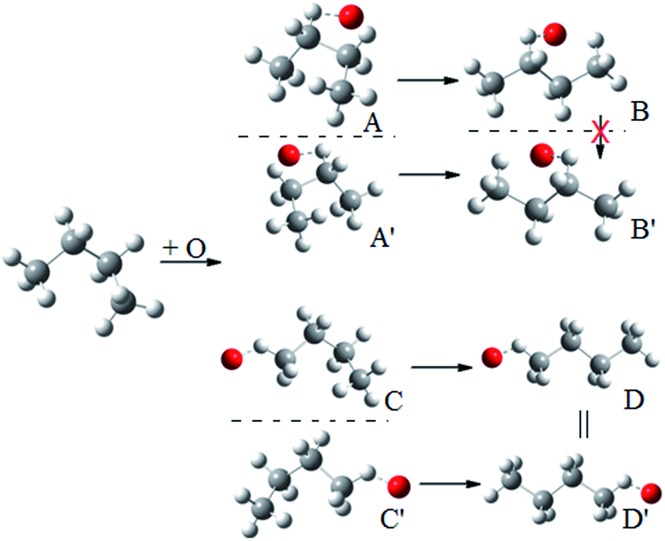
Because of the creation of a new chiral center on carbon-3 during reaction (R3) with the (S)-2-butanol reactant, the transition structure can be either (2S,3R) or (2S,3S), which are diastereomers. The enantiomers of these diastereomers are (2R,3S) and (2R,3R) respectively, which are the transition states formed from (R)-2-butanol. See Fig. 1 for schematic illustrations.
Fig. 1. Schematic representation of the reactions and transition structures for the hydrogen abstraction reaction from 2-butanol by HO2 radical.

The conformational–rotational–vibrational partition function of the transition state of (R3) includes both diastereomers, (2S,3R) and (2S,3S), (where the zero of energy is set at the lowest-energy structure, see eqn (1)), and their corresponding enantiomers, (2R,3S) and (2R,3R) are not included in the calculation because they are formed from (R)-2-butanol (whereas we computed the reaction rates only for (S)-2-butanol). For the other forward reactions (i.e., (R1), (R2), (R4) and (R5)), only the transition structures that can be generated from the S enantiomer of 2-butanol, should be included in the calculation of the partition function. Next we consider the computation of the local periodicities for all these cases.
The local periodicity Mj,η needs to be determined in order to compute the potential anharmonicity factor fj,η in eqn (1). When the torsions are strongly coupled, the Voronoi tessellation method23 is employed to assign the local periodicities. First we define the torsional space as a t-dimensional space described by the torsional coordinates; where the torsional coordinates are taken to be a set of dihedral angles φ1, φ2,…, φt. The Voronoi method divides the torsional space into cells around a discrete set of points that correspond to structures. All structures used in Voronoi tessellation should be interconvertable by internal rotation, i.e. the entire torsional space should be accessible by internal rotation. Each geometry belongs to a specific cell, and each cell contains all the geometries with values of torsional angles that are closer to the primary structure, located at the center of the cell, than to any other structure. A primary structure is a conformer of a reactant, product, first-order saddle point (conventional transition state), or a point on the reaction path (generalized transition state).
As explained in the original MS-T paper,22 the Voronoi calculation must include both distinguishable and indistinguishable primary structures that can be generated from a single structure by internal rotation of one or more torsional coordinates (that is, dihedral angles). If the interconversion between distinguishable structures is impossible by internal rotation, these structures are not in the same torsional space and they are considered separately via independent Voronoi calculations. It is important to analyze the torsional space available for each structure before applying the Voronoi tessellation method to obtain the local periodicities.
We illustrate this by an example in Fig. 2. This figure shows the hydrogen abstraction reactions of butane, which is a nonchiral reactant, by atomic oxygen. A and A′ are the two enantiomeric transition structures formed during the hydrogen abstraction from C-2; B and B′ are obtained by rotating the torsional bonds of A and A′ respectively. Note that B and B′ cannot be superimposed; therefore, the effective periodicities of B and B′ should be computed separately, i.e. B′ should not be included in the Voronoi calculation for the effective periodicities of B. Generally speaking, the enantiomers of a molecule with a chiral carbon cannot be interconverted by torsions and when one computes the effective periodicities for conformers that belong to one specific configuration (R or S), the corresponding enantiomers should not be included in the Voronoi calculation. For example, C and C′ are the two enantiomeric transition structures formed during the hydrogen abstraction from C-1. These two structures should be included in the same Voronoi calculation because they can be interconverted by internal rotations (D and D′, which are obtained by rotating the torsional bonds of C and C′ respectively, are identical).
Fig. 2. A schematic illustration of the interconversion between enantiomers as illustrated by the simple case of butane reacting with oxygen atom.
For a chiral species (chiral reactant, chiral transition state in the case where there are chiral reactants, or chiral transition state in the case where the reactants are not chiral), two kinds of the structures are used in the Voronoi calculations of the effective periodicities, namely indistinguishable primary structures and distinguishable primary structures. However, this does not mean we should include all the distinguishable primary structures in the Voronoi calculation. If the interconversion between some distinguishable structures and the structures we are considering is impossible by internal rotation, these structures are not in the torsional space we are considering and hence should not be included in the Voronoi calculation.
In the present study, since we only consider the transition states and products that can be formed from (S)-2-butanol in the Voronoi calculations of all the species except for P2 (the product radical of reaction (R2), which does not have a chiral carbon); the corresponding enantiomers are not included. For the diastereomeric transition structures of C-3 in the present case, i.e. (2S,3R) and (2S,3S), we compute the effective periodicities of these two classes of transition structures separately via the Voronoi tessellation method. For all species, the enantiomers did not need to be included in the conformational rovibrational partition function either because they are different molecules or because we here consider only the structures that can be formed from (S)-2-butanol. A schematic summary of the relations between various species for reaction (R3), along with an illustration, is provided in Fig. S1 in the ESI.†
In the present study, all the torsions except the methyl groups are assumed to be strongly coupled, and their effective periodicity values are assigned by the Voronoi method. Methyl groups are considered as nearly separable and the local periodicity value for internal rotation of each methyl group is 3.
3. Computational details
An exhaustive conformational search was carried out in the first step. The initial conformational geometries were generated by rotating selected bonds using the utility code ConfGen, which is included in the MSTor23,25,26 program. The geometry optimizations and the frequency calculations of all the reactants, products, and transition states for reactions (R1)–(R5) were performed using the M08-HX27/MG3S28 model chemistry. For C, H, and O atoms, the MG3S basis is equivalent to the 6-311+G(2df,2p) basis set.29–31 An integration grid of 974 angular points per shell and 99 radial shells was used in all the DFT calculations. All the electronic structure calculations were performed using Gaussian09 program32 with the MN-GFM6.4 (ref. 33) module. The conformational–rovibrational partition functions were computed with the MSTor program. The scale factor34 for M08-HX/MG3S electronic model chemistry is 0.973 and was used for computing the partition functions. This scale factor was determined in order to reduce the average error of zero point energy calculated using harmonic oscillator formulas.
Benchmark calculations were carried out in order to test and validate various density functionals for dynamic calculations. Various combinations of M08-HX, M08-SO,27 M06-2X35 density functionals with MG3S, jun-cc-pVTZ,36 jul-cc-pVTZ,37 maug-cc-pVTZ29 and aug-cc-pVTZ38 basis sets were used to compute the single-point energies based on M08-HX/MG3S geometries. Single-point energies calculated by the explicitly correlated electronic structure method CCSD(T)-F12a39,40 were chosen as the benchmark values. Three different basis sets, namely the orbital (AO) basis, the density fitting (DF) basis41 and the resolution of the identity (RI) basis,42 are required in F12 calculations. The basis set jun-cc-pVTZ was used as the orbital basis for constructing the molecular orbitals; the F12 integrals were evaluated using density fitting approximations with cc-pVTZ/MP2FIT basis;43 and the cc-pVTZ/JKFIT basis42 was chosen as the RI basis for approximating the many-electron integrals. All CCSD(T)-F12a calculations were performed by using the Molpro44 program.
The reaction paths were computed via direct dynamics and all the dynamics calculations were performed with the POLYRATE45 and GAUSSRATE46 programs. The electronic structure method, M08-HX/aug-cc-pVTZ, with the smallest mean unsigned error (MUE) in the validations discussed in section 4.3 was employed in all the dynamic calculations. For the dynamics calculations, all stationary-point geometries were re-optimized by M08-HX/aug-cc-pVTZ, and with this basis set a factor of 0.975 was used to scale the vibrational frequencies. The generalized normal mode analyses were performed using non-redundant internal coordinates. The tunneling transmission probabilities are computed using the small-curvature tunneling approximation. In the direct dynamics calculations, the minimum energy paths (MEPs) in isoinertial coordinates were computed by using the Euler steepest-descents (ESD) method with a step size of 0.005 bohr and the Hessian was updated at every 9th point along the path.
4. Results and discussion
4.1. Conformational search
We rotated all the torsional bonds except the methyl groups by 0, 120, and –120 degrees to generate various initial conformational structures. In the conformational search step, it is unnecessary to rotate a methyl group because no new structures will be generated due to the quantum mechanical indistinguishability of the three hydrogen atoms of the methyl group. However, the torsional potential anharmonicity of the methyl group is included in the computation of the partition functions. In general the number of structures found after the optimizations can be greater than, equal to, or less than 3t where t is the number of torsions; in the present study we found it is always is less than 3t.
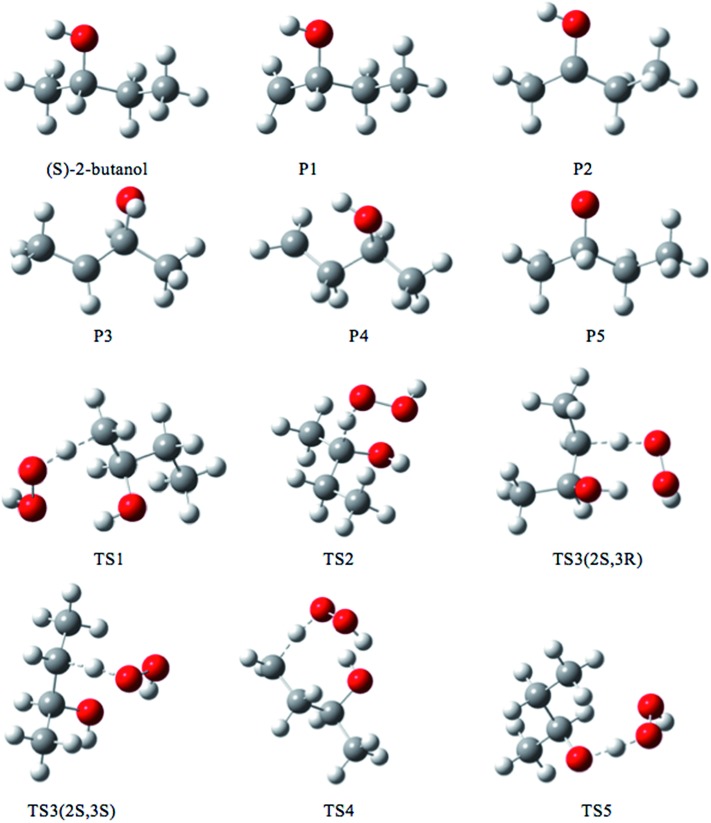
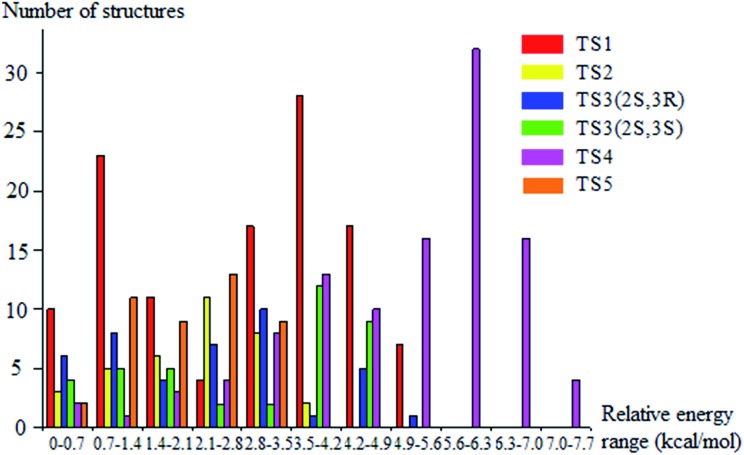
The lowest-energy structures for (S)-2-butanol, for the organic products, and for conventional transition states are shown in Fig. 3. Nine distinguishable structures were found for (S)-2-butanol. For products P1–P5, the numbers of distinguishable structures are 9, 12 (6 pairs of mirror images), 7, 9 and 3 respectively. Transition states TS1, TS2, TS3 (2S,3R), TS3 (2S,3S), TS4 and TS5 have 117, 35, 42, 39, 109 and 44 structures respectively. The numbers of distinguishable structures in each relative potential energy range for transition states TS1–TS5 are presented in Fig. 4. For each transition state, the zero of relative energy for the transition state structures is chosen as the energy of the global-minimum structure.
Fig. 3. Lowest-energy structures of (S)-2-butanol, products P1–P5 and transition structures TS1–TS5. Carbon, hydrogen and oxygen atoms are represented by grey, white, and red balls respectively.
Fig. 4. Number of distinguishable structures in each relative potential energy range for transition states TS1–TS5.
4.2. Multistructural torsional anharmonicity factors
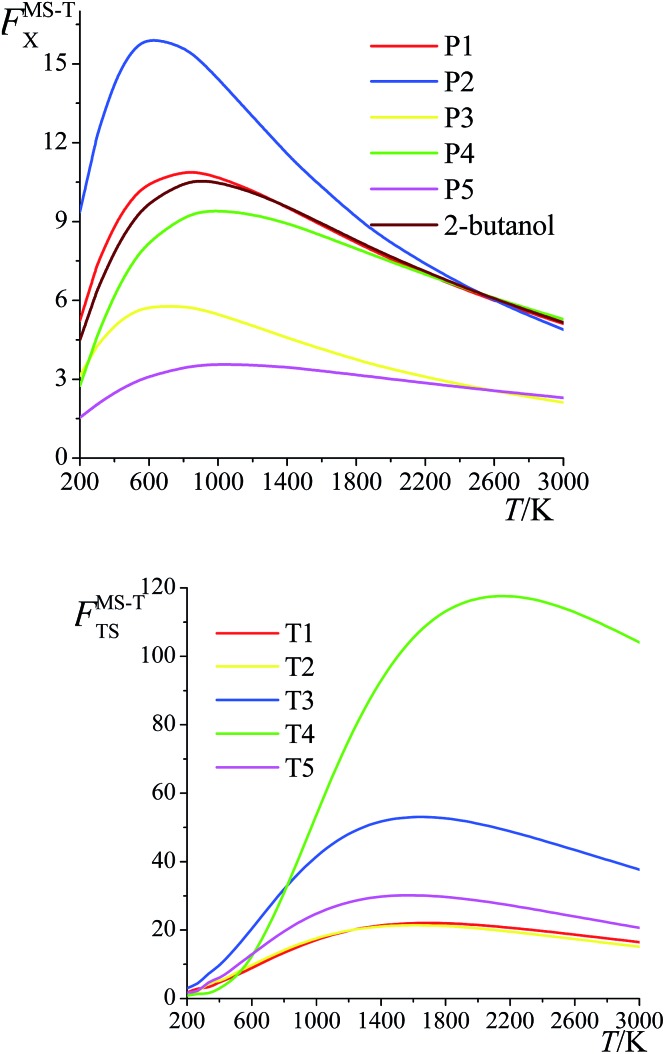
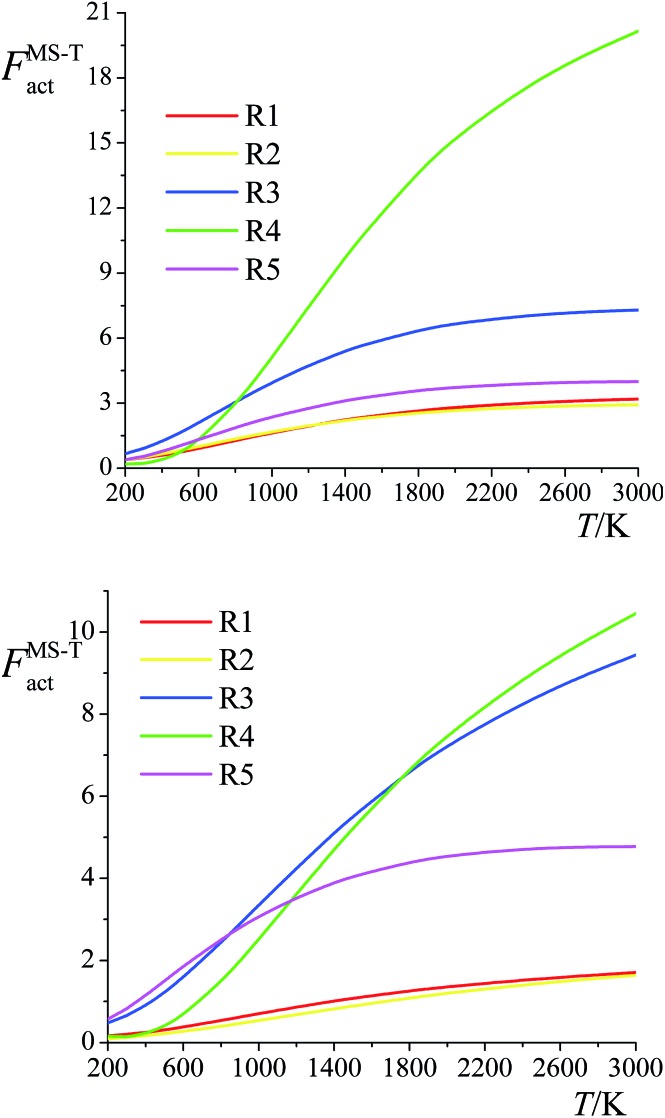
The ratio of the final conformational–rovibrational partition function to the quasiharmonic rovibrational partition function is called the multistructural torsional anharmonicity factor or FMS-TX. The computed multistructural torsional anharmonicity factors for reactants, transition states, and products are shown in Fig. 5 and tabulated in Table S1† (tables labeled with S are in the ESI†). Among the five transition states of reactions (R1)–(R5), the transition state of reaction (R4) has the largest multistructural torsional anharmonicity factors at 900–3000 K with a peak value of 116.8 at 2000 K. The multistructural torsional anharmonicity activation factors for forward and reverse reactions (R1)–(R5) are depicted in Fig. 6, which shows that they are quite substantial at high temperature.
Fig. 5. Multistructural torsional anharmonicity factors FMS-TX for: (top) (S)-2-butanol, products P1–P5; (bottom) transition states TS1–TS5.
Fig. 6. Multistructural torsional anharmonicity factors FMS-Tact for: (top) Forward reactions (R1)–(R5); (bottom) Reverse reactions (R1)–(R5).
The FMS-TX factor is not directly proportional to the number of distinguishable conformational structures, and it is interesting to notice that a large number of conformers for a species does not necessarily lead to a large value of FMS-TX factor. For instance, TS1 has 117 distinguishable conformers while TS2 only has 35 conformers, but their FMS-TX factors are very close to each other. From Table S1,† we see that TS1 has larger QMS-T than TS2 but smaller values of the rovibrational partition functions of the global minimum, which is caused by the higher values of the high-frequency vibrational modes.
4.3. Comparison of various DFT calculations with benchmark
Different basis sets were tested for various density functionals in order to choose the electronic structure method for dynamic calculations. The geometries of the lowest-energy structures calculated by the M08-HX exchange–correlation functional with the MG3S basis set are used in all the calculations. Reaction (R3) has two classes of transition states, namely (2S,3R) and (2S,3S). In Table 1, the structure with the lowest energy, which is in the (2S,3S) class, is used to calculate the barrier height. Table 1 shows the computed forward classical barrier height, reverse classical barrier height, and energy of reaction calculated by several different methods (additional methods are shown in Table S6 in ESI†). The calculations show that the order of the forward barrier height for reactions (R1)–(R5) is (R5) > (R1) > (R3) > (R4) > (R2), and this order of barrier heights plays an important role in determining the site dependence of the hydrogen abstraction kinetics of 2-butanol.
Table 1. Forward and reverse classical barrier heights and classical energies of reaction (kcal mol–1) for (R1)–(R5) a .
| Electronic model chemistry//M08-HX/MG3S | Forward barrier height V‡f |
Reverse barrier height V‡r |
Energy of reaction ΔE (kcal mol–1) |
MUE | MUE (w/o (R5)) | ||||||||||||
| (R1) | (R2) | (R3) | (R4) | (R5) | (R1) | (R2) | (R3) | (R4) | (R5) | (R1) | (R2) | (R3) | (R4) | (R5) | |||
| M08-HX/aug-cc-pVTZ | 20.89 | 12.09 | 17.66 | 17.61 | 22.07 | 4.46 | 4.64 | 4.37 | 2.83 | 2.23 | 16.44 | 7.45 | 13.28 | 14.78 | 19.84 | 0.22 | 0.21 |
| M08-SO/aug-cc-pVTZ | 21.92 | 13.10 | 18.56 | 18.39 | 21.94 | 5.06 | 5.19 | 5.35 | 3.00 | 1.41 | 16.86 | 7.90 | 13.20 | 15.39 | 20.52 | 0.66 | 0.70 |
| M06-2X/aug-cc-pVTZ | 19.02 | 10.61 | 15.87 | 15.71 | 19.83 | 3.11 | 3.36 | 3.20 | 1.40 | 0.43 | 15.90 | 7.25 | 12.67 | 14.31 | 19.40 | 1.14 | 1.11 |
| M08-HX/maug-cc-pVTZ | 21.06 | 12.34 | 17.84 | 17.94 | 22.29 | 4.61 | 4.81 | 4.50 | 3.09 | 2.38 | 16.45 | 7.52 | 13.34 | 14.85 | 19.90 | 0.29 | 0.26 |
| M08-HX/MG3S | 20.63 | 11.61 | 17.18 | 17.31 | 21.68 | 3.89 | 3.94 | 3.55 | 2.08 | 1.64 | 16.74 | 7.67 | 13.62 | 15.23 | 20.03 | 0.50 | 0.58 |
| CCSD(T)-F12a/jun-cc-pVTZ | 20.32 | 12.38 | 17.57 | 17.47 | 21.72 | 4.52 | 4.76 | 4.43 | 2.91 | 1.90 | 15.80 | 7.62 | 13.14 | 14.56 | 19.82 | 0.00 | 0.00 |
aFor consistent comparisons, the same set of geometries (those obtained by M08-HX/MG3S) is used throughout this table. The lowest-energy structures for reactants, conventional transition states, and products are employed. Mean unsigned errors (MUEs) are calculated with respect to the CCSD(T)-F12a/jun-cc-pVTZ method. Barrier heights and energies of reaction are classical, i.e., zero-point-energy exclusive.
The transition state of the oxygen-site abstraction reaction (R5) is a multi-reference system, and all the calculations carried out here are based on single-reference methods. The T1 diagnostic47 value of the lowest-energy structure of TS5 is 0.0928, which is considerably larger than the value of 0.045 that has been suggested as a criterion for multi-reference character in an open-shell molecule.48–52 However, since this reaction has the largest forward barrier height, it has the least contribution to the total reaction rate constant. Therefore, in this study, we are satisfied to use single-reference methods to estimate the barrier heights and energy of reaction for reaction (R5).
Mean unsigned errors (MUEs) are calculated with respect to the results obtained by the F12a explicitly correlated CCSD(T) electronic structure theory and are shown in Table 1 both including and excluding the least important reaction (R5). Based on these comparisons, we chose the M08-HX exchange–correlation functional with the aug-cc-pVTZ basis set to carry out the dynamics calculations.
4.4. Correlation between bond dissociation energy and barrier height
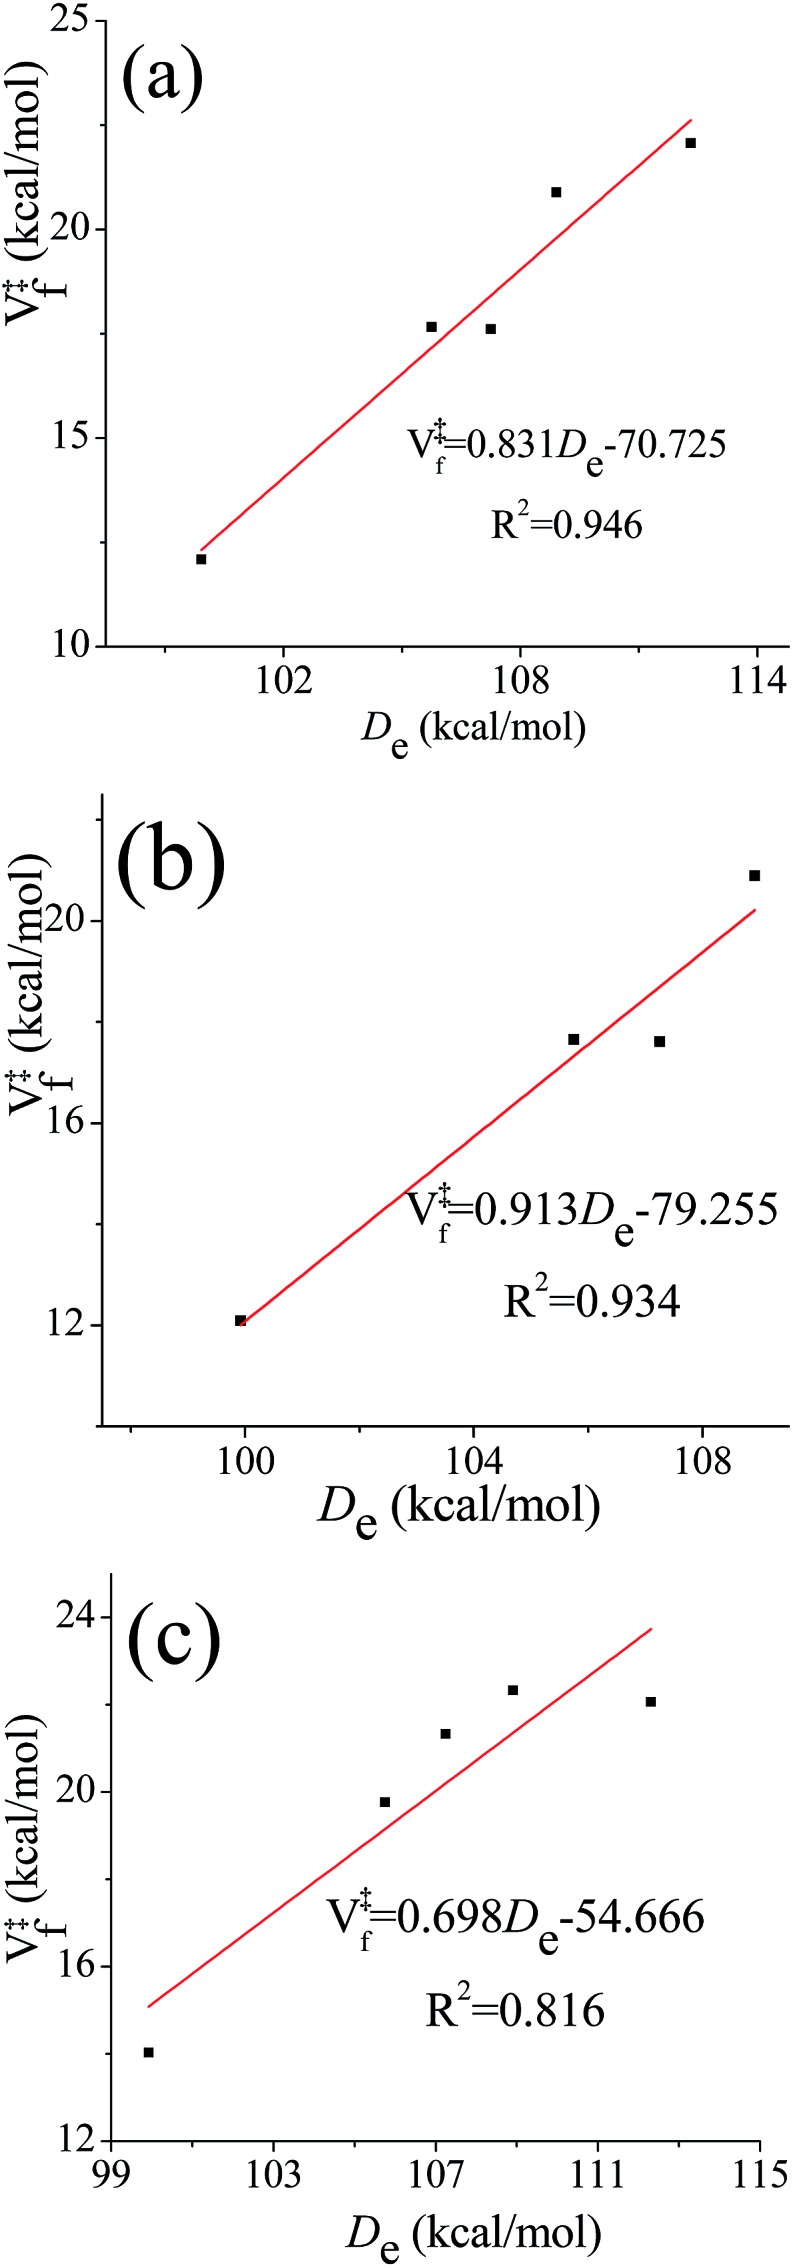
One frequently sees the assumption that barrier heights in a sequence of related reactions vary linearly with the energy of the bond being broken (higher barriers being associated with stronger bonds to be broken). This is reasonable when better estimates are not available, but one might wonder whether it holds in the present case where some of the transition state structures have hydrogen bonds whose energies might not correlate with the energy of breaking a bond. We therefore investigated the correlation between the equilibrium (i.e., classical) bond dissociation energy (De) of the chemical bond that is being broken during the reaction (C–H bond for (R1)–(R4), O–H bond for (R5)) and the classical barrier height for the forward reaction using the computational results obtained by M08-HX/aug-cc-pVTZ//M08-HX/MG3S. The transition structures that are used to examine the correlation relations fall into the following three categories: (a) the lowest-energy conformer; (b) the lowest-energy conformer with a hydrogen bond; and (c) the lowest-energy conformer without a hydrogen bond. The correlation diagrams are shown in Fig. 7. The values of the squared correlation coefficients, R2, indicate that the bond dissociation energy and the forward barrier heights are indeed correlated, although none of the R2 values exceeds 0.95. Curiously, there is a better correlation for transition states with hydrogen bonds than for those without them; and we have no explanation for this.
Fig. 7. Correlation diagrams between classical bond dissociation energy (De) and classical forward barrier heights (V‡f). Forward barrier heights are computed based on: (a) the lowest-energy transition structures; (b) the lowest-energy transition structures with a hydrogen bond; (c) the lowest-energy transition structures without a hydrogen bond.
4.5. Averaged generalized transmission coefficients
The tunneling transmission coefficients are computed using the small-curvature tunneling (SCT) approximation, and canonical variational theory (CVT) is applied to compute the recrossing transmission coefficients. The path-averaged generalized transmission coefficients for reaction (R1)–(R5) are listed in Table 2 (results for additional temperatures are in Table S7 in ESI†). The generalized transmission coefficient averaged over the first p paths, ordered by increasing values of the classical barrier height, is denoted as γp. For each reaction, the four lowest-energy reaction paths are included in the averaged generalized transmission coefficients because we found that the differences between stopping after the third reaction path and stopping after the fourth reaction path are smaller than 15%, which is the convergence criterion for the multi-path variational transition state theory (MP-VTST) calculations in the present work. The forward and the reverse reactions have the same values of the averaged generalized transmission coefficients.
Table 2. Averaged generalized transmission coefficients a of reaction (R1)–(R5) at various temperatures.
| T/K | (R1) |
(R2) |
(R3) |
(R4) |
(R5) |
||||||||||||||||
| γ1 | γ3 | γ4 | URE b (%) | γ1 | γ3 | γ4 | URE (%) | γ1 | γ3 | γ4 | URE (%) | γ1 | γ3 | γ4 | URE (%) | γ1 | γ3 |
γ4 |
URE (%) | ||
| 200 | 196.5 | 231.8 | 243.5 | 4.8 | 20.84 | 26.94 | 26.88 | 0.2 | 207.0 | 214.7 | 218.6 | 1.8 | 45.43 | 59.42 | 67.68 | 12.2 | 1.42 | 1.78 | 1.95 | 8.4 | |
| 300 | 17.04 | 18.37 | 18.95 | 3.0 | 3.74 | 4.12 | 4.08 | 1.0 | 17.09 | 17.20 | 17.32 | 0.7 | 7.99 | 9.56 | 10.55 | 9.3 | 1.18 | 1.35 | 1.44 | 5.8 | |
| 400 | 5.79 | 6.00 | 6.13 | 2.2 | 2.02 | 2.12 | 2.11 | 0.8 | 5.62 | 5.63 | 5.66 | 0.4 | 3.62 | 4.08 | 4.37 | 6.6 | 1.10 | 1.20 | 1.25 | 4.2 | |
| 600 | 2.33 | 2.35 | 2.38 | 1.5 | 1.27 | 1.32 | 1.31 | 0.9 | 2.19 | 2.21 | 2.23 | 0.6 | 1.80 | 1.91 | 1.98 | 3.6 | 1.04 | 1.08 | 1.10 | 2.4 | |
| 1000 | 1.36 | 1.35 | 1.37 | 1.2 | 0.73 | 0.90 | 0.87 | 3.3 | 1.23 | 1.27 | 1.29 | 1.1 | 1.16 | 1.17 | 1.18 | 1.5 | 1.01 | 1.01 | 1.02 | 1.5 | |
| 1500 | 1.13 | 1.11 | 1.13 | 1.4 | 0.54 | 0.69 | 0.66 | 3.6 | 0.98 | 1.04 | 1.06 | 1.8 | 0.96 | 0.95 | 0.95 | 0.9 | 1.00 | 0.98 | 0.99 | 1.3 | |
| 2400 | 1.03 | 0.98 | 1.01 | 2.4 | 0.42 | 0.54 | 0.53 | 3.3 | 0.79 | 0.89 | 0.92 | 3.3 | 0.80 | 0.79 | 0.78 | 0.6 | 1.00 | 0.96 | 0.97 | 1.4 | |
aGeneralized transmission coefficients averaged over the first p lowest-energy path(s) are denoted as γp.
bThe unsigned relative error (URE) is given by |γ4 – γ3|/γ4.
4.6. Torsional anharmonicity as a function of reaction coordinate
Here we examine whether it is necessary to include torsional anharmonicity as a function of the reaction coordinate for the reactions studied in this work. To do this, we compare the MS-VTST to MS(full)-VTST, where the notation (originally explained in Section 2.4) is that MS-VTST denotes approximating the multistructural anharmonicity factors based on calculating them only at stationary points, and MS(full)-VTST denotes also calculating them along the reaction path.
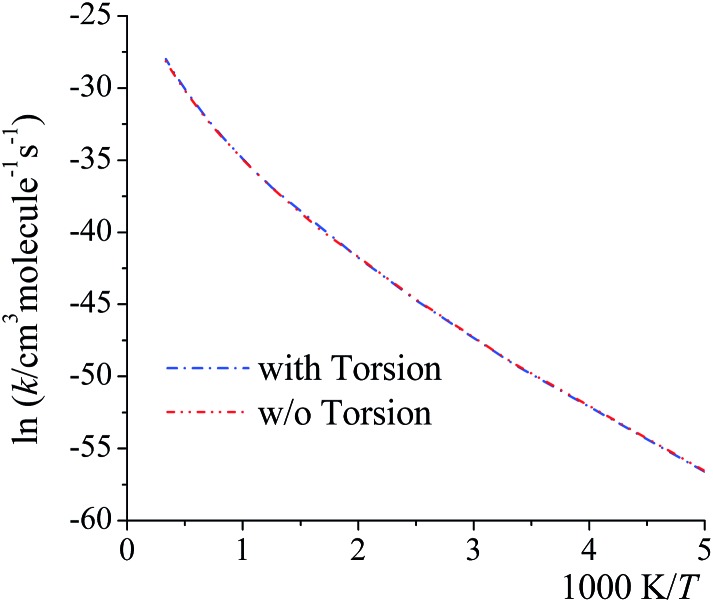
The reaction we considered for this test is reaction (R2), which has the largest contribution to the total reaction rate constant from 200 K to 2400 K; and the multistructural CVT/SCT rate constants are computed based on reaction path 1 (the lowest-energy path). As shown in Fig. 8, the differences between the MS-CVT/SCT and MS(full)-CVT/SCT rate constants are negligible at all temperatures (from 200 K to 3000 K). This result can be understood as follows. For path 1 of reaction (R2), the locations of the variational transition states determined by eqn (6) are –0.021 Å at 200 K, –0.022 Å at 298 K, and –0.21 Å at 1000 K respectively; and the locations determined by eqn (11) at these temperatures are –0.023 Å, –0.026 Å, and –0.22 Å respectively. We can see that the locations are all close to the saddle point (which is defined as s = 0), and the key point is that the multistructural anharmonicity does not differ much at the variational transition state and at the conventional TS. For other reaction paths, we also found that the locations of the variational transition state are all close to the saddle points (see Table S9 in ESI†). Therefore, including the torsional anharmonicity only at the saddle point is a good approximation.
Fig. 8. MS-CVT/SCT (denoted as “w/o Torsion” in the figure) and MS(full)–CVT/SCT (denoted as “with Torsion” in the figure) rate constant of reaction (R2), path1 computed with/without treating torsional anharmonicity as a function of reaction coordinate s at various temperatures.
Thus, for the rate constants reported in the rest of the paper, the torsional anharmonicity is only included at the stationary points.
4.7. Total rate constants
The calculated multi-path and multistructural rate constants for the forward and reverse reactions of (R1)–(R5) are listed to three significant figures for many temperatures in Tables S2 and S3;† a subset of the multi-path forward rate constants is given in Table 3. The reverse rate constants satisfy the principle of detailed balance, which requires that the reverse rate constant is equal to the ratio of the forward reaction rate constant to the chemical equilibrium constant of the reaction.53 The averaged relative differences between the multi-path and multi-structural results are 18% for the overall forward reaction rate constants and 17% for the overall reverse reaction rate constants.
Table 3. MP-CVTS/SCT rate constants (cm3 molecule–1 s–1) for forward reactions (R1)–(R5) and overall reaction at various temperatures (K).
| T/K | (R1) | (R2) | (R3) | (R4) | (R5) | Overall |
| 200 | 2.00 × 10⁻³³ | 1.76 × 10⁻²⁵ | 4.09 × 10⁻³⁰ | 8.42 × 10⁻³² | 4.42 × 10–36 | 1.76 × 10⁻²⁵ |
| 300 | 1.66 × 10⁻²⁷ | 2.78 × 10⁻²² | 2.54 × 10⁻²⁵ | 9.68 × 10⁻²⁷ | 5.93 × 10⁻²⁹ | 2.78 × 10⁻²² |
| 400 | 2.48 × 10⁻²⁴ | 2.13 × 10⁻²⁰ | 1.09 × 10⁻²² | 6.72 × 10⁻²⁴ | 3.28 × 10⁻²⁵ | 2.14 × 10⁻²⁰ |
| 600 | 8.21 × 10⁻²¹ | 3.44 × 10⁻¹⁸ | 1.06 × 10⁻¹⁹ | 1.47 × 10⁻²⁰ | 3.25 × 10⁻²¹ | 3.57 × 10⁻¹⁸ |
| 1000 | 1.72 × 10⁻¹⁷ | 4.68 × 10⁻¹⁶ | 7.99 × 10⁻¹⁷ | 2.36 × 10⁻¹⁷ | 1.19 × 10⁻¹⁷ | 6.01 × 10⁻¹⁶ |
| 1500 | 1.62 × 10⁻¹⁵ | 9.25 × 10⁻¹⁵ | 4.34 × 10⁻¹⁵ | 1.79 × 10⁻¹⁵ | 1.32 × 10⁻¹⁵ | 1.83 × 10⁻¹⁴ |
| 2400 | 9.07 × 10⁻¹⁴ | 1.45 × 10⁻¹³ | 1.49 × 10⁻¹³ | 7.57 × 10⁻¹⁴ | 7.87 × 10⁻¹⁴ | 5.40 × 10⁻¹³ |
The product of the reverse reaction of (R2), P2, has no chiral carbon. However, the H2O2 molecule can attack P2 from two different sides (top and bottom) and this leads to two possible products, (R)-2-butanol and (S)-2-butanol. In order to be consistent with the reactions we considered in this work as listed in the introduction, the reverse rate constants reported in Table S3† are based solely on (S)-2-butanol. If one wants to compute the reverse rate constants of (R2), which leads to both (R)- and (S)-2-butanol, one should multiply the rate constant we reported here by a factor of 2.
The MP-VTST rate constants for the forward reactions are fitted by the following equation54
 |
12 |
where A, n, E (kcal mol–1), T0 (K) are the four fitting parameters and R is the ideal gas constant (R = 1.9872 × 10⁻³ kcal mol–1 K–1). For the exoergic reverse reactions, a more physically meaningful fitting equation17,55 as follows is applied,
 |
13 |
which yields a nonzero rate constant at 0 K. The fitting parameters are tabulated in Table 4.
Table 4. Fitting parameters for forward and reverse reactions (R1)–(R5) a .
| Forward reactions
b
|
Reverse reactions
c
|
|||||||
| ln A | n | T 0 | E | ln A | n | T 0 | E | |
| (R1) | –39.1738 | 5.5754 | 104.563 | 11.230 | –38.0230 | 3.8710 | 527.398 | 3.305 |
| (R2) | –36.4351 | 4.0045 | 139.974 | 6.581 | –39.8651 | 3.9670 | 303.680 | 2.459 |
| (R3) | –38.0966 | 5.0931 | 117.587 | 9.240 | –37.9467 | 3.7753 | 490.295 | 3.544 |
| (R4) | –38.3831 | 5.0739 | 138.408 | 10.766 | –31.7528 | 1.4836 | 576.178 | 7.653 |
| (R5) | –37.3145 | 4.8844 | 91.719 | 13.875 | –34.0876 | 3.3045 | 483.334 | 2.014 |
| Overall | –38.8559 | 5.6479 | 120.623 | 5.351 | –34.1251 | 3.3873 | 493.788 | 2.101 |
aRate constants are in the unit of cm3 molecule–1 s–1, the parameters T0 and E are in the unit of K, kcal mol–1 respectively.
bForward reaction rate constants are fitted using eqn (12).
cReverse reaction rate constants are fitted using eqn (13).
4.8. Effects of hydrogen bonding on thermodynamic functions and rate constants
We classified the structures of reactants and transition states involved in the hydrogen abstraction reaction of (S)-2-butanol by HO2 radical by considering the presence of hydrogen bonds. For this purpose we used the criteria enunciated by Chen et al.56 to carried out the hydrogen bond analysis. According to these criteria, a normal hydrogen bond occurs for O–H···O interactions (where O is neutral) that have R(H···O) less than or equal to 2.4 Å and that have the O–H–O angle θ greater than or equal to 150°; and a strongly bent hydrogen bond occurs when R(H···O) ≤ 2.4 Å and 90 < θ < 150°. If all other factors were equal, structures that have hydrogen bonds would be lower in energy, and Fig. 9 shows that this expectation is met in the present cases.
Fig. 9. Relative potential energy (in kcal mol–1) of all the optimized structures for (S)-2-butanol and of transition structures of the hydrogen abstraction reactions (R1)–(R5). Green triangles correspond to structures that do not have hydrogen bond; blue squares are structures with a strongly bent hydrogen bond, and red circles are structures with a normal hydrogen bond, as defined in Section 4.8.

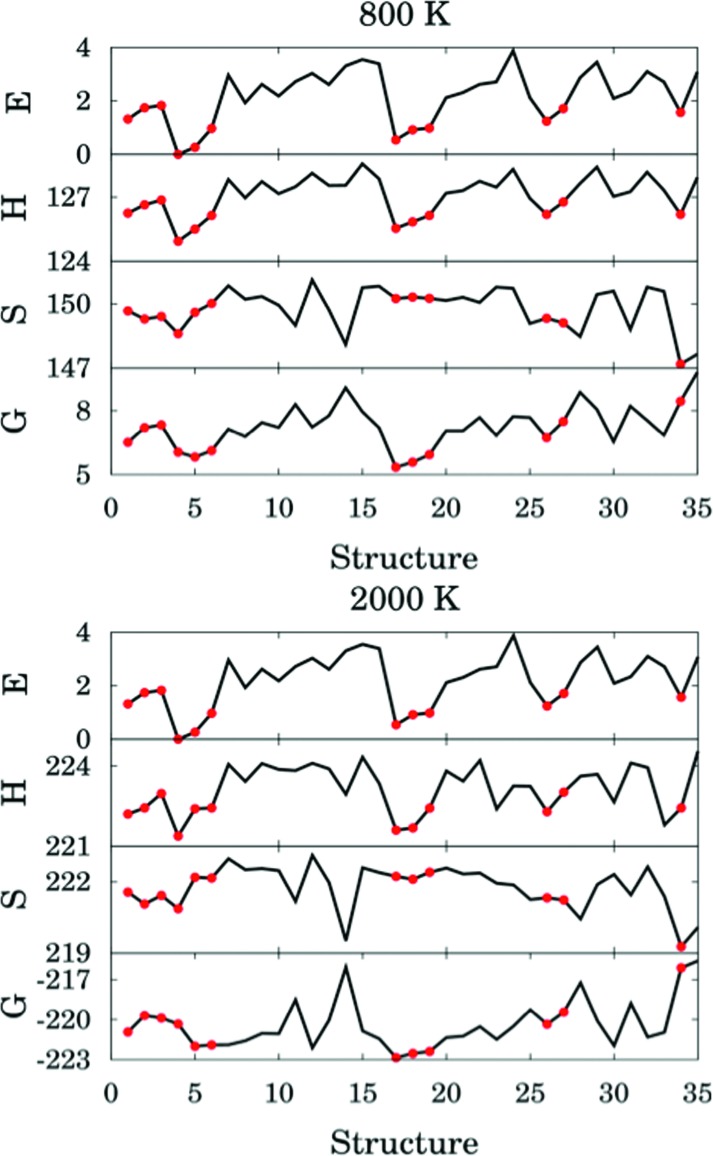
The thermal rate constant is related to the quasiclassical standard-state generalized free energy of activation at the variational transition state (ΔGCVT,oact): the higher ΔGCVT,oact is, the lower the rate constant. Because we've shown that the positions of GT are close to the saddle points in the cases studied here, the quasiclassical standard-state generalized free energy of activation is approximately the quasiclassical free energy difference between the saddle point and the reactants. Fig. 10 shows the computed quasiclassical standard-state free energies, enthalpies and entropies at 800 K and 2000 K for all the transition structures of (R2).
Fig. 10. Relative energy (in kcal mol–1), standard enthalpy (in kcal mol–1), entropy (in cal K–1 mol–1) and quasiclassical free energy (in kcal mol–1) for all the transition structures of reaction (R2) at 800 and 2000 K. Red circles correspond to hydrogen–bonded structures.
Fig. 10 shows that an H-bonded transition structure with lower energy or enthalpy (for instance, structure 4 in Fig. 10) is not necessarily lower in free energy than non-H-bonded structures; this is because the presence of the hydrogen bond can also reduce the entropy. The H-bonded structure 34 is energetically lower than all of the non-H-bonded structures, however its free energy is even higher than most of the non-H-bonded conformers, and therefore it contributes significantly less than other structures to the thermal rate constants. Therefore, we conclude here that a hydrogen-bonded transition structure does not necessarily contribute significantly to the thermal rate constants.
Many authors (we give only a couple of examples57,58) have emphasized how a hydrogen bond can stabilize transition structures, and sometimes it is assumed that the stronger the interaction is, the lower the barrier and the faster the reaction. However, the results presented here show that basing such conclusions solely based on the energetic effects of the hydrogen bond not the entropic effects is not reliable. We have shown a hydrogen bond can reduce the entropy and thereby increase the free energy of the transition state. Hence, a strong hydrogen bond interaction may lead to a slower reaction rate; reliable conclusions must be based on free energies of activation, not barrier heights or enthalpies of activation.
4.9. Temperature-dependence of activation energy
Activation energies for forward reactions (R1)–(R5) and the overall reaction are computed using eqn (12) and (13) and Table 4 with the following definition of Arrhenius activation energy:
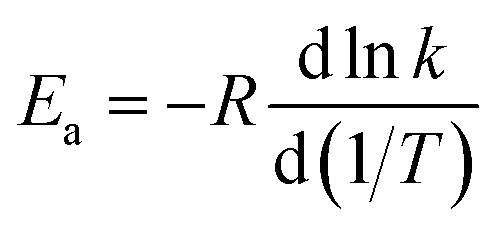 |
14 |
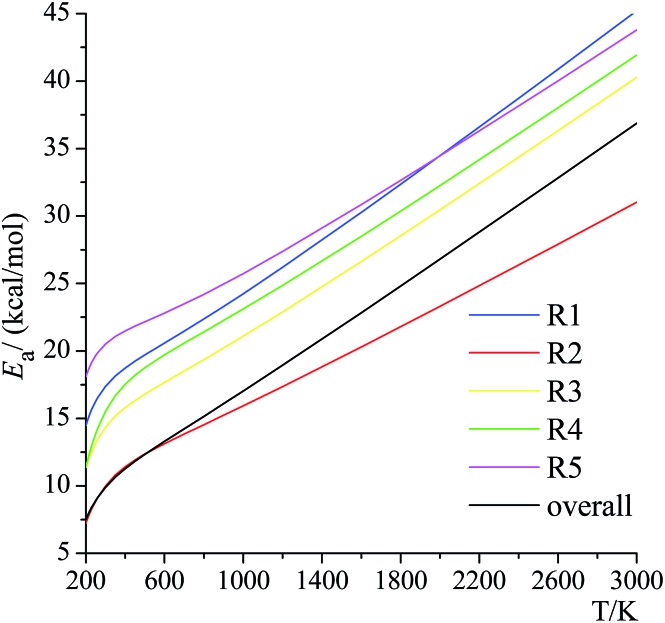
where Ea is the activation energy (kcal mol–1), k is the rate constant at temperature T, and R is the gas constant. The activation energies at various temperatures for the forward reactions (R1)–(R5) are plotted in Fig. 11. As we can see from Fig. 11, activation energy increases dramatically as the temperature rises, and the difference of the activation energies between 298.15 K and 3000 K is not negligible (increases in activation energy of 27.9, 21.1, 26.0, 26.4, 23.3, 27.0 kcal mol–1 for (R1)–(R5) and the overall reaction, respectively). For instance, the activation energy of (R1) is lower than (R5) below 2000 K but is higher than (R5) above 2000 K. Masgrau et al. have discussed that,59 even without considering the quantum mechanical tunneling and variational effects, the activation energy is not a constant due to the temperature dependence of the vibrational contributions from the transition structures. This is also known from earlier work,3,4,16,54,55,60 where the temperature dependence comes from both the conformational–vibrational–rotational partition function and also from tunneling. In our present calculations, because of the importance of quantum mechanical tunneling at lower temperatures, the Eavs. 1/T curve has a noticeable change in slope at around 400 K, which indicates that at lower temperature than this, the activation energy is being further decreased by tunneling.
Fig. 11. Activation energies for the forward reactions (R1)–(R5) and the overall reaction.
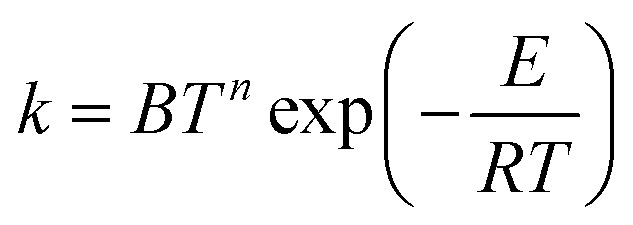
The temperature dependence of the activation energy is sometimes ignored in the empirical estimations of the rate constants,61 which is a convenient and reasonable choice for modeling a small range of temperatures, but this may cause significant errors over a wide range of temperatures, especially if one adopts the activation energy measured at a lower temperature to estimate the rate constant at very high temperatures in combustion chemistry or if one uses higher-temperature measurements of rate constants (where they are large enough to be measured) to estimate rate constants at 200–300 K for atmospheric applications.
The formula usually used for fitting rate constants when the temperature dependence of the activation energy is taken into account is:
 |
15 |
where B, n and E are three fitting parameters, T is temperature and R is gas constant. This fitting expression leads to an activation energy linearly dependent on temperature:
| Ea = E + nRT | 16 |
However, we have found that this linear dependence is not observed in all cases, even at high temperature. Interestingly though, Fig. 10 shows a nearly linear behavior for T > 600 K, but eqn (16) is inapplicable at lower temperatures.
Activation energies of reactions are sometimes estimated using Evans–Polanyi-type correlations based on bond dissociation energies.15,62 This approach not only ignores the temperature dependence of the activation energies but also assumes a perfect correlation between the barriers and bond dissociation energies. The computational accuracy is sacrificed in such an approach in order to achieve efficiency for estimating rate constants for a large number of elementary reactions proposed63,64 in combustion modeling.
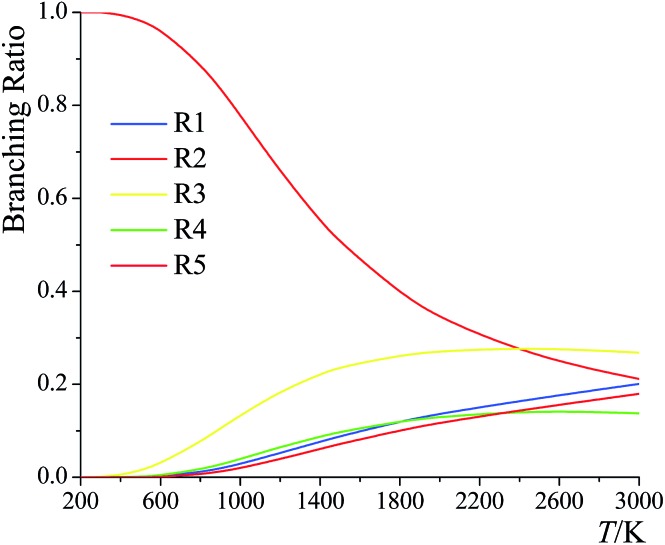
4.10. Branching ratios
The branching ratios for the forward reactions (R1)–(R5) are shown in Fig. 12. The branching ratio is calculated as the ratio of the multi-path rate constant of the given reaction to the overall multi-path reaction rate constant.
Fig. 12. Branching ratios of forward reactions (R1)–(R5) at various temperatures.
Below 2400 K, the order of the contributions from reactions (R1)–(R5) to the total reaction rate constant is (R2) > (R3) > (R1) > (R5) > (R4); above 2400 K, the order is (R3) > (R2) > (R1) > (R5) > (R4). The computed forward reaction rate constants indicate that hydrogen abstraction from the C-2 site has the largest contribution to the overall reaction from 200 K to 2400 K, with a contribution ranging from 99.9988% at 200 K to 88.9% at 800 K to 21.2% at 3000 K, while hydrogen abstraction from the oxygen-site makes the lowest contribution at all temperatures, ranging from 2.5 × 10⁻⁹% at 200 K to 0.65% at 800 K to 18% at 3000 K.
We also computed the branching ratios using multistructural CVT/SCT, and the relative errors with respect to the multi-path CVT/SCT branching ratios have been listed in Table 5. The relative error can be up to ∼50% at 3000 K for (R1) and for (R3)–(R5). We conclude that if one evaluates the rate constants without taking the multi-path effects into consideration, one cannot predict the branching ratios with high accuracy.
Table 5. Relative errors (%) of the computed MS-CVT/SCT branching ratios at various temperatures with respect to MP-CVT/SCT results.
| T/K | (R1) | (R2) | (R3) | (R4) | (R5) |
| 200 | 3 | 0.00 | 21 | –14 | –41 |
| 300 | –1 | 0.00 | 7 | –17 | –34 |
| 400 | –0.5 | –0.03 | 4 | –13 | –26 |
| 600 | 29 | –1 | 27 | –19 | –7 |
| 1000 | 31 | –6 | 19 | 22 | 19 |
| 1500 | 22 | –11 | 3 | 12 | 16 |
| 2400 | 21 | –13 | –13 | 4 | 18 |
5. Conclusions
In this work, we extended multi-path variational transition state theory to chiral reactants, and we applied it with the small-curvature tunneling approximation to predict the rate constants of the hydrogen abstraction by HO2 radical from the various sites of 2-butanol. This molecule has a chiral carbon, and hence we developed a strategy for computing the local periodicity (needed for the torsional anharmonicity calculations) by using the Voronoi tessellation method and conformational rovibrational partition functions that differs from the methods used for non-chiral molecules in previous works.
The convergence criterion we set for the multi-path variational transition state theory (MP-VTST) calculations in this work is that we add reaction paths, in order of increasing saddle point energy, until the difference in averaged generalized transmission coefficients upon adding one more reaction path is less than 15%. With this criterion, the calculations on all the five reactions are converged with the four lowest-energy paths for each case. We also found that for the present reactions it is unnecessary to include the torsional anharmonicity as a function of reaction coordinate s.
We found that the decreasing order of the forward barrier heights is (R5) > (R1) > (R3) > (R4) > (R2). The calculations yield the site dependence of the reaction rates, which is difficult to obtain experimentally. The predicted forward reaction rate constants and the branching ratios illustrate that the overall reaction rate constants are mainly contributed by the hydrogen abstraction from the C-2 site below 2400 K and by the hydrogen abstraction from the C-3 site above 2400 K, while the hydrogen abstraction from the oxygen site contributes the least.
Hydrogen-bonded structures are very common in chemical reactions, and one might think that hydrogen-bonded transition structures, because of their generally lower energy, would accelerate the reaction rate. In the current work, we investigated the role played by hydrogen-bonded transition structures and concluded that a hydrogen-bonded transition structure does not necessarily contribute significantly to the thermal rate constants due to enthalpy–entropy compensation. This interesting result corrects a false impression that – if used in estimating rate constants for mechanisms – can lead to errors in rate constants; its consequences are very broad, extending beyond combustion chemistry to fundamental kinetics modeling in general.
The temperature dependence of the activation energies is very dramatic, for example, the activation energy of reaction (R4) increases from 11.4 kcal mol–1 at 200 K to 19.7 kcal mol–1 at 600 K to 36.1 kcal mol–1 at 2400 K. We also found that this dependence is not linear, and this reinforces recent suggestions that eqn (15) is an inadequate representation of the temperature dependence of rate constants.
Supplementary Material
Acknowledgments
We are grateful for helpful discussions and valuable suggestions provided by Dr Jingjing Zheng. This work was supported in part by the U. S. Department of Energy, Office of Basic Energy Sciences, under grant no. DE-FG02-86ER13579.
Footnotes
†Electronic supplementary information (ESI) available. See DOI: 10.1039/c5sc01848j
References
- Seal P., Oyedepo G., Truhlar D. G. J. Phys. Chem. A. 2013;117:275–282. doi: 10.1021/jp310910f. [DOI] [PubMed] [Google Scholar]
- Seal P., Papajak E., Truhlar D. G. J. Phys. Chem. Lett. 2012;3:264–271. doi: 10.1021/jz201546e. [DOI] [PubMed] [Google Scholar]
- Xu X., Yu T., Papajak E., Truhlar D. G. J. Phys. Chem. A. 2012;116:10480–10487. doi: 10.1021/jp307504p. [DOI] [PubMed] [Google Scholar]
- Yu T., Zheng J., Truhlar D. G. Chem. Sci. 2011;2:2199–2213. [Google Scholar]
- Garrett B. C., Truhlar D. G. J. Chem. Phys. 1979;70:1593–1598. [Google Scholar]
- Garrett B. C., Truhlar D. G. Acc. Chem. Res. 1980;13:440–448. [Google Scholar]
- Truhlar D. G., Isaacson A. D. and Garrett B. C., in Theory of Chemical Reaction Dynamics, ed. M. Baer, CRC Press, Boca Raton, 1985, pp. 65–137. [Google Scholar]
- Pang G. A., Hanson R. K., Golden D. M., Bowman C. T. J. Phys. Chem. A. 2012;116:4720. doi: 10.1021/jp302719j. [DOI] [PubMed] [Google Scholar]
- Vasu S. S., Davidson D. F., Hanson R. K., Golden D. M. Chem. Phys. Lett. 2010;497:26–29. [Google Scholar]
- Yujing M., Mellouki A. Chem. Phys. Lett. 2001;333:63–68. [Google Scholar]
- Christensen E., Yanowitz J., Ratcliff M., McCormick R. L. Energy Fuels. 2011;25:4723–4733. [Google Scholar]
- Pang G. A., Hanson R. K., Golden D. M., Bowman C. T. J. Phys. Chem. A. 2012;116:9607–9613. doi: 10.1021/jp306977e. [DOI] [PubMed] [Google Scholar]
- Yasunaga K., Mikajiri T., Sarathy S. M., Koika T., Gillespie F., Nagy T., Simmie J. M., Curran H. J. Combust. Flame. 2012;159:2009–2027. [Google Scholar]
- Sarathy S. M., Vranckx S., Yasunaga K., Mehl M., Obwald P., Metcalfe W. K., Westbrook C. K., Pitz W. J., Kohse-Hoinghaus K., Fernandes R. X., Curran H. J. Combust. Flame. 2012;159:2028–2055. [Google Scholar]
- Carstensen H.-H., Dean A. M., Deutschmann O. Proc. Combust. Inst. 2007;31:149–157. [Google Scholar]
- Yu T., Zheng J., Truhlar D. G. J. Phys. Chem. A. 2012;116:297–308. doi: 10.1021/jp209146b. [DOI] [PubMed] [Google Scholar]
- Zheng J., Truhlar D. G. Faraday Discuss. 2012;157:59–88. doi: 10.1039/c2fd20012k. [DOI] [PubMed] [Google Scholar]
- Liu Y. P., Lynch G. C., Truong T. N., Lu D.-H., Truhlar D. G. J. Am. Chem. Soc. 1993;115:2408–2415. [Google Scholar]
- Dybala-Defraytyka A., Paneth P. and Truhlar D. G., in Quantum Tunneling in Enzyme-Catalyzed Reactions, ed. R. K. Allemann and N. S. Scrutton, RSC Publishing, Cambridge, 2009, pp. 36–78. [Google Scholar]
- Hu W.-P., Truhlar D. G. J. Am. Chem. Soc. 1995;117:10726–10734. [Google Scholar]
- Zheng J., Truhlar D. G. J. Chem. Theory Comput. 2013;9:1356–1367. doi: 10.1021/ct3010722. [DOI] [PubMed] [Google Scholar]
- Zheng J., Yu T., Papajak E., Alecu I. M., Mielke S. L., Truhlar D. G. Phys. Chem. Chem. Phys. 2011;13:10885–10907. doi: 10.1039/c0cp02644a. [DOI] [PubMed] [Google Scholar]
- Zheng J., Mielke S. L., Clarkson K. L., Truhlar D. G. Comput. Phys. Commun. 2012;183:1803–1812. [Google Scholar]
- Zheng J., Truhlar D. G. J. Chem. Theory Comput. 2013;9:2875–2881. doi: 10.1021/ct400231q. [DOI] [PubMed] [Google Scholar]
- Zheng J., Meana-Pañeda R., Truhlar D. G. Comput. Phys. Commun. 2013;184:2032–2033. [Google Scholar]
- Zheng J., Mielke S. L., Clarkson K. L. and Truhlar D. G., MSTor computer program, version 2011, University of Minnesota, Minneapolis, MN, 2011.
- Zhao Y., Truhlar D. G. J. Chem. Theory Comput. 2008;4:1849–1868. doi: 10.1021/ct800246v. [DOI] [PubMed] [Google Scholar]
- Lynch B. J., Zhao Y., Truhlar D. G. J. Phys. Chem. A. 2003;107:1384–1388. [Google Scholar]
- Krishnan R., Binkley J. S., Seeger R., Pople J. J. Chem. Phys. 1980;72:650–654. [Google Scholar]
- Clark T., Chandrasekhar J., Spitznagel G. W., Schleyer P. J. Comput. Chem. 1983;4:294–301. [Google Scholar]
- Frisch M. J., Pople J. A., Binkley J. S. J. Chem. Phys. 1984;80:3265–3269. [Google Scholar]
- Frisch M. J., Trucks G. W., Schlegel H. B., Scuseria G. E., Robb M. A., Cheeseman J. R., Scalmani G., Barone V., Mennucci B., Petersson G. A., Nakatsuji H., Caricato M., Li X., Hratchian H. P., Izmaylov A. F., Bloino J., Zheng G., Sonnenberg J. L., Hada M., Ehara M., Toyota K., Fukuda R., Hasegawa J., Ishida M., Nakajima T., Honda Y., Kitao O., Nakai H., Vreven T., Montgomery Jr J. A., Peralta J. E., Ogliaro F., Bearpark M., Heyd J. J., Brothers E., Kudin K. N., Staroverov V. N., Kobayashi R., Normand J., Raghavachari K., Rendell A., Burant J. C., Iyengar S. S., Tomasi J., Cossi M., Rega N., Millam J. M., Klene M., Knox J. E., Cross J. B., Bakken V., Adamo C., Jaramillo J., Gomperts R., Stratmann R. E., Yazyev O., Austin A. J., Cammi R., Pomelli C., Ochterski J., Martin R. L., Morokuma K., Zakrzewski V. G., Voth G. A., Salvador P., Dannenberg J. J., Dapprich S., Daniels A. D., Farkas O., Foresman J. B., Ortiz J. V., Cioslowski J. and Fox D. J., GAUSSIAN 09 (Revision D. 01), Gaussian, Inc, Wallingford, CT, 2009.
- Zhao Y., Peverati R., Yang K. and Truhlar D. G., MN-GFM version 5.2 computer program module, University of Minnesota, Minneapolis, 2011.
- Alecu I. M., Zheng J., Zhao Y., Truhlar D. G. J. Chem. Theory Comput. 2010;6:2872–2887. doi: 10.1021/ct100326h. [DOI] [PubMed] [Google Scholar]
- Zhao Y., Truhlar D. G. Theor. Chem. Acc. 2008;120:215–241. [Google Scholar]
- Papajak E., Truhlar D. G. J. Chem. Phys. 2012;137:064110. doi: 10.1063/1.4738980. [DOI] [PubMed] [Google Scholar]
- Papajak E., Truhlar D. G. J. Chem. Theory Comput. 2010;6:597–601. doi: 10.1021/ct900566x. [DOI] [PubMed] [Google Scholar]
- Dunning T. H. J. Chem. Phys. 1989;90:1007–1023. [Google Scholar]
- Adler T. B., Knizia G., Werner H. J. J. Chem. Phys. 2007;127:221106. doi: 10.1063/1.2817618. [DOI] [PubMed] [Google Scholar]
- Knizia G., Adler T. B., Werner H. J. J. Chem. Phys. 2009;130:054104. doi: 10.1063/1.3054300. [DOI] [PubMed] [Google Scholar]
- Manby F. R. J. Chem. Phys. 2003;119:4607. [Google Scholar]
- Weigend F., Ahlrichs R. Phys. Chem. Chem. Phys. 2005;7:3297. doi: 10.1039/b508541a. [DOI] [PubMed] [Google Scholar]
- Weigend F., Kohn A., Hattig C. J. Chem. Phys. 2002;116:3175–3183. [Google Scholar]
- Werner H.-J., Knowles P. J., Manby F. R., Sch€utz M., Celani P., Knizia G., Korona T., Lindh R., Mitrushenkov A., Rauhut G., Adler T. B., Amos R. D., Bernhardsson A., Berning A., Cooper D. L., Deegan M. J. O., Dobbyn A. J., Eckert F., Goll E., Hampel C., Hesselmann A., Hetzer G., Hrenar T., Jansen G., Köppl C., Liu Y., Lloyd A. W., Mata R. A., May A. J., McNicholas S. J., Meyer W., Mura M. E., Nicklaß A., Palmieri P., Pflüger K., Pitzer R., Reiher M., Shiozaki T., Stoll H., Stone A. J., Tarroni R., Thorsteinsson T., Wang M. and Wolf A., MOLPRO, version 2012.1, University of Birmingham, Birmingham, 2012.
- Zheng J., Zhang S., Lynch B. J., Corchado J. C., Chuang Y.-Y., Fast P. L., Hu W.-P., Liu Y.-P., Lynch G. C., Nguyen K. A., Jackels C. F., Ramos A. F., Ellingson B. A., Melissas V. S., Villà J., Rossi I., Coitiño E. L., Pu J., Albu T. V., Steckler R., Garrett B. C., Isaacson A. D. and Truhlar D. G., POLYRATE, version 2010-A, University of Minnesota, Minneapolis, 2010.
- Zheng J., Zhang S., Corchado J. C., Chuang Y. Y., Coitiño E. L., Ellingson B. A. and Truhlar D. G., GAUSSRATE, version 2009-A, University of Minnesota, Minneapolis, 2010.
- Lee T. J., Taylor P. R. Int. J. Quantum Chem. 1989;(S23):199. [Google Scholar]
- Rienstra-Kiracofe J. C., Allen W. D., Schaefer H. F. J. Phys. Chem. A. 2000;104:9823. [Google Scholar]
- Martinez-Avila M., Peiro-Garcia J. J. Phys. Chem. Solids, Lett. Sect. 2003;370:313. [Google Scholar]
- Peiro-Garcia J., Nebot-Gil I. ChemPhysChem. 2003;4:843. doi: 10.1002/cphc.200300654. [DOI] [PubMed] [Google Scholar]
- Lambert N., Kaltsoyannis N., Price S. D., Zabka J., Herman Z. J. Phys. Chem. A. 2006;110:2898. doi: 10.1021/jp052981d. [DOI] [PubMed] [Google Scholar]
- Miller S. R., Schultz N. E., Truhlar D. G., Leopold D. G. J. Chem. Phys. 2009;130:024304. doi: 10.1063/1.3008056. [DOI] [PubMed] [Google Scholar]
- (a) Benson S. W., Thermochemical Kinetics, Wiley, New York, 1968, pp. 3–6. [Google Scholar]; (b) Mahan B. H., University Chemistry, 3rd edn, Addison-Wesley, Reading, 1975, pp. 385–387. [Google Scholar]
- Zheng J., Truhlar D. G. Phys.Chem. Chem. Phys. 2010;12:7782–7793. doi: 10.1039/b927504e. [DOI] [PubMed] [Google Scholar]
- Zheng J., Seal P., Truhlar D. G. Chem. Sci. 2013;4:200–212. [Google Scholar]
- Chen C., Li W. Z., Song Y. C., Yang J. J. Mol. Liq. 2009;146:23–28. [Google Scholar]
- Black G., Simmie J. M. J. Comput. Chem. 2010;31:1236–1248. doi: 10.1002/jcc.21410. [DOI] [PubMed] [Google Scholar]
- Adeuya A., Nash J. J., Kenttamaa H. I. J. Phys. Chem. A. 2010;114:12851–12857. doi: 10.1021/jp107254k. [DOI] [PMC free article] [PubMed] [Google Scholar]
- Masgrau L., González-Lafont À., Lluch J. M. Theor. Chem. Acc. 2003;110:352–357. [Google Scholar]
- Alecu I. M., Zheng J., Papajak E., Yu T., Truhlar D. G. J. Phys. Chem. A. 2012;116:12206–12213. doi: 10.1021/jp308460y. [DOI] [PubMed] [Google Scholar]
- Sarathy S. M., Oβwald P., Hansen N., Kohse-Hoinghaus K. Prog. Energy Combust. Sci. 2014;44:40–102. [Google Scholar]
- Merchant S. S., Zanoelo E. F., Speth R. L., Harper M. R., Geem K. M. V., Green W. H. Combust. Flame. 2013;160:1907–1929. [Google Scholar]
- Hansen N., Merchant S. S., Harper M. R., Green W. H. Combust. Flame. 2013;160:2343–2351. [Google Scholar]
- Grana R., Frassoldati A., Faravelli T., Niemann U., Ranzi E., Seiser R., Cattolica R., Seshadri K. Combust. Flame. 2010;157:2137–2154. [Google Scholar]
Associated Data
This section collects any data citations, data availability statements, or supplementary materials included in this article.


